by Contributed | Apr 11, 2022 | Technology
This article is contributed. See the original author and article here.
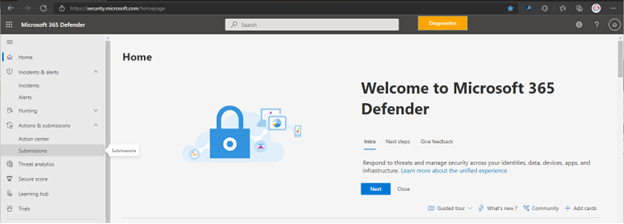
It’s time for a new, unified submissions experience
Your security team now has a “one-stop shop” for submitting emails, URLs, email attachments, and files in one, easy-to-use submission experience. To simplify the submission process, we are excited to announce a new unified submissions experience in the Microsoft 365 Defender portal (https://security.microsoft.com). With unified submissions (currently in public preview), you can submit files to Microsoft 365 Defender for review from within the portal. We are also adding the ability to submit a file directly from a Microsoft Defender for Endpoint Alert page.
Important note: Currently, the new submissions experience is available only in subscriptions that include Microsoft 365 Defender, Microsoft Defender for Endpoint Plan 2, or Microsoft Defender for Office.
Let’s look at the new unified submissions experience!
New entry points to submit items for analysis
With unified submissions in preview, you can submit files from these entry points in Microsoft 365 Defender:
- Submissions page. You can add a new submission to report a file as clean (false positive), unwanted software or malicious (false negative).
- An Alert page. While viewing an alert, you can choose the action to submit a file for analysis “Submit items to Microsoft for review”.
The Submissions portal that was previously under Email & collaboration is now in the unified submission surface.
Tabs you’ll see on the new Submissions page
The new, unified submissions page includes the following tabs:
- Emails
- URLs
- Email Attachments
- Files
- User reported messages
You can now see submission items broken out by type (Emails, Email Attachments, URLs, Files and User reported messages). A security admin can view the collection of emails that your users have submitted for review and create a submission to Microsoft if needed.
Note: If your subscription includes Microsoft 365 Defender, you’ll see all five tabs. If your subscription only includes Defender for Endpoint Plan 2, you’ll only see the Files tab. And, if your subscription only includes Defender for Office 365, you won’t see the Files tab.
The Alert page submission experience
You can now submit a file for analysis from the Alerts page. Open the Microsoft 365 Defender portal. Go to Incidents & alerts, and then select Alerts to view the list of alerts. You can then select a Microsoft Defender for Endpoint alert that contains an item you want to report.
Notice a checkbox on the alert submission form for “Include alert story.” By choosing this option, you’ll attach a JSON file of the alert story with your submission. That file will be shared with our analysts to improve the quality of results and the response time of your submission.

Here’s what the alert page submission entry point looks like:

And here’s an example of an alert page submission form:

The Submissions list
Your Submissions list enables you to see all of your company’s submissions in one place, organized by type: Emails, Email attachments, URLs, Files, and User reporting messages. You can also create a new submission on this page. (You must have the Global Administrator, Security Administrator, or Organization Management role assigned.)
To use the Submissions list, go to the Microsoft 365 Defender portal, and then select Submissions. Then choose one of the available options. In the following example, we are showing the File submission option:
The File submission list looks like this:

On the Files tab, we select Add new submission. This action opens the File submission form, which looks like this:

After submitting the file for analysis, the File submission results now look like this:

Known issues
When adding text in the Notes for Microsoft box, the cursor might jump to the end of the line when you try to place the cursor in the middle of an already typed line to add more text. We are working to resolve this issue.
Learn more
Want to learn more about Unified submissions? See Submit suspected files in Microsoft Defender for Endpoint for more details.
Let us know what you think!
We are excited to bring you this simplified submission experience! Try it out and let us know what you think. Tell us if the new, unified experience is helpful, and share any additional requests or suggestions you have for improving the experience!
by Contributed | Apr 10, 2022 | Technology
This article is contributed. See the original author and article here.
What is Service Bus
Fully managed enterprise Message Broker
Decouple applications and services from each other
Message Queues and Publish/Subscribe Topics
Load-balancing across Competing workers
High degree of Reliability and Throughput
What This Document will do?
Differentiate between Messages and Events
Look at the Orchestrators or Service Bus who can Produce and Consume Messages
Deep dive into Service Bus Concepts and Advanced Features
Detailed look at some of code examples for Producers and Consumers
Code examples discussed are available at Source Code
What is a Message?

Raw Data Produced by a service to be Consumed or Stored elsewhere
Contains the data that triggered the Message pipeline
Publisher of the Message has an expectation about how the Consumer handles the Message
Contract exists between the two sides
Service Bus – Deep Dive
Intended for traditional enterprise applications which require Transactions, Ordering, Duplicate detection, and Instantaneous Consistency
Enables cloud-native applications to provide reliable state transition management for business processes
Facilitates Highly Secure and Reliable communication across hybrid cloud solutions and can connect existing on-premises systems to cloud solutions
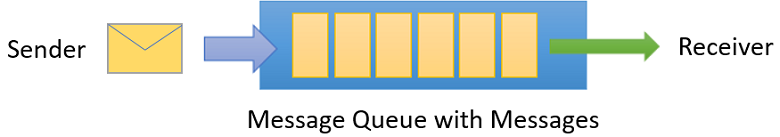
Brokered Messaging system. It stores messages in a broker (for example, a queue) until the consuming party is ready to receive the messages
Available either as Data Streams or Event Batches
Reliable Asynchronous message delivery (enterprise messaging as a service) that requires polling
Advanced messaging features like FIFO, Sessions, Transaction Scopes, Dead-lettering and Filtering and Duplicate Detection
At least once delivery
Optional in-order delivery
Queues

Offer First In, First Out (FIFO) message delivery to one or more competing consumers
Receivers typically Receive and Process messages in the order in which they were added to the queue, and only one message consumer receives and processes each message
Producers (senders) and Consumers (receivers) do not have to be sending and receiving messages at the same time, because messages are stored durably in the queue
Producer does not have to wait for a reply from the Consumer in order to continue to process and send messages
Related benefit is Load Levelling which enables producers and consumers to send and receive messages at different rates
- Brokered Transfer

Maximize Availability – delays arising in services won’t have an immediate and direct impact on the application
Producer can continue to post messages to the queue even when the service isn’t available or isn’t currently processing messages
Consumer can process at its own pace, without being overloaded
Maximize Scalability because both the number of queues and the number of services can be varied to meet demand
Competing Consumer

Multiple Receivers compete for messages on the same Queue
Provides Automatic Load Balancing of work to receivers volunteering for Jobs
Improves Reliability
Messages aren’t sent to a specific service instance
A failed service instance won’t block a Producer
Messages can be processed by any working service instance.
Scalable – The system can dynamically increase or decrease the number of instances of the consumer service as the volume of messages fluctuates.
Improve Resiliency
Consumer service instance reads and processes the Message as part of a transactional operation
If the Consumer service instance fails, this pattern can ensure that the message will be returned to the queue to be picked up and handled by another instance of the consumer service
Topics and Subscriptions

Provides a one-to-many form of communication, in a Publish/Subscribe pattern
Useful for scaling to large numbers of Recipients, each published message is made available to each subscription registered with the Topic
Messages are sent to a Topic and delivered to one or more associated subscriptions
Pre-Fetching

Prefetch feature can be enabled for a Service Bus client
The Receiver acquires Additional no. of Messages than intended by the application initially
With Pre-fetching enabled, Service Bus behaves differently in the following two scenarios
Receive-and-Delete mode
Messages acquired into the Prefetch Buffer are no longer available in the queue
Messages exist in the in-memory Prefetch Buffer until received into the application
Messages are Irrecoverable or Lost, If the client application ends before the Messages are Received into the application
Peek-Lock mode
Messages fetched into the Prefetch Buffer are in a Locked state
In case the Prefetch Buffer is large and processing takes long than message lock period – the subscribing client has to take appropriate measures as per the requirement
If the Lock expires Silently in the Prefetch Buffer, the Message is treated as Abandoned and is again made available for retrieval from the Queue
If the requirement is to achieve High Reliability for message processing and processing takes significant work and time, the recommendation is to use the Prefetch feature conservatively, or not at all
If the requirement is to achieve High Throughput and message processing is generally quicker, faster, the recommendation is to go for Prefetch option and get significant throughput benefits
Service Bus – Reliability
Throttling
Throttling from an external system on which Service Bus depends
Throttling occurs from interactions with storage and compute resources
Enabling Partitioning on a Queue or Topic to reduce the probability of throttling
Issue for an Azure dependency
Issue for a system on which Service Bus depends. For example, a given part of storage can encounter issues
To work around these types of issues, Service Bus regularly investigates and implements mitigations
Due to the nature of the mitigation, a sent message can take up to 15 minutes to appear in the affected queue or subscription and be ready for a receive operation
Service Bus failure on a single subsystem
Failure of Service Bus on single subsystem. In this situation, a compute node can get into an inconsistent state and must restart itself, causing all entities it serves to load balance to other nodes. This in turn can cause a short period of slow message processing
The client application generates a System.TimeoutException or MessagingException exception. Service Bus contains a mitigation for this issue in the form of automated client retry logic. Once the retry period is exhausted and the message is not delivered
Peek Lock – At least once

Sender sends the messages.
Receiver locks the message from other receivers.
The next Receiver locks the next message.
Complete removes the message from the queue.
Abandon gives up lock and makes it available for the next receiver
Receive and Delete – At most once

Sender sends the messages
Receiver receives the message and deletes from the queue
The next receiver receives and Deletes the next message
Abandon and Complete operations are not needed
Message Sessions

Sessions allow pinning sets of related sets of related messages to a receiver even when using competing consumers
Session state may be used to store intermediate state for a session
A Session Receiver is created by a client accepting a session
When the session is accepted and held by a client, the client holds an exclusive lock on all messages with that session’s session ID in the queue or subscription. It will also hold exclusive locks on all messages with the session ID that will arrive later
The Lock is released when you call close methods on the receiver or when the lock Expires. There are methods on the receiver to Renew the locks as well
When multiple Concurrent Receivers pull from the Queue, the messages belonging to a particular Session are dispatched to the specific Receiver that currently holds the lock for that session
The Session Lock held by the session receiver is an umbrella for the message locks used by the peek-lock settlement mode
Only one Receiver can have a lock on a session
A Receiver may have many in-flight messages, but the messages will be received in order
Abandoning a message causes the same message to be served again with the next receive operation

Duplicate Detection
Helps keep track of the application-controlled MessageId of all messages sent into a queue or topic during a specified time window
If any new message is sent with MessageId that was logged during the time window, the message is reported as accepted (the send operation succeeds)
Newly sent message is instantly Ignored and Dropped. No other parts of the message other than the MessageId are considered
Application control of the Identifier is essential, because only that allows the application to tie the MessageId to a business process context from which it can be predictably reconstructed when a failure occurs
Duplicate detection history time window can be configured during which message-ids are retained. This value defaults to 10 minutes for queues and topics, with a minimum value of 20 seconds to maximum value of 7 days
Enabling duplicate detection and the size of the window directly impact the queue (and topic) throughput, since all recorded message-ids must be matched against the newly submitted message identifier
Keeping the window small means that fewer message-ids must be retained and matched and hence less impact on Throughput
For high throughput entities that require Duplicate Detection, ideally keep the window as small as possible
Schedule Messages
You can submit messages to a queue or topic for delayed processing; for example, to schedule a job to become available for processing by a system at a certain time. This capability realizes a reliable distributed time-based scheduler.
Scheduled messages do not materialize in the queue until the defined enqueue time. Before that time, scheduled messages can be canceled. Cancellation deletes the message
The SequenceNumber for a scheduled message is only valid while the message is in this state. As the message transitions to the active state, the message is appended to the queue as if had been enqueued at the current instant, which includes assigning a new SequenceNumber
Because the feature is anchored on individual messages and messages can only be enqueued once, Service Bus does not support recurring schedules for messages
Dead Letter Messages

A Secondary sub-queue, called a Dead-Letter queue (DLQ)
The dead-letter queue doesn’t need to be explicitly created
Can’t be deleted or managed independent of the main entity
Holds Messages that can’t be delivered to any receiver, or Messages that couldn’t be processed
Messages can then be removed from the DLQ and inspected. An application might rectify issues and resubmit the message
Several Activities in Service Bus can cause messages to get pushed to the DLQ
Receiving Application can also explicitly move messages to the DLQ
Deferred Messages

Deferral is a feature created specifically for workflow processing scenarios. Workflow frameworks may require certain operations to be processed in a particular order
They may have to postpone processing of some received messages until prescribed prior work that’s informed by other messages has been completed
Ultimately, deferral aids in reordering messages from the arrival order into an order in which they can be processed, while leaving those messages safely in the message store for which processing needs to be postponed
If a message can’t be processed because a particular resource for handling that message is temporarily unavailable but message processing shouldn’t be summarily suspended, a way to put that message on the side for a few minutes is to remember the sequence number in a scheduled message to be posted in a few minutes, and re-retrieve the deferred message when the scheduled message arrives
If a message handler depends on a database for all operations and that database is temporarily unavailable, it shouldn’t use deferral, but rather suspend receiving messages altogether until the database is available again
Retrieving deferred messages
Deferred messages remain in the main queue along with all other active messages (unlike dead-letter messages that live in a subqueue), but they can no longer be received using the regular receive operations. Deferred messages can be discovered via message browsing if an application loses track of them
To retrieve a deferred message, its owner is responsible for remembering the sequence number as it defers it
Any receiver that knows the sequence number of a deferred message can later receive the message by using receive methods that take the sequence number as a parameter. For more information about sequence numbers, see Message sequencing and timestamps
Auto Forwarding

If the destination entity accumulates too many messages and exceeds the quota, or the destination entity is disabled, the source entity adds the messages to its dead-letter queue until there is space in the destination (or the entity is re-enabled)
Messages continue to live in the dead-letter queue, so you must explicitly receive and process them from the dead-letter queue
A first-level topic with 20 subscriptions, each of them chained to a second-level topic with 200 subscriptions, allows for higher throughput than a first-level topic with 200 subscriptions, each chained to a second-level topic with 20 subscriptions
To create a subscription that is chained to another queue or topic, the creator of the subscription must have Manage permissions on both the source and the destination entity. Sending messages to the source topic only requires Send permissions on the source topic
Messages that exceed 4 hops are dead-lettered


Transaction Processing

Groups two or more operations together into an execution scope
Ensure that all Operations belonging to a given group of operations either Succeed or Fail jointly
Transactions act as one unit, which is often referred to as atomicity
Send several messages to one Queue/Topic from within a transaction scope
Operations available within a transaction scope –
Send
Complete
Abandon
Dead letter
Defer
Renew lock
Message from Sender reaches Transfer Queue or Topic
Order of Transactions within the Transaction Scope is important; e,.g.
Receive – Read from the Transfer Queue or Topic
Send1 – Send to Queue1 or Topic1
Send2 – Send to Queue2 or Topic2
How to Send Messages
SendQueueMessageAsync
private async Task<ResponseModel> SendQueueMessageAsync
                                          (string queueNameString, HeaderModel headerModel,
                                           List<MessageModel> messagesList)
{

    kServiceBusClient = new ServiceBusClient(headerModel.ConnectionString);
    var serviceBusSender = kServiceBusClient.CreateSender(queueNameString);
    var serviceBusMessagesList = PrepareAllQueueMessages(messagesList);
    ResponseModel responseModel = null;

    try
    {

      await serviceBusSender.SendMessagesAsync(serviceBusMessagesList);
      responseModel = new ResponseModel()
      {

        Code = 200,
        Message = $"message batch sent:{serviceBusMessagesList.Count}"

      };
    }
    catch(ServiceBusException ex)
    {

      responseModel = new ResponseModel()
      {

        Code = 400,
        Message = ex.Message

      };
    }
    finally
    {
      await serviceBusSender.DisposeAsync();
    }

    return responseModel;

}
ScheduleQueueMessageAsync
private async Task<List<ResponseModel>> ScheduleQueueMessageAsync
                                                (string queueNameString,
                                                 HeaderModel headerModel,
                                                 List<MessageModel> messagesList,
                                                 Dictionary<string, int> queryStringMap)
{

    kServiceBusClient = new ServiceBusClient(headerModel.ConnectionString);
    var serviceBusSender = kServiceBusClient.CreateSender(queueNameString);
    var serviceBusMessagesList = PrepareAllQueueMessages(messagesList);
    int delayMinutes = (int)(queryStringMap["delayBy"])/60;
    long scheduleSequence = 0;
    var responseModelsList = new List<ResponseModel>();

    try
    {

      var scheduledTasksList = serviceBusMessagesList.Select
        (async (ServiceBusMessage serviceBusMessage) =>
         {

           scheduleSequence = await serviceBusSender.ScheduleMessageAsync
             (serviceBusMessage,
              DateTimeOffset.Now.AddMinutes(delayMinutes));
           var responseModel = new ResponseModel()
           {

             Code = 200,
             Message = $"message scheduled:{scheduleSequence}"

           };
           responseModelsList.Add(responseModel);

         }).ToList();

      await Task.WhenAll(scheduledTasksList);

    }
    catch (ServiceBusException ex)
    {

      var responseModel = new ResponseModel()
      {

        Code = 400,
        Message = ex.Message

      };
      responseModelsList.Add(responseModel);

    }
    finally
    {
      await serviceBusSender.DisposeAsync();
    }

    return responseModelsList;

}
How to Receive Messages
ReadFromDeadLetterQueue
public async Task<IActionResult> ReadFromDeadLetterQueue
                                         (string queueNameString,
                                         [FromHeader] HeaderModel headerModel)
{

    kServiceBusClient = new ServiceBusClient(headerModel.ConnectionString);
    var deadLetterReceiver = kServiceBusClient.CreateReceiver(queueNameString,
		new ServiceBusReceiverOptions()
		{

				SubQueue = SubQueue.DeadLetter,
        ReceiveMode = ServiceBusReceiveMode.ReceiveAndDelete

    });

    MessageModel receivedModel = null;
    ErrorModel errorModel = null;

    try
    {

      var receivedMessage = await deadLetterReceiver.ReceiveMessageAsync(kWaitTimeSpan);
      if (receivedMessage == null)
        throw new ArgumentNullException(nameof(receivedMessage));

      receivedModel = JsonConvert.DeserializeObject<MessageModel>
        (Encoding.UTF8.GetString(receivedMessage.Body));
      if (receivedModel == null)
        throw new ArgumentNullException(nameof(receivedModel));

    }
    catch (ArgumentNullException ex)
    {

      errorModel = new ErrorModel()
      {

        Code = 500,
        Message = ex.Message

      };

    }
    catch (ServiceBusException ex)
    {

      errorModel = new ErrorModel()
      {

        Code = 500,
        Message = ex.Message

      };
    }
    finally
    {

      await deadLetterReceiver.DisposeAsync();

    }

    return Ok((receivedModel != null) ? receivedModel : errorModel);

}
Service Bus Listener
// Service Bus SDK client
private ServiceBusClient _serviceBusClient;

// Message processor for Service Bus
private ServiceBusProcessorOptions _serviceBusProcessorOptions;
private ServiceBusProcessor _serviceBusProcessor;

// Session based Message processor for Service Bus
private ServiceBusSessionProcessorOptions _serviceBusSessionProcessorOptions;
private ServiceBusSessionProcessor _serviceBusSessionProcessor;

....
public MessageProcessor(string connectionString)
{

  _connectionString = connectionString;
  _serviceBusClient = new ServiceBusClient(connectionString);

}

.....
public async Task StartProcessingAsync(MessageProcessorCallback messageProcessorCallback)
{

  _serviceBusProcessor.ProcessMessageAsync += (ProcessMessageEventArgs processMessageEventArgs) =>
  {

    messageProcessorCallback.Invoke(processMessageEventArgs, null);
    return Task.CompletedTask;

  };

  _serviceBusProcessor.ProcessErrorAsync += (ProcessErrorEventArgs processErrorEventArgs) =>
  {

    messageProcessorCallback.Invoke(null, processErrorEventArgs);
    return Task.CompletedTask;

  };

  await _serviceBusProcessor.StartProcessingAsync();

}
Start Message Processing for a Session
public async Task StartSessionProcessingAsync (MessageSessionProcessorCallback
                                               messageSessionProcessorCallback)
{

    _serviceBusSessionProcessor.ProcessMessageAsync +=
    (ProcessSessionMessageEventArgs processSessionMessageEventArgs) =>
    {

      messageSessionProcessorCallback.Invoke(processSessionMessageEventArgs, null);
      return Task.CompletedTask;

    };

    _serviceBusSessionProcessor.ProcessErrorAsync +=
    (ProcessErrorEventArgs processErrorEventArgs) =>
    {

      messageSessionProcessorCallback.Invoke(null, processErrorEventArgs);
      return Task.CompletedTask;

    };

    await _serviceBusSessionProcessor.StartProcessingAsync();

}
How to perform Transaction processing
ForwardTopicAsync
public async Task<IActionResult> ForwardToTopicAsync
                                         (string topicNameString, string subscriptionNameString,
                                         [FromHeader] ForwardHeaderModel forwardHeaderModel,
                                         [FromQuery] Dictionary<string, string> queryStringMap)
{

    var serviceBusClientOptions = new ServiceBusClientOptions()
    {

      EnableCrossEntityTransactions = true,
      TransportType = ServiceBusTransportType.AmqpTcp

    };

    kServiceBusClient = new ServiceBusClient(forwardHeaderModel.ConnectionString,
                                             serviceBusClientOptions);
    var serviceBusReceiverOptions = new ServiceBusReceiverOptions()
    {

      PrefetchCount = 2,
      ReceiveMode = ServiceBusReceiveMode.PeekLock

    };

    ServiceBusReceiver serviceBusReceiver = null;
    ServiceBusSender nextHopSender = null;
    OCRModel receivedModel = null;
    ErrorModel errorModel = null;

    try
    {

      var sessionNameString = queryStringMap["session"];
      var nextHopTopicNameString = forwardHeaderModel.NextHopTopicName;
      var nextHopSessionNameString = forwardHeaderModel.NextHopSessionName;

      serviceBusReceiver = kServiceBusClient.CreateReceiver
        (topicNameString, subscriptionNameString,
         serviceBusReceiverOptions);
      nextHopSender = kServiceBusClient.CreateSender(nextHopTopicNameString);

      var receivedMessage = await serviceBusReceiver?.ReceiveMessageAsync(kWaitTimeSpan);
      if (receivedMessage == null)
        throw new ArgumentNullException(nameof(receivedMessage));

      receivedModel = JsonConvert.DeserializeObject<OCRModel>
        (Encoding.UTF8.GetString(receivedMessage.Body));
      if (receivedModel == null)
        throw new ArgumentNullException(nameof(receivedModel));

      using (var ts = new TransactionScope(TransactionScopeAsyncFlowOption.Enabled))
      {

        await serviceBusReceiver.CompleteMessageAsync(receivedMessage);

        var serviceBusMessage = new ServiceBusMessage(receivedMessage);
        serviceBusMessage.TransactionPartitionKey = receivedMessage.PartitionKey;
        serviceBusMessage.SessionId = nextHopSessionNameString;

        await nextHopSender.SendMessageAsync(serviceBusMessage);
        ts.Complete();

      }
    }
    catch (ArgumentNullException ex)
    {

      errorModel = new ErrorModel()
      {

        Code = 400,
        Message = ex.Message

      };

    }
    catch (ServiceBusException ex)
    {

      errorModel = new ErrorModel()
      {

        Code = 500,
        Message = ex.Message

      };

    }
    finally
    {

      if (serviceBusReceiver != null)
        await serviceBusReceiver.DisposeAsync();

      if (nextHopSender != null)
        await nextHopSender.DisposeAsync();

    }

    return Ok((receivedModel != null) ? receivedModel : errorModel);

}
References
by Contributed | Apr 9, 2022 | Technology
This article is contributed. See the original author and article here.
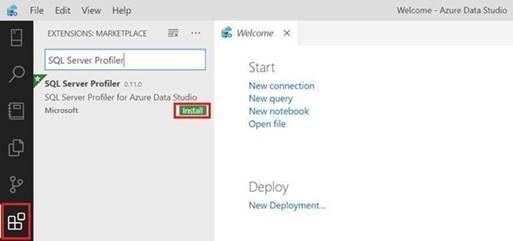
The SQL Server Profiler using SQL Server Management Studio (SSMS) currently support Azure SQL Manage Instance and SQL Server platforms and does not support Azure SQL DB platform, so as a workaround we can use SQL Server Profiler extension for Azure Data Studio (ADS).
“The SQL Server Profiler extension provides a simple SQL Server tracing solution similar to SQL Server Management Studio (SSMS) Profiler except built using Extended Events. SQL Server Profiler is very easy to use and has good default values for the most common tracing configurations. The UX is optimized for browsing through events and viewing the associated Transact-SQL (T-SQL) text. The SQL Server Profiler for Azure Data Studio also assumes good default values for collecting T-SQL execution activities with an easy to use UX. This extension is currently in preview.” More information can be found here.
In this article we will cover the below contents:
- How to use the SQL Server Profiler extension for Azure SQL DB.
- How to export the output session into an XML-file (.xml).
- How to export the output session into an XEL-file (.xel) and store it into an Azure Storage Account.
Prerequisites:
How to use the SQL Server Profiler extension for Azure SQL DB:
- Open ADS and click on Extensions from the left-side then search for SQL Profiler For Azure Data Studio and finally click on Install, please have look at the below snapshot:
- Click on Connections (Left-side), then click on Add Connection, please have a look at the below snapshot:

- In the add new connection dialog, fill in your Azure SQL Server information and select the database, please have a look at the below snapshot:

- In the create new firewall rule, click on reenter your credentials, please have a look at the below snapshot:

- After entering your credentials and back to the firewall rule dialog, select add my client IP and then click OK, please have a look at the below snapshot:

- After that you will be back to the connection dialog, then select your database and click connect, please have a look at the below snapshot:

- After establishing a connection, right-click on your Azure SQL database and select Launch profiler (Alt+P), please have a look at the below snapshot:

- From Start New Profiler Session dialog, enter session name and click on Start, please have a look at the below snapshot:

- A profiler tab will appear with all the events that is currently running on the Azure SQL database, please have a look at the below snapshot:

- Right-click on your Azure SQL database and select New Query, please have a look at the below snapshot:

- Enter your specified query and click on Run, then click on the profiler tab and you will notice your query event is logged, please have a look at the below snapshot:

How to export the output session into an XML-file (.xml):
- Open SSMS and connect to your Azure Database.
- Open Extended Events and select the session that you have created in Azure Data Studio.
- Right-click on the session buffer and select View Target Data.
- In the Session buffer tab (in the right-side) right-click and select Refresh (XML data will be created).
- Click on XML Data and save the new view tab as XML and please send it to me.
Please have a look at the following snapshots:


How to export the output session into an XEL-file (.xel) and store it into an Azure Storage Account:
- From SSMS, right-click on your session and select properties
- From session properties, select Data Storage to and enter your Azure Storage Account to save the file as “.xel” as shown in the below image and click OK.
- From SSMS, right-click on your session and select start session (if not running already).
- After you finish from capturing events, open your storage account where you saved your “.xel” file.
- Download it into your local machine then open it using SSMS and follow this document to export the results into table to be able to filter the results as per your needs.

More information can be found in the below document:
by Contributed | Apr 8, 2022 | Technology
This article is contributed. See the original author and article here.
This blog shows how to create dashboards to visualize the performance of the sample manufacturing operation presented in the blog Rewind the Metaverse with Data History for Azure Digital Twins. You can use these examples to build your own dashboards to analyze the behavior of environments that you model using Azure Digital Twins.
To get started, complete the following prerequisites.
- Gain access to a Grafana resource where you can create your dashboards.
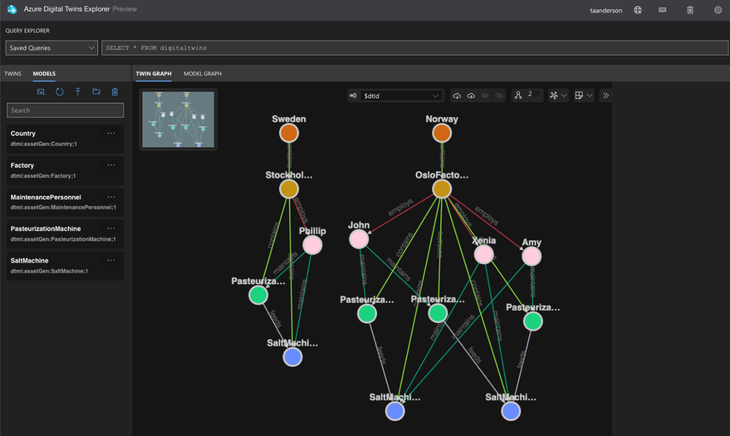
- Complete the steps in the above-mentioned blog or in the article Use data history with Azure Data Explorer. Upon completion, you will have a working data history connection between Azure Digital Twins and Azure Data Explorer that enables you to perform historical analytics on a simulated dairy operation containing factories, people, and machines across multiple locations. Below is a visualization of the twin graph of the dairy operation created during the exercise.
Next, follow the below steps to create dashboards to visualize the performance of the dairy operation.
Connect Grafana to an Azure Data Explorer data source
The data history feature for Azure Digital Twins historizes twin changes to an Azure Data Explorer database. You can connect this database to Grafana by following the steps in Visualize data from Azure Data Explorer in Grafana (the video included in the guide is a great place to start). When installing the Azure Data Explorer plugin, make sure that the plugin is version 3.6.1 or higher.
Assign your app registration the Azure Digital Twins Data Reader role
In the above step, you will create an app registration. Assign this app registration the Azure Digital Twins Data Reader role on your Azure Digital Twins instance. This will enable the KQL queries run by the dashboards to query your Azure Digital Twins instance.
Start by viewing your Azure Digital Twins instance in the portal. Select Access Control (IAM) from the left navigation and select Add role assignment.

In the next screen, select the Azure Digital Twins Data Reader role, and select Next.

In the next screen, choose +Select members. Search for the name of your app registration and choose Select.

On the next screen, select Review + assign.
Import the Contoso Dairy dashboards into Grafana
Three dashboard JSON files are provided in this repo folder. Download the files. Import the Machine View by Factory, Maintenance Technician dashboard into Grafana as shown below.

In the import dialog, select the Azure Data Explorer data source you created earlier and enter values for your Azure Digital Twins endpoint and data history table name. Complete this same process for the other dashboard JSON files.

Once a dashboard loads, you will see time series charts and gauges for machines in the dairy operation. You can make selections from the dropdown menus at the top to drill down on the machines of interest.

When you select an item from the menu, it triggers a query to the twin graph of the dairy operation that searches for twins based on twin name, twin type, relationships between twins, and other parameters. The result of the query is held in a Grafana variable. To view variables, click on the gear icon in the upper right-hand corner of a dashboard, then click on Variables in the left navigation panel.

The KQL queries for most variables dynamically assemble an Azure Digital Twins query via the strcat() KQL function. In many cases, the assembled Azure Digital Twins query references other Grafana variables from other menus. Grafana denotes variables in a query expression with a $. For example, the MaintTech variable is based on a query that searches for all twins that have an employs relationship with a factory twin, where the factory twin ID is defined by the Factory variable. The result of the query is held in the MaintTech Grafana variable.
You can also view the KQL queries that fetch data for a panel. Click on Edit to view the panel query.

In the editor, you can view the query for each tile that uses Grafana variables. These variables are driven by the menu queries discussed above.

Conclusion
In this walkthrough, you learned how to use Grafana to support visualization experiences for environments modeled in Azure Digital Twins. The relationships in the underlying twin graph of the dairy operation combined with time series data enable a variety of performance analytics. Example analytics include summing the output of machines that feed a common downstream machine, comparing the performance of similar machines in the same factory, or comparing machines in different factories. Explore the query for each Grafana dashboard in this blog as well as additional queries here for more examples.
by Scott Muniz | Apr 7, 2022 | Security, Technology
This article is contributed. See the original author and article here.
CISA’s Sharing Cyber Event Information Fact Sheet provides our stakeholders with clear guidance and information about what to share, who should share, and how to share information about unusual cyber incidents or activity.
CISA uses this information from partners to build a common understanding of how adversaries are targeting U.S. networks and critical infrastructure sectors. This information fills critical information gaps and allows CISA to rapidly deploy resources and render assistance to victims suffering attacks, analyze incoming reporting across sectors to spot trends, and quickly share that information with network defenders to warn other potential victims. Click the fact sheet link to learn more and visit our Shields Up site for useful information.
by Contributed | Apr 7, 2022 | Technology
This article is contributed. See the original author and article here.
In our continued effort to improve collaboration in Visio for the web, we’re excited to announce the availability of the popular Office feature, @mentions. This capability makes it easier to collaborate on shared diagrams by giving you the ability to get someone’s attention directly within the comments pane and pull them into the file where you need their input.
Here’s how it works
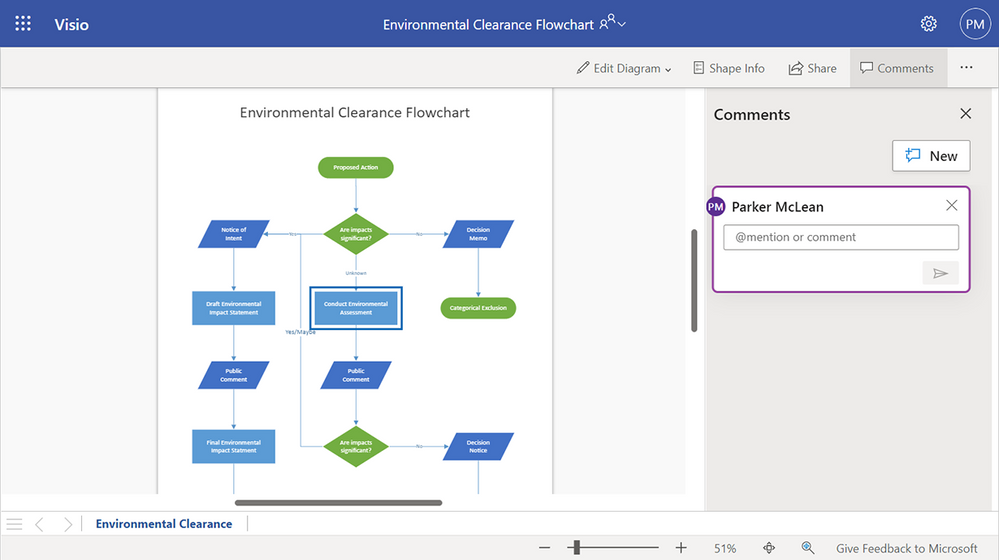
To get started, sign in to visio.office.com and open an existing Visio file saved on SharePoint or OneDrive. By default, the file will open in Visio Viewer. To add a new comment to the page itself, select Comments > New. You can also add a new comment to any object on the page, such as a shape or connector by selecting the object and then selecting Comments > New.
Example of a new comment being created in Visio Viewer.
Alternatively, you can open the file in Visio Editor by selecting Edit Diagram > Edit in Browser. Right-click anywhere on the page or on any object on the page and add a new comment by selecting New Comment from the floating context menu that appears on right-click or from the Insert or Review tab > New Comment. Type “@” and the first few letters of the person’s first or last name. You’ll see a drop-down list of contacts that updates as you type more characters. Select the name of the person you’d like to tag.
 Example of a list of names that auto-populates when using the @mention feature in Visio for the web.
To be more casual, you can delete everything except the person’s first name in the @mention. To include more people, type “@” again and mention someone else.
 Example of a posted comment using the @mention feature in Visio for the web.
Note, if the person you are mentioning does not already have permission to open the Visio file, you will be asked to provide them with access.
 Example of the Share dialogue box that appears when a recipient does not have access to a file.
An email notification that includes a preview of the comment thread and diagram will automatically be sent to the person(s) you tag. In addition, the email notification includes a link that will take them to the comment in the file. This link will open the file in Visio Viewer, bringing them directly into the diagram and into the conversation. The person can either reply to the comment thread directly in Visio Viewer or open the diagram in Visio Editor by selecting Edit in Browser from the Edit Diagram drop-down.
 Example of an email notification showing a preview of the comment thread and flowchart, as well as a direct link to view the comment in the document.
If someone gets mentioned more than once in a short period of time, they will receive a batch of notifications in a single summary email.
Availability
The ability to @mention your colleagues in a Visio file is now available in the Viewer and Editor in both Visio for the web and Microsoft Teams.
Requirements and known limitations
- The file must be saved in SharePoint or OneDrive.
- Tenants with Conditional Access will not be able to create @mentions. Please contact your IT Administrator for more information.
- The @mentions feature does not work for guest or external accounts—you cannot @mention such accounts, nor can guest or external accounts @mention collaborators in Visio files outside of their tenant.
- Files containing @mentions can be opened in the Visio desktop app; however, any @mentions will appear as plain text. If a comment containing an @mention is edited, the @mention will be permanently converted to plain text.
Give us your feedback! Please tell us about your experience with @mentions in Visio for the web by leaving a comment below, sending feedback via the Visio Feedback portal, or submitting feedback directly in the Visio web app using “Give Feedback to Microsoft” in the bottom right corner. Follow us on Twitter and LinkedIn to stay informed with the latest updates for Visio.
Continue the conversation by joining us in the Microsoft 365 Tech Community! Whether you have product questions or just want to stay informed with the latest updates on new releases, tools, and blogs, Microsoft 365 Tech Community is your go-to resource to stay connected!

Recent Comments