Debugging PostgreSQL CI failures faster: 4 tips

Debugging PostgreSQL CI failures faster: 4 tips

This article is contributed. See the original author and article here.

Postgres is one of the most widely used databases and supports a number of operating systems. When you are writing code for PostgreSQL, it’s easy to test your changes locally, but it can be cumbersome to test it on all operating systems. A lot of times, you may encounter failures across platforms and it can get confusing to move forward while debugging. To make the dev/test process easier for you, you can use the Postgres CI.


When you test your changes on CI and see it fail, how do you proceed to debug from there? As a part of our work in the open source Postgres team at Microsoft, we often run into CI failures—and more often than not, the bug is not obvious, and requires further digging into.


In this blog post, you’ll learn about techniques you can use to debug PostgreSQL CI failures faster. We’ll be discussing these 4 tips in detail:


Before diving into each of these tips, let’s discuss some basics about how Postgres CI works.

Elephant-debugging-postgresql-ci-failures-1920x1080.png


Introduction to the PostgreSQL CI


PostgreSQL uses Cirrus CI for its continuous integration testing. To use it for your changes, Cirrus CI should be enabled on your GitHub fork. The details on how to do this are in my colleague Melih Mutlu’s blog post about how to enable the Postgres CI. When a commit is pushed after enabling CI; you can track and see the results of the CI run on the Cirrus CI website. You can also track it in the “Checks” GitHub tab.


Cirrus CI works by reading a .cirrus.yml file from the Postgres codebase to understand the configuration with which a test should be run. Before we discuss how to make changes to this file to debug further, let’s understand its basic structure:


# A sequence of instructions to execute and
# an execution environment to execute these instructions in
task:
  # Name of the CI task
  name: Postgres CI Blog Post

  # Container where CI will run
  container:
    # Container configuration
    image: debian:latest
    cpu: 4
    memory: 12G

  # Where environment variables are configured
  env:
    POST_TYPE: blog
    FILE_NAME: blog.txt

  # {script_name}_script: Instruction to execute commands
  print_post_type_script:
    # command to run at script instruction
    - echo "Will print POST_TYPE to the file"
    - echo "This post's type is ${POST_TYPE}" > ${FILE_NAME}

  # {artifacts_name}_artifacts: Instruction to store files and expose them in the UI for downloading later
  blog_artifacts:
    # Path of files which should be relative to Cirrus CI’s working directory
    paths:
      - "${FILE_NAME}"
    # Type of the files that will be stored
    type: text/plain


Figure 1: Screenshot of the Cirrus CI task run page. You can see that it run script and artifacts instructions correctly.Figure 1: Screenshot of the Cirrus CI task run page. You can see that it run script and artifacts instructions correctly.

Figure 2: Screenshot of the log file on Cirrus CI. The gathered log file is uploaded to the Cirrus CI.Figure 2: Screenshot of the log file on Cirrus CI. The gathered log file is uploaded to the Cirrus CI.

As you can see, the 
echo commands are run at script instruction. Environment variables are configured and used in the same script instruction. Lastly, the blog.txt file is gathered and uploaded to Cirrus CI. Now that we understand basic structure, let’s discuss some tips you can follow when you see CI failures.


Tip #1: Connect to the CI environment with a terminal


When Postgres is working on your local machine but you see failures on CI, it’s generally helpful to connect to the environment where it fails and check what is wrong.


You can achieve easily that using the RE-RUN with terminal button on the CI. Also, typically, a CI run can take time as it needs to find available resources to start and rerun instructions. However, thanks to this option, that time is saved as the resources are already allocated.


After the CI’s task run is finished, there is a RE-RUN button on the task’s page.

Figure 3: There is an arrow on the right of the RE-RUN button, if you press it the “Re-Run with Terminal Access” button will appear.Figure 3: There is an arrow on the right of the RE-RUN button, if you press it the “Re-Run with Terminal Access” button will appear.

You may not have noticed it before, but there is a small arrow on the right of the RE-RUN button. When you click this arrow, the “Re-Run with Terminal Access” button will appear. When this button is clicked, the task will start to re-run and shortly after you will see the Cirrus terminal. With the help of this terminal, you can run commands on the CI environment where your task is running. You can get information from the environment, change configurations and re-test your task.


Note that the re-run with terminal option is not available for Windows yet, but there is ongoing work to support it.


Tip #2: Enable build-time debug options and use them on CI


Postgres and meson provide additional build-time debug options to generate more information to find the root cause of certain types of errors. Some examples of build options which might be useful to set are:


  • -Dcassert=true [defaults to false]: Turns on various assertion checks. This is a debugging aid. If you are experiencing strange problems or crashes you might want to turn this on, as it might expose programming mistakes.

  • -Dbuildtype=debug [defaults to debug]: Turns on basic warnings and debug information and disables compiler optimizations.

  • -Dwerror=true [defaults to false]: Treat warnings as errors.

  • -Derrorlogs=true [defaults to true]: Whether to print the logs from failing tests.


While building Postgres with meson, these options can be setup using the meson setup [] [] or the meson configure commands.


These options can either be enabled with the “re-running with terminal access” option or by editing the cirrus.yml config file. Cirrus CI has a script instruction in the .cirrus.yml file to execute a script. These debug options could be added to the script instructions in which meson is configured. For example:


configure_script: |
  su postgres <<-EOF
    meson setup 
      -Dbuildtype=debug 
      -Dwerror=true 
      -Derrorlogs=true 
      -Dcassert=true 
      ${LINUX_MESON_FEATURES} 
      -DPG_TEST_EXTRA="$PG_TEST_EXTRA" 
      build
  EOF


Once it’s written as such, the debug options will be activated next time CI runs. Then, you can check again if the build fails and investigate the logs in a more detailed manner. You may also want to store these logs to work on them later. To gather the logs and store them, you can follow the tip below.


Tip #3: Gathering Postgres logs and other files from CI runs


Cirrus CI has an artifact instruction to store files and expose them in the UI for downloading later. This can be useful for analyzing test or debug output offline. By default, Postgres’ CI configuration gathers log, diff, regress log, and meson’s build files—as can be seen below:


testrun_artifacts:
  paths:
    - "build*/testrun/**/*.log"
    - "build*/testrun/**/*.diffs"
    - "build*/testrun/**/regress_log_*"
  type: text/plain

meson_log_artifacts:
  path: "build*/meson


If there are other files that need to be gathered, another artifact instruction could be written or the current artifact instruction could be updated at the .cirrus.yml file. For example, if you want to collect the docs to review or share with others offline, you can add the instructions below to the task in the .cirrus.yml file.


configure_script: su postgres -c 'meson setup build'

build_docs_script: |
  su postgres <<-EOF
    cd build
    ninja docs
  EOF

docs_artifacts:
  path: build/doc/src/sgml/html/*.html
  type: text/html


Then, collected logs will be available in the Cirrus CI website in html format.

Figure 4: Screenshot of the uploaded logs on the Cirrus CI task run page. Logs are uploaded to the Cirrus CI and reachable from the task run page.Figure 4: Screenshot of the uploaded logs on the Cirrus CI task run page. Logs are uploaded to the Cirrus CI and reachable from the task run page.


Tip #4: Running specific commands on failure


Apart from the tips mentioned above, here is another tip you might find helpful. At times, we want to run some commands only when we come across a failure. This might be to avoid unnecessary logging and make CI runs faster for successful builds. For example, you may want to gather the logs and stack traces only when there is a test failure. The on_failure instruction helps to run certain commands only in case of an error.


on_failure:
  testrun_artifacts:
    paths:
      - "build*/testrun/**/*.log"
      - "build*/testrun/**/*.diffs"
      - "build*/testrun/**/regress_log_*"
    type: text/plain

  meson_log_artifacts:
    path: "build*/meson-logs/*.txt"
    type: text/plain


As an example, in the above, the logs are gathered only in case of a failure.


Making Postgres Debugging Easier with CI


While working on multi-platform databases like Postgres, debugging issues can often be difficult. Postgres CI makes it easier to catch and solve errors since you can work on and test your changes on various settings and platforms. In fact, Postgres automatically runs CI on every commitfest entry via Cfbot to catch errors and report them.


These 4 tips for debugging CI failures should help you speed up your dev/test workflows as you develop Postgres. Remember to use the terminal to connect CI environment, gather logs and files from CI runs, use build options on CI, and run specific commands on failure. I hope these tips will make Postgres development easier for you!

Mozilla Releases Security Updates for Firefox

This article is contributed. See the original author and article here.

Mozilla has released security updates to address vulnerabilities in Firefox ESR and Firefox. An attacker could exploit some of these vulnerabilities to take control of an affected system.

CISA encourages users and administrators to review Mozilla’s security advisories for Firefox ESR 102.7 and Firefox 109 for more information and apply the necessary updates.

CISA Adds One Known Exploited Vulnerability to Catalog

This article is contributed. See the original author and article here.

CISA has added one new vulnerability to its Known Exploited Vulnerabilities Catalog, based on evidence of active exploitation. This type of vulnerability is a frequent attack vector for malicious cyber actors and poses a significant risk to the federal enterprise. Note: To view the newly added vulnerabilities in the catalog, click on the arrow in the “Date Added to Catalog” column, which will sort by descending dates.

Binding Operational Directive (BOD) 22-01: Reducing the Significant Risk of Known Exploited Vulnerabilities established the Known Exploited Vulnerabilities Catalog as a living list of known CVEs that carry significant risk to the federal enterprise. BOD 22-01 requires FCEB agencies to remediate identified vulnerabilities by the due date to protect FCEB networks against active threats. See the BOD 22-01 Fact Sheet for more information.

Although BOD 22-01 only applies to FCEB agencies, CISA strongly urges all organizations to reduce their exposure to cyberattacks by prioritizing timely remediation of Catalog vulnerabilities as part of their vulnerability management practice. CISA will continue to add vulnerabilities to the Catalog that meet the specified criteria. 

The Microsoft Supply Chain Platform enables resiliency for retailers

The Microsoft Supply Chain Platform enables resiliency for retailers

This article is contributed. See the original author and article here.

Resiliency for retailers might best be understood by thinking about the delight consumers feel when they order that specific, thoughtful gift online for the holidays or when they come across the perfect gift while shopping at a store. To be successful with consumers in these moments, retailers must have the right products in stock at the right time and deliver them quickly and cost-effectively. This is what resiliency for retailers looks like, but how do you build resiliency into your supply chain?

Overhead view of three employees in a warehouse.

Microsoft Supply Chain Center

Reduce supply and demand mismatches by running simulations using AI and real-time, advanced analytics.

McKinsey & Company found that 75 percent of consumer packaged goods (CPG) supply chain leaders prioritize supply chain digitalization, suggesting that resiliency through digitalization is one strategy that retailers are exploring.1 At Microsoft, we believe the path to retail resiliency lies in three interconnected capabilities: connectivity, agility, and sustainability, which we showcase solutions around at this year’s National Retail Federation (NRF) exposition in New York City.

Connectivity

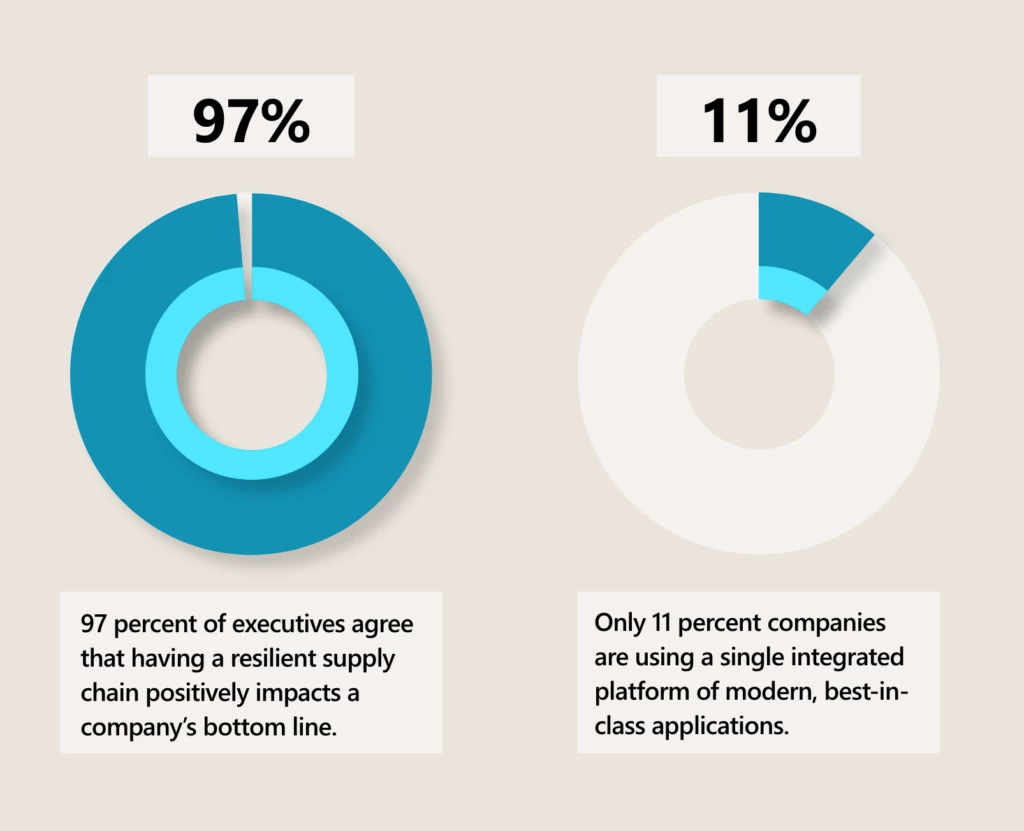
True end-to-end visibility requires a platform capable of connecting and harmonizing data from new and existing sources. According to research commissioned by Microsoft from Harvard Business Review Analytic Services, 97 percent of executives agree that having a resilient supply chain positively impacts a company’s bottom line.2 The same study found that most organizations’ digital infrastructure is composed of a mix of modern and legacy apps, with only 11 percent using a single integrated platform of modern, best-in-class applications.3 This makes any solutions’ connectivity a critical factor in building resilience and agility.

One merchant that is enjoying the benefits of connectivity and visibility is iFIT. iFIT is a leading health and fitness platform that markets several home exercise equipment brands. Recently, iFIT adopted the Microsoft Supply Chain Platform to bring together its systems and data. With this integrated, centralized view, iFIT can reduce the manual effort and guesswork involved in strategically placing inventory in its more than 40 forward-stocking locations. Utilizing built-in AI capabilities, iFIT increased efficiency from 30 to 75 percent on their forward stock inventory resulting in faster delivery timesreduced from a two-week window to two daysand increased customer delight.

This embed requires accepting cookies from the embed’s site to view the embed. Activate the link to accept cookies and view the embedded content.

This site uses cookies for analytics, personalized content and ads. By continuing to browse this site, you agree to this use.

iFIT uses Microsoft Supply Chain Center to optimize inventory and delight customers with rapid delivery times.

Extensible systems increase connectivity, too, such as the ability to leverage highly functional micro-services like the Inventory Visibility Add-in for Microsoft Dynamics 365 Supply Chain Management. Users can enable the Inventory Visibility service free of charge to gain a real-time, global view of on-hand inventory and tracking across all data sources and channels. Additionally, the Inventory Visibility service allows users to avoid overselling by making real-time soft reservations and using the allocation feature to ring-fence valuable on-hand stock for essential customers or channels.

Learn more with the Inventory Visibility Add-in overview.

Another dimension of connectivity is collaboration. Dynamics 365 and Supply Chain Center include Microsoft Teams built-in, unleashing the power of collaborative applications for users, making all your business processes and applications multiplayer. With collaborative applications, team members can connect in real time, surface and act on insights from unified data, and swarm around supply chain issues to mitigate disruptions before they impact customers.

Connected systems and data create the visibility supply chains need to sense risks and illuminate opportunitiesthe necessary precursors to agility, which we look at next.

Agility

To enable agility, supply chain software needs to increase visibility across data sources, predict and mitigate disruptions, streamline collaboration, and fulfill orderssustainably and securely. In short, companies need to understand the entire supply chain network. By connecting disparate systems and harmonizing data across the supply chain, companies gain a more comprehensive understanding of supply and demand. With Supply Chain Center, retailers can connect and harmonize data and generate supply and demand insights using AI to uncover patterns and projections based on historical and real-time inventory and order volumes.

One company using Supply Chain Center to build a more agile supply chain is Northern Tool + Equipment, a manufacturing and omnichannel retailer with 130 stores across the United States. Northern Tool + Equipment’s fragmented supply chain technology infrastructure had pushed lead times for the 100,000 items in its product catalog to four to seven days. In addition, many of the company’s products are very large, like generators and air compressors. The sheer size of these items brings further complexity to the challenge of optimizing shipping routes for cost and sustainability. Similarly, Northern Tool + Equipment struggled to provide firm delivery dates for online and in-store product orders. For a business that serves people who do tough jobs and rely on their tools for their livelihood, being competitive means offering delivery in one to three days and providing accurate delivery times.

This embed requires accepting cookies from the embed’s site to view the embed. Activate the link to accept cookies and view the embedded content.

This site uses cookies for analytics, personalized content and ads. By continuing to browse this site, you agree to this use.

Northern Tool + Equipment partnered with Microsoft to overcome these challenges with an end-to-end supply chain solution. The selection of Supply Chain Center meant that Northern Tool + Equipment could immediately begin to rationalize and connect every node of its supply chain with a solution designed to create a more resilient and sustainable supply chain through an open, flexible, collaborative, and secured platform. The result? Northern Tool + Equipment can provide customers with a committed delivery date and shipping costs while also ensuring one-day to two-day delivery within a specific proximity of its stores.

A significant factor in Northern Tool + Equipment’s lead time improvement is its use of Microsoft Dynamics 365 Intelligent Order Management capabilities, which allows organizations to connect and orchestrate order fulfillment across different platforms and apps. But Supply Chain Center has an assortment of capabilities to serve other retailers on the agility journey.

One such capability is the Supply Chain Center news module, which gathers information about world events and presents articles relevant to your business and supply chain. How can this feature be a functional building block of agility?

Let’s consider an example of a retailer selling portable air conditioners. Using the news module, the retailer could receive a news alert that a specific geography is forecasted to have the hottest summer on record. This would likely increase the expected seasonal demand for the product in the affected region. The retailer could capitalize on this intelligence by increasing their forecast during the planning process so that they can be prepared to quickly shift inventory to ensure coverage. 

In addition, Supply Chain Center connects with Microsoft Dynamics 365 Supply Chain Management, which gives retailers access to advanced warehouse management functionality, such as warehouse automation by integrating with partners like inVia Robotics. It also gives retailers the ability to set up pop-up warehouses in a matter of days in six easy steps. Continuing the example above, our portable air conditioner retailer might utilize the supply chain planning functionality and learn that they have insufficient warehouse capacity to meet the seasonal demand increases. In this case, they could use Dynamics 365 Supply Chain Management to open a new warehouse in a matter of days by utilizing wizards and templates and quickly deploying the mobile app. Similarly, the retailer could then improve warehouse productivity with InVia Robotics by leveraging robots to do the heavy lifting and traveling across the warehouse, freeing up workers to do the more complex task of sorting and packing. The value of these systems is getting the attention of organizations and analyst firms.

Sustainability, circular economies

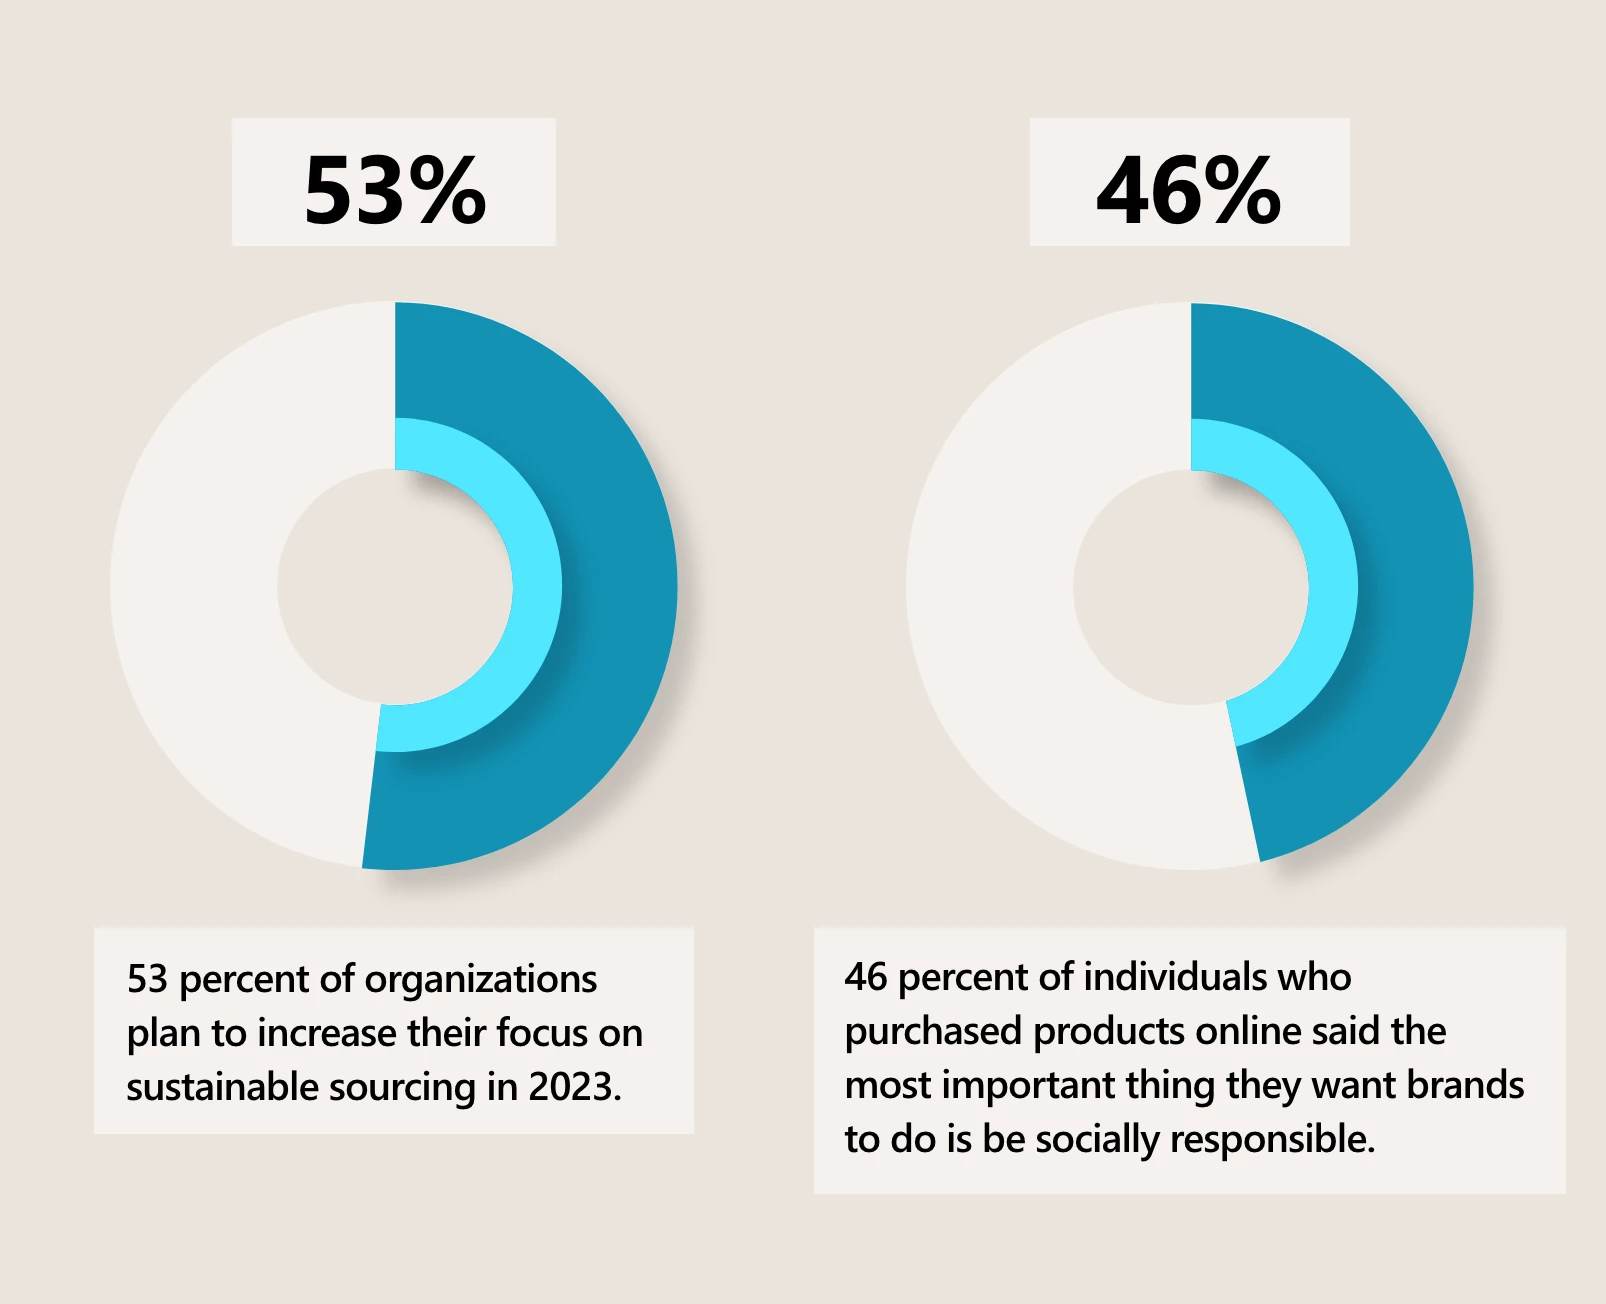
In a recent survey, 46 percent of individuals who purchased products online said the most important thing they want brands to do is be socially responsible.4 This fact helps explain why 53 percent of organizations plan to increase their focus on sustainable sourcing in 2023.5 While there are several dimensions of social responsibility, sustainability is the most relevant to retail supply chain leadership. For retail supply chains, this can be challenging.

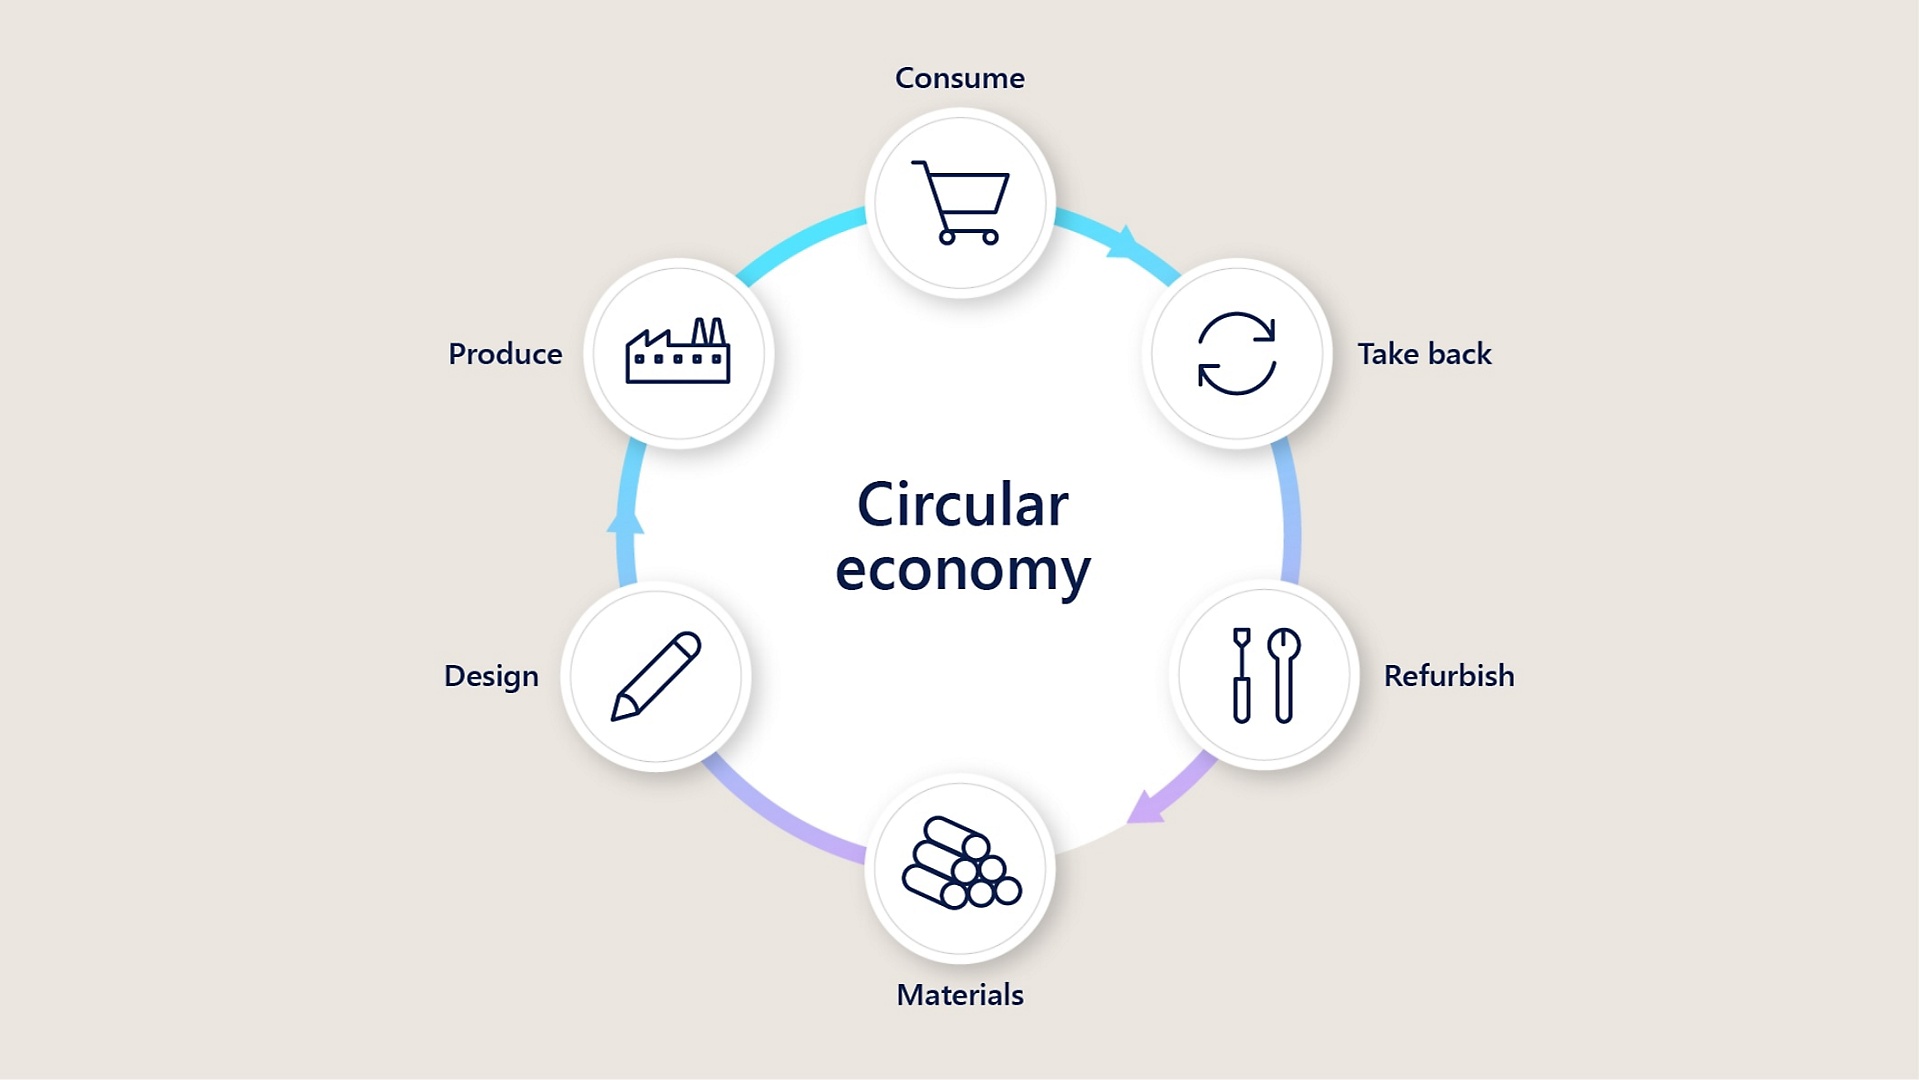
For retailers to lead not just the industry but to exceed consumers’ expectations for social responsibility, another challenge beckonsthe utilization of circular economies. Even leaders in the EU, who successfully decreased material use by 9 percent and increased products derived from recycled waste by 50 percent,6 understand that while their progress is impressive, growth of circular economies is still limited compared to their actual material footprint. Still, the incentive for retailers, beyond the value of doing the right thing, is significant. One survey by Statista expects worldwide revenue of circular economy transactions to more than double from 2022 to 2026, growing from $338 billion to $712 billion.7

diagram

One way that Microsoft is helping brands meet the challenge is with built-in sustainability features for suppliers. One example is the FedEx integration with Intelligent Order Managementwhich is included in Supply Chain Center. The FedEx integration allows users to offer boxless returns to their customers by leveraging environmentally friendly QR codes to return items at more than 60,000 retail FedEx locations. Plus, retailers can utilize the self-service return functionality of the FedEx integration to easily manage all returns with complete visibility of every step in an item’s return to the warehouse.

Learn how FedEx and Dynamics 365 reimagine commerce experiences.

What’s next?

As we have seen here, the path to retail resilience in today’s competitive environment revolves around connectivity, agility, and sustainability. Brands should address disruptions and challenges with solutions that can exceed customer expectations, drive profitability, and improve sustainability.

Ready to see how Supply Chain Center can help your business on the path to retail resiliency? Sign up for a free 180-day trial of Microsoft Supply Chain Center (preview).

For a look back at NRF 2022, check out our previous blog: Dynamics 365 helps build the retail supply chain of the future. And take a look at the following posts to learn more about NRF 2023:


Sources

1McKinsey & Company, 2022. How consumer-packaged-goods companies can drive resilient growth.

2Harvard Business Review Analytic Services, 2022. A Supply Chain Built for Competitive Advantage.

3Harvard Business Review Analytic Services, 2022. A Supply Chain Built for Competitive Advantage.

4GWI, 2022. GWI USA.

5KPMG, 2022. The supply chain trends shaking up 2023.

6The World Bank, 2022. World Bank Releases Its First Report on the Circular Economy in the EU, Says Decoupling Growth From Resource Use in Europe Achievable Within Decade.

7Statista, 2022. Estimated revenue generated from circular economy transactions in 2022 and 2026 worldwide.

The post The Microsoft Supply Chain Platform enables resiliency for retailers appeared first on Microsoft Dynamics 365 Blog.

Brought to you by Dr. Ware, Microsoft Office 365 Silver Partner, Charleston SC.

Authentication with Azure Load Testing series : Azure Active Directory

Authentication with Azure Load Testing series : Azure Active Directory

This article is contributed. See the original author and article here.

Authentication is a key step in the user journey of any application. Going about designing the authentication flow can be confusing and not straightforward. When load testing an application, this generally is the first step in the user journey.  Supplying client credentials through a UI is not possible when load testing an application, so is evaluating how to implement specific authentication flows available on Azure, as they can be tedious and time consuming as well.


Within this series, we will cover the authentication flows and scenarios that are possible with Azure Active Directory (Azure AD) as the identity provider.


At the end of the blog, you will be able to


  • Use Azure AD to Authenticate a web application hosted on Azure App Service using the client credential grant flow.

  • Parametrize the client credentials in JMeter to retrieve them at run-time in Azure Load Testing.


Prerequisites


  • A webapp with authentication enabled with Azure AD.

  • An Azure Load Testing resource.

  • Azure key vault for storing secrets.

  • Azure Load Testing resource configured to fetch the secrets during runtime. Visit here to learn how to do it.

  • JMeter


Authenticating to your web app with a shared secret


When you are using a shared secret to authenticate to an application on, you essentially pose yourself as a trusted principal with a valid token that can be used to authenticate you to the application which is registered with azure active directory. The token helps establish a trust, that you can access and make modifications to the resource (application).


  1. To get the access token from Azure AD, we need to pass 4 parameters to get the access token:

    1. client_id

    2. client_secret

    3. grant_type

    4. and the tenant_id 


      For more information you can see authentication using shared secret


  1. Retrieve client_id, tenant_id for the app registered with Azure AD by going to Azure Active Directory >>App Registrations >>Overview  on the azure portal.

  2. Retrieve the client_secret for the app by clicking on Certificate & secrets >> Client Secrets


The best practice is to store the above parameters into Azure Key Vault and then fetch them directly at runtime instead of hard coding them into the script.


Fetching the client secretFetching the client secret 


Configuring the JMeter test plan


The JMeter test plan needs to be configured to make a request to the app’s authentication endpoint to acquire the token. The endpoint can be found by visiting Azure Portal and navigating to Azure Active Directory > App registrations > > Endpoints


Getting the Authentication endpointGetting the Authentication endpoint


It would look something as below:


https://login.microsoftonline.com//oauth2/token


For the allowed values of you may refer to issuer values. In our case, it would be the tenant id.


Once we have the token, we can pass it to the subsequent requests in the authorization header to authenticate to the application.


Now that we know what needs to be done, let’s start implementing it.


Creating the test plan in the JMeter GUI


  1. Start by adding two thread groups, (Authentication) one for fetching the bearer token and the other (Application) to access the landing page of the application.

  2. Add an environment variable element to the Authentication thread group. This environment variable will be used to fetch the values of fields like client_id, client_secret and tenant_id which we stored earlier in the key vault at runtime to help acquire the access token.Defining used defined variableDefining used defined variable


  3. Add a child HTTP request sampler (Token Request) to the Authentication thread group. Within this HTTP request we will setup a post method that will help retrieve the access token.Defining the POST method to get access tokenDefining the POST method to get access token


  4. Add two child post processor elements to the Token Request sampler, one JSON Extractor (Extract Auth Token) for extracting the token. The response from the Token Request HTTP sampler comes back as a JSON response and we extract the token using the expression $.access_token .Extracting Authentication tokenExtracting Authentication token


  5. The next post processor element would be JSR223(Set AuthToken), which will be used to set the token extracted as a property named access_token. Setting it as a property will allow the variable to be accessible globally across samplers and hence can be accessed by the next thread group.Setting property as an access token propertySetting property as an access token property


  6. Next, let’s configure the application landing page (Homepage) to access the application homepage. Add a child element a header manager, to configure and maintain the header to be passed with the request. In this case we only pass the authorization header that would contain the bearer token obtained from the previous thread group (Authentication).Configuring the header managerConfiguring the header manager


Creating and Running the Load Test


Once we have setup our JMeter test plan, now we can move ahead and run the same using the azure load testing service by creating a test, supplying the above created JMeter script as the test plan and configuring the environment variables.


  1. Supply the JMeter test plan (JMX file) we created in the previous section.Configuring the Test PlanConfiguring the Test Plan


  2. Configure the Secrets section within the Parameters tab. We have stored all the sensitive information in the key vault. We would need to configure our tests to fetch those at runtime. Visit how to parameterize load tests to know more.

    Configuring the secretsConfiguring the secrets


Try this out and let us know if it works for you. Please use the comments section to help us with any feedback around this scenario and anything you would like to see next time.


If you have any feedback on Azure Load Testing, let us know using our feedback forum.


Happy Load Testing!!!


Microsoft Mesh: Creating connections at the World Economic Forum 2023

Microsoft Mesh: Creating connections at the World Economic Forum 2023

This article is contributed. See the original author and article here.

Discover how Microsoft Mesh enables collaboration, connection, and shared experiences at the World Economic Forum Annual Meeting 2023.

The post Microsoft Mesh: Creating connections at the World Economic Forum 2023 appeared first on Microsoft 365 Blog.

Brought to you by Dr. Ware, Microsoft Office 365 Silver Partner, Charleston SC.