by Scott Muniz | Jul 29, 2020 | Alerts, Microsoft, Technology, Uncategorized
This article is contributed. See the original author and article here.
please help us share the new animation showing Azure Data Explorer at a glance.
We had planned to have a real life movie with our customers, but COVID-19 decided otherwise. We made some adjustments, and here are the results! Please enjoy and please share.
In 2.5 minutes you’ll get a full explanation of What Azure Data Explorer is and when to use it.
YouTube
LinkedIn
Azure Data Explorer Docs
Free online Courses:
- How to Start with Microsoft Azure Data Explorer
- Exploring Data in Microsoft Azure Using Kusto Query Language and Azure Data Explorer
- Microsoft Azure Data Explorer – Advanced KQL
Enjoy.


by Scott Muniz | Jul 28, 2020 | Alerts, Microsoft, Technology, Uncategorized
This article is contributed. See the original author and article here.
This article is the 5th part of the Zero to Hero with App Service series. This article assumes you have completed the first article.
If you would like to customize your web app and have a domain name other than “azurewebsites.net”, you can add a custom domain to your web app. Moreover, you can secure your custom domain with a free certificate with App Service Managed Certificates, which will give your customers peace of mind when browsing your website.
Prerequisite
Before you can add a custom domain to your web app, you need to have purchased a custom domain already. If you don’t have a custom domain, you can buy one through App Service Domains, which you can get started with the App Service Domains section of the article . If you already have your own custom domain, proceed to the adding a custom domain to your web app section of the article.
App Service Domains
App Service Domains lets you create and manage domains hosted on Azure DNS through the Azure portal. The domain can be used for services such as Web Apps, Traffic Manager, and etc.. Purchasing an App Service Domain also provides the added benefit of privacy protection: your personal data will be protected from the WHOIS public database for free. This is often costs extra with other domain registrars. This product can auto-renew your domains and it integrates easily with your web apps.
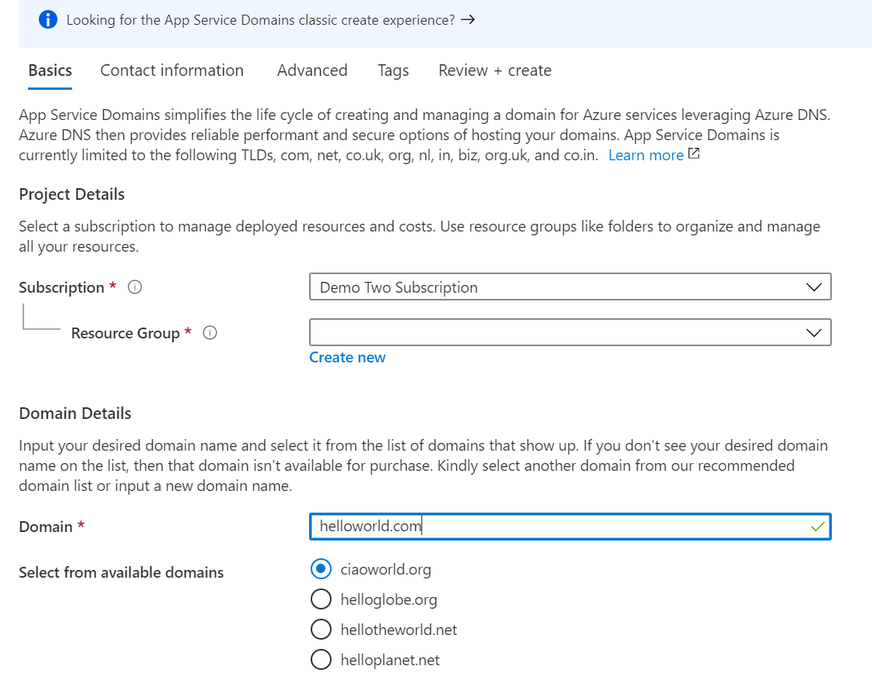
To create your App Service Domain, you can click on this link here or you can head to the Azure portal and search for “App Service Domain”.

In the domain search bar, type the domain name you would like to purchase. If you don’t see the name in the list of available domains, then the domain isn’t available for purchase. However, you can choose from the suggested list of available domains or enter a new domain you would like to purchase. In the “Contact information” tab, enter your personal information. Then in the “Advanced” tab, choose whether you want to set up auto-renew for the domain. Domain auto-renew prevents accidental loss of domain ownership after expiration. Lastly, decide whether you would like to add privacy protection at no extra charge. Go to “Review + create” to review the legal terms, verify the domain information, and click “Create”. Once your domain has successfully been created, proceed to the adding a custom domain to your web app section of the article.
Adding a custom domain to your web app
To add a custom domain to your web app, you will need to update your domain’s DNS records. If you purchased an App Service Domain, the DNS records will be updated for you automatically and you can proceed to verifying and adding a custom domain section. Otherwise, you will need to work on updating DNS records .
Updating DNS records
You will need to get the custom domain verification ID of your web app. This token will be used to verify the domain ownership. You can get this value in the “Custom domains” tab of your web app.

Once you have the ID, go to the domain provider of your domain. In the DNS records, create a CNAME and a TXT Record. As an example, if you want to map your ‘www’ subdomain, refer to the chart below:
| Record Type |
Host |
Value |
| CNAME |
www |
.azurewebsites.net |
| TXT |
asuid.www |
Custom Domain Verification ID |
Your DNS records page should look something like the following example:

Verifying and adding custom domain
After updating your DNS records (if not using App Service Domain):
- Go to your App Service and navigate to the “Custom domain” section under “Settings”.
- Click on the “Add custom domain” button
- Enter the domain that you would like to use
- Click “Validate”
- If you correctly updated your DNS records and the DNS changes have propagated, you will see the option to “add custom domain”. Otherwise, return to the previous updating DNS records section to make sure you have correctly updated your DNS records. Click “add custom domain”.

Once the custom domain has successfully been added to your web app, you will see it under the list of “Assigned Custom Domains”. You can navigate to your web app using these domain names.
If you are interested in securing your custom domain, proceed to the following section on Creating an App Service Managed Certificate .
Creating an App Service Managed Certificate
If you would like to secure your custom domain at no cost, you can create an App Service Managed Certificate and bind it to your domain. With Managed Certificates, you don’t have to worry about renewals, as the certificate is automatically renewed for you!
Go to your web app resource and navigate to the “TLS/SSL settings” section under “Settings”. Click on the “Private Key Certificates” blade and look for the “Create App Service Managed Certificate” button.

Select the domain from the dropdown menu that you would like to create a certificate for and click “Create”.

Once the certificate has been created, you will see that it in the list of your private certificates on the “TLS/SSL Settings” blade. In order to use this certificate to secure your domain, you will need to bind this certificate to your domain, which will be explained in the next section of binding your certificate to your web app .

Binding Your Certificate to Your Web App
The final step to securing your domain is to bind your certificate to the domain. In the Portal, go to your web app and navigate to the “Custom domain” section under “Settings”. Look for the domain you want to secure from the list of “Assigned Custom Domains” and click “Add binding”.

In the following blade…
- Select the correct custom domain
- Select the App Service Managed Certificate you’ve just created from the dropdown menu
- Select “SNI SLL” for the TLS/SSL Type
- Click “Add Binding”

Once the binding has successfully been created, you will see a green checkmark and the word “Secure” beside your custom domain under the “Assigned Custom Domains” list.
Summary
Congratulations! In this article, you have successfully added and secured a custom domain for your App Service! Your users can now reach your web site at the new domain, and their browser will let them know that the site is secured.
Helpful Resources
by Scott Muniz | Jul 28, 2020 | Alerts, Microsoft, Technology, Uncategorized
This article is contributed. See the original author and article here.
We are excited to share several new Azure Migration-related assets to help you navigate cloud migration, learn about best practices, and understand tooling options available from Microsoft.
- Cloud Migration Simplified E-Book Learn about the cloud migration journey, with our tried and true framework for a successful migration and migration best practices, along with guidance on how to navigate all of the tools and resources provided by Microsoft and partners.
- Azure Migrate E-Book Learn how to discover, assess, and migrate infrastructure, applications, and data to the cloud with Microsoft’s first-party migration service, Azure Migrate.
- Virtual Machine Migration Learning Path Get step-by-step instructions along with video demos on how to migrate virtual machines and apps to Azure using Azure Migrate, including guided set up, assessment, and migration.
by Scott Muniz | Jul 27, 2020 | Alerts, Microsoft, Technology, Uncategorized
This article is contributed. See the original author and article here.
Prerequisites
Before you start the Lab please ensure you have the below
- Azure subscription with authorization to create an HDInsight HBase cluster.
- Access to an SSH client like Putty(Windows) /Terminal(Macbook)
Provision HDInsight HBase cluster with Azure Management Portal
To provision HDInsight HBase with the new experience on Azure Management Portal, perform the below steps.
-
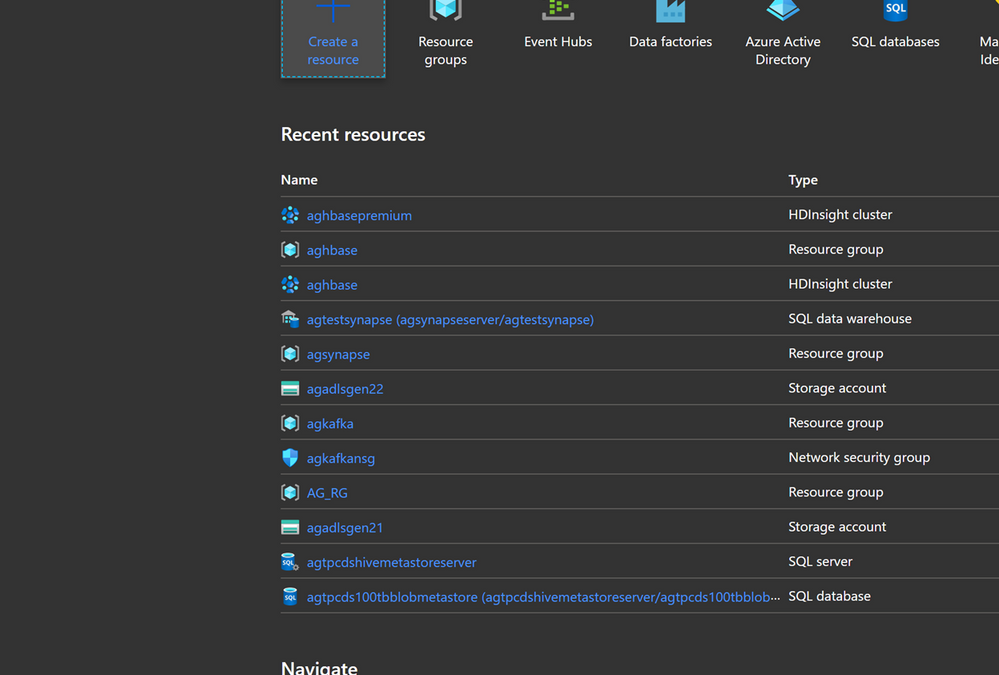
Go to the Azure Portal portal.azure.com. Login using your azure account credentials.

- We would start with creating a Premium Block Blob Storage Account. From the New Page , click on Storage Account.

In the Create Storage Account page populate the below fields.
-
Subscription: Should be autopopulated with the subscription details
-
Resource Group: Enter a resource group for holding your HDInsight HBase deployment
-
Storage account name: Enter a name for your storage account for use in the premium cluster.
-
Region: Enter the name of the region of deployment(ensure that cluster and storage account are in the same region)
-
Performance : Premium
-
Account kind : BlockBlobStorage
-
Replication : Locally-redundant storage(LRS)
-
Cluster login username:Enter username for cluster administrator(default:admin)

- Leave all other tabs at default and click on Review+create to create the storage account.
- After the storage account is created click on Access Keys on the left and copy key1 . We would use this later in the cluster creation process.

- Lets now start deploying an HDInsight HBase cluster with Accelerated writes. Select Create a resource -> Analytics -> HDInsight

On the Basics Tab populate the below fields towards the creation of an HBase cluster.
-
Subscription: Should be autopopulated with the subscription details
-
Resource Group: Enter a resource group for holding your HDInsight HBase deployment
-
Cluster Name: Enter the cluster name. A green tick will appear if the cluster name is available.
-
Region: Enter the name of the region of deployment
-
Cluster Type : Cluster Type – HBase Version- HBase 2.0.0(HDI 4.0)
-
Cluster login username:Enter username for cluster administrator(default:admin)
-
Cluster login password:Enter password for cluster login(default:sshuser)
-
Confirm Cluster login password: Confirm the password entered in the last step
-
Secure Shell(SSH) username: Enter the SSH login user (default:sshuser)
-
Use cluster login password for SSH: Check the box to use the same password for both SSH logins and Ambari Logins etc.

Click Next : Storage to launch the Storage Tab and populate the below fields
- Primary Storage Type: Azure Storage.
- Selection Method: Choose Radio button Use access key
- Storage account name: Enter the name of the Premium Block Blob storage account created earlier
- Access Key:Enter the key1 access key you copied earlier
- Container: HDInsight should propose a default container name. You could either choose this or create a name of your own.

- Leave the rest of the options untouched and scroll down to check the checkbox Enable HBase accelerated writes. (Note that we would later be creating a second cluster without accelerated writes using the same steps but with this box unchecked.)

-
Leave the Security+Networking blade to its default settings with no changes and go to the Configuration+pricing tab.
-
In the Configuration+pricing tab, note the Node configuration section now has a line Item titled Premium disks per worker node.
-
Choose the Region node to 10 and Node Size to DS14v2(you could chooser smaller number and size also but ensure that the both clusters have identical number of nodes and VM SKU to ensure parity in comparison)

-
Click Next: Review + Create
-
In the Review and Create tab , ensure that HBase Accelerated Writes is Enabled under the Storage section.`

Repeat the same steps again to create a second HDInsight HBase cluster , this time without Accelerated writes. Note the below changes
-
- Use a normal blob storage account that is recommended by default
- Keep the Enable Accelerated Writes checkbox unchecked on the Storage tab.

- In the Configuration+pricing tab for this cluster , note that the Node configuration section does NOT have a Premium disks per worker node line item.
- Choose the Region node to 10 and Node Size to D14v2.(Also note the lack of DS series VM types like earlier)

- Click Create to start deploying the second cluster without Accelerated Writes.
- Now that we are done with cluster deployments , in the next section we would set up and run YCSB tests on both these clusters.
Setup and run YCSB tests on the clusters
Login to HDInsight shell
-
Steps to set up and run YCSB tests on both clusters are identical.
-
On the cluster page on the Azure portal , navigate to the SSH + Cluster login and use the Hostname and SSH path to ssh into the cluster. The path should have below format.
ssh <sshuser>@<clustername>.azurehdinsight.net

Create the Table
-
Run the below steps to create the HBase tables which will be used to load the datasets
-
Launch the HBase Shell and set a parameter for the number of table splits. Set the table splits (10 * Number of Region Servers)
-
Create the HBase table which would be used to run the tests
-
Exit the HBase shell
hbase(main):018:0> n_splits = 100
hbase(main):019:0> create 'usertable', 'cf', {SPLITS => (1..n_splits).map {|i| "user#{1000+i*(9999-1000)/n_splits}"}}
hbase(main):020:0> exit
Download the YSCB Repo
- Download the YCSB repository from the below destination
$ curl -O --location https://github.com/brianfrankcooper/YCSB/releases/download/0.17.0/ycsb-0.17.0.tar.gz
- Unzip the folder to access the contents
$ tar xfvz ycsb-0.17.0.tar.gz
- This would create a ycsb-0.17.0 folder. Move into this folder
Run a write heavy workload in both clusters
- Use the below command to initiate a write heavy workload with the below parameters
- workloads/workloada : Indicates that the append workload workloada needs to be run
- table: Populate the name of your HBase table created earlier
- columnfamily: Populate the value of the HBase columfamily name from the table you created
- recordcount : Number of records to be inserted( we use 1 Million)
- threadcount: Number of threads( this can be varied, but needs to be kept constant across experiments)
- -cp /etc/hbase/conf: Pointer to HBase config settings
- -s | tee -a : Provide a file name to write your output.
bin/ycsb load hbase12 -P workloads/workloada -p table=usertable -p columnfamily=cf -p recordcount=1000000 -p threadcount=4 -cp /etc/hbase/conf -s | tee -a workloada.dat
- Run the write heavy workload to load 1 million rows into previously created HBase table.
Ignore the warnings that you may see after submitting the command.
HDInsight HBase with accelerated writes
$ bin/ycsb load hbase12 -P workloads/workloada -p table=usertable -p columnfamily=cf -p recordcount=1000000 -p threadcount=4 -cp /etc/hbase/conf -s | tee -a workloada.dat

2020-01-10 16:21:40:213 10 sec: 15451 operations; 1545.1 current ops/sec; est completion in 10 minutes [INSERT: Count=15452, Max=120319, Min=1249, Avg=2312.21, 90=2625, 99=7915, 99.9=19551, 99.99=113855]
2020-01-10 16:21:50:213 20 sec: 34012 operations; 1856.1 current ops/sec; est completion in 9 minutes [INSERT: Count=18560, Max=305663, Min=1230, Avg=2146.57, 90=2341, 99=5975, 99.9=11151, 99.99=296703]
....
2020-01-10 16:30:10:213 520 sec: 972048 operations; 1866.7 current ops/sec; est completion in 15 seconds [INSERT: Count=18667, Max=91199, Min=1209, Avg=2140.52, 90=2469, 99=7091, 99.9=22591, 99.99=66239]
2020-01-10 16:30:20:214 530 sec: 988005 operations; 1595.7 current ops/sec; est completion in 7 second [INSERT: Count=15957, Max=38847, Min=1257, Avg=2502.91, 90=3707, 99=8303, 99.9=21711, 99.99=38015]
...
...
2020-01-11 00:22:06:192 564 sec: 1000000 operations; 1792.97 current ops/sec; [CLEANUP: Count=8, Max=80447, Min=5, Avg=10105.12, 90=268, 99=80447, 99.9=80447, 99.99=80447] [INSERT: Count=8512, Max=16639, Min=1200, Avg=2042.62, 90=2323, 99=6743, 99.9=11487, 99.99=16495]
[OVERALL], RunTime(ms), 564748
[OVERALL], Throughput(ops/sec), 1770.7012685303887
[TOTAL_GCS_PS_Scavenge], Count, 871
[TOTAL_GC_TIME_PS_Scavenge], Time(ms), 3116
[TOTAL_GC_TIME_%_PS_Scavenge], Time(%), 0.5517505152740692
[TOTAL_GCS_PS_MarkSweep], Count, 0
[TOTAL_GC_TIME_PS_MarkSweep], Time(ms), 0
[TOTAL_GC_TIME_%_PS_MarkSweep], Time(%), 0.0
[TOTAL_GCs], Count, 871
[TOTAL_GC_TIME], Time(ms), 3116
[TOTAL_GC_TIME_%], Time(%), 0.5517505152740692
[CLEANUP], Operations, 8
[CLEANUP], AverageLatency(us), 10105.125
[CLEANUP], MinLatency(us), 5
[CLEANUP], MaxLatency(us), 80447
[CLEANUP], 95thPercentileLatency(us), 80447
[CLEANUP], 99thPercentileLatency(us), 80447
[INSERT], Operations, 1000000
[INSERT], AverageLatency(us), 2248.752362
[INSERT], MinLatency(us), 1120
[INSERT], MaxLatency(us), 498687
[INSERT], 95thPercentileLatency(us), 3623
[INSERT], 99thPercentileLatency(us), 7375
[INSERT], Return=OK, 1000000
Explore the outcome of the test – Accelerated writes and Regular
- The test took 538663(8.97 Minutes) milliseconds to run
- Return=OK, 1000000 indicates that all 1 Million inputs were were successfully written, **
- Write throughput was at 1856 operations per second
- 95% of the inserts had a latency of 3389 milliseconds
- Few inserts took more time , perhaps they were blocked by region severs due to the high workload
HDInsight HBase without accelerated writes
2020-01-10 23:58:20:475 2574 sec: 1000000 operations; 333.72 current ops/sec; [CLEANUP: Count=8, Max=79679, Min=4, Avg=9996.38, 90=239, 99=79679, 99.9  =79679, 99.99=79679] [INSERT: Count=1426, Max=39839, Min=6136, Avg=9289.47, 90=13071, 99=27535, 99.9=38655, 99.99=39839]
[OVERALL], RunTime(ms), 2574273
[OVERALL], Throughput(ops/sec), 388.45918828344935
[TOTAL_GCS_PS_Scavenge], Count, 908
[TOTAL_GC_TIME_PS_Scavenge], Time(ms), 3208
[TOTAL_GC_TIME_%_PS_Scavenge], Time(%), 0.12461770760133055
[TOTAL_GCS_PS_MarkSweep], Count, 0
[TOTAL_GC_TIME_PS_MarkSweep], Time(ms), 0
[TOTAL_GC_TIME_%_PS_MarkSweep], Time(%), 0.0
[TOTAL_GCs], Count, 908
[TOTAL_GC_TIME], Time(ms), 3208
[TOTAL_GC_TIME_%], Time(%), 0.12461770760133055
[CLEANUP], Operations, 8
[CLEANUP], AverageLatency(us), 9996.375
[CLEANUP], MinLatency(us), 4
[CLEANUP], MaxLatency(us), 79679
[CLEANUP], 95thPercentileLatency(us), 79679
[CLEANUP], 99thPercentileLatency(us), 79679
[INSERT], Operations, 1000000
[INSERT], AverageLatency(us), 10285.497832
[INSERT], MinLatency(us), 5568
[INSERT], MaxLatency(us), 1307647
[INSERT], 95thPercentileLatency(us), 18751
[INSERT], 99thPercentileLatency(us), 33759
[INSERT], Return=OK, 1000000
Comparison of the HBase Write numbers with explanation
| Parameter |
Unit |
With Accelerated writes |
Without Accelerated writes |
| [OVERALL], RunTime(ms) |
Milliseconds |
567478 |
2574273 |
| [OVERALL], Throughput(ops/sec) |
Operations/sec |
1770 |
388 |
| [INSERT], Operations |
# of Operations |
1000000 |
1000000 |
| [INSERT], 95thPercentileLatency(us) |
Microseconds |
3623 |
18751 |
| [INSERT], 99thPercentileLatency(us) |
Microseconds |
7375 |
33759 |
| [INSERT], Return=OK |
# of records |
1000000 |
1000000 |
- [OVERALL], RunTime(ms) : Total execution time in milliseconds
- [OVERALL], Throughput(ops/sec) : Number of operations/sec across all threads
- [INSERT], Operations: Total number of insert operations,with associated average, min, max, 95th and 99th percentile latencies below
- [INSERT], 95thPercentileLatency(us): 95% of INSERT operations have a data point below this value
- [INSERT], 99thPercentileLatency(us): 99% of INSERT operations have a data point below this value
- [INSERT], Return=OK: Record OK indicates that all INSERT operations were succesfull with the count alongside
Try out a few other workloads and compare
Read Mostly(95% Read & 5% Write) : workloadb
bin/ycsb run hbase12 -P workloads/workloadb -p table=usertable -p columnfamily=cf -p recordcount=1000000 -p operationcount=100000 -p threadcount=4 -cp /etc/hbase/conf -s | tee -a workloadb.dat
| Parameter |
Unit |
With Accelerated writes |
Without Accelerated writes |
| [OVERALL], RunTime(ms) |
Milliseconds |
292029 |
374379 |
| [OVERALL], Throughput(ops/sec) |
Operations/sec |
3424 |
2537 |
| [READ], Operations |
Operations/sec |
949833 |
949586 |
| [UPDATE], Operations |
Operations/sec |
50167 |
50414 |
| [READ], 95thPercentileLatency(us) |
Microseconds |
1401 |
3395 |
| [READ], 99thPercentileLatency(us) |
Microseconds |
1387 |
3611 |
| [READ], Return=OK |
# of records |
949833 |
949586 |
Read Only : workloadc
bin/ycsb run hbase12 -P workloads/workloadc -p table=usertable -p columnfamily=cf -p recordcount=1000000 -p operationcount=100000 -p threadcount=4 -cp /etc/hbase/conf -s | tee -a workloadc.dat
| Parameter |
Unit |
With Accelerated writes |
Without Accelerated writes |
| [OVERALL], RunTime(ms) |
Milliseconds |
272031 |
253256 |
| [OVERALL], Throughput(ops/sec) |
Operations/sec |
3676 |
3948 |
| [READ], Operations |
Operations/sec |
1000000 |
1000000 |
| [READ], 95thPercentileLatency(us) |
Microseconds |
1385 |
1410 |
| [READ], 99thPercentileLatency(us) |
Microseconds |
3215 |
3723 |
| [READ], Return=OK |
# of records |
1000000 |
1000000 |
by Scott Muniz | Jul 27, 2020 | Alerts, Microsoft, Technology, Uncategorized
This article is contributed. See the original author and article here.
Authored by: datamigrationteam@microsoft.com
SSMA Support for Db2 i (also called Db2/400 or AS400 Db2)
Starting with version 8.11, SSMA now supports Db2 i Series to automate the migration process. SSMA will continue to support Db2 for zOS & LUW. Db2 for i Series is an important member of IBM’s family of Db2 databases available on the IBM i operating system and Power Systems. Extending support for Db2 for i allows our customers to simplify and automate database migration process through SSMA.
With an automated end-to-end solution, this tool simplifies the data migration/modernization process and can be leveraged for:
- Database Assessment
- Database Schema & Objects Conversion
- Data Migration
With this enhancement, SSMA becomes a unique tool that covers all Db2 platforms (except DashDB).
SQL Server Migration Assistant (SSMA) for Db2 automates database migration to SQL Server, and the Azure SQL family of products, including Azure SQL Database, Azure SQL Managed Instance, and SQL Server on Azure VMs. SSMA is a popular Microsoft tool to assess and accelerate schema and data migrations for competing database platforms such as Db2, Oracle, MySQL, and SAP ASE. SSMA currently supports migrating DB2 databases running on LUW and zOS and starting with 8.11 introduces support for migrating DB2 for i Series databases as well.
Database Assessment
To begin any database migration process, it is fundamental to identify and classify the database functionalities and features being used. These could range fromusing certain data types like LOBs to very specific implementations such as shared data infrastructure using Data Sharing Groups. To determine the target environment characteristics, it is vital to understand the compatible and comparative capabilities of the target database to the ones being used on the current system. Therefore, assessment is the first step of the journey towards modernizing your data ecosystem.
SSMA can now assess the Db2 for i databases and generate an assessment report.
Database Schema & Objects conversion
SSMA now automatically converts the database schema and objects such as views, stored procedures, indexes, triggers and functions, to objects that are compatible with SQL Server and the Azure SQL family of products.
Data Migration
Data migration is an importance process for any application migration/modernization. This process can be very complex and time consuming depending on the Db2 for i data type and size. SSMA now supports data migration from Db2 for i to SQL Server and the Azure SQL family of products.
How to Use?
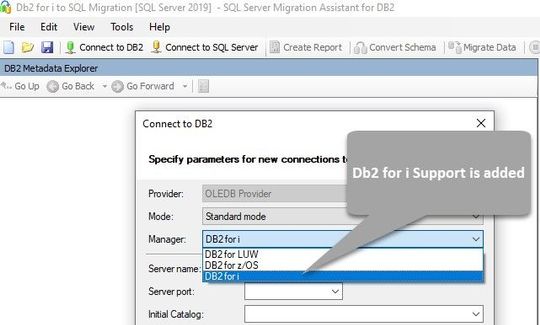
The prerequisites and system requirements for installing SSMA are described in the Prerequisites section. Select the DB2 for i option from the drop-down list in the Connect to DB2 dialog box as shown in the below screenshot.

You can establish a connection to Db2 i by using either the standard connection mode, or connection string mode. For standard mode, enter the server name, port, initial catalog, package collection, username and password. For connection string mode, provide the OLEDB connection string.
To learn more about SSMA for Db2, please refer to the SSMA documentation.
#AzureLegacyModernizationEngineers
#Mainframe&DataModernization2Azure
Download
SSMA for DB2
References:
SQL Server Migration Assistant documentation
by Scott Muniz | Jul 27, 2020 | Alerts, Microsoft, Technology, Uncategorized
This article is contributed. See the original author and article here.
We are announcing public preview of a new capability that enables creation of Azure AD guest users directly as database users and setting Azure AD guest users as Active Directory admin for SQL for Azure SQL Database, Managed Instance and Synapse Analytics, without the requirement of adding them to an Azure AD group first.
This is applicable to:
- Azure SQL Database
- Azure SQL Managed Instance
- Synapse Analytics (formerly SQL DW)
What are Guest Users and how are they supported in Azure SQL
Guest users in Azure AD are users that have been imported into the current Azure Active Directory from other Azure Active Directories, or outside of it. Guest users include users invited from other Azure ADs, Microsoft accounts such as outlook.com, hotmail.com, live.com, or other accounts like gmail.com.
Previously, guest users could connect to SQL Database (SQL DB), Managed Instance (MI) and Synapse Analytics (formerly SQL DW) only as part of members of a group created in current Azure AD that was then mapped manually using the Transact-SQL CREATE USER and CREATE LOGIN statements in a given Similarly, to make a guest user the Active Directory Admin for the server, the guest user had to be added to an Azure AD group and the group would then have to be set as the Active Directory Admin.
What functionality does the Public Preview offer
This public preview extends previous functionality by allowing Azure AD guest users to be directly added as database users, without the requirement of adding them to an Azure AD group first and then creating a database user for that Azure AD group. Additionally, this enables Azure AD guest user to be set directly as Active Directory admin for SQL DB, MI and DW without being part of an Azure AD group.
Example
Consider user1@outlook.com is a guest user and belongs to the Azure AD group ‘external_group’ in the current Azure AD tenant.
Previously, we had to create this group as a database user using the T-SQL command below, allowing the guest user to connect to the database as user1@outlook.com
create user [external_group] from external provider
With this preview, the guest user can now be directly created as a database user using the T-SQL command below:
create user [user1@outlook.com] from external provider
In the same way, the guest user can now be directly added as the Active Directory Admin for the database server using the PowerShell command below (or equivalent CLI command):
Set-AzSqlServerActiveDirectoryAdministrator -ResourceGroupName <ResourceGroupName> -ServerName <ServerName> -DisplayName ‘user1@outlook.com’
Note – This works for all types of guest users, namely:
- Guest users invited from other Azure AD tenants
- Microsoft accounts such as outlook.com, hotmail.com, live.com
- Other accounts like gmail.com
Notes
This new capability does not impact existing functionality, rather it allows greater flexibility in managing guest users in SQL DB/MI/DW. Guest users can continue to be part of an Azure AD group in order to be added as a database user and/or Active Directory admin for the server.
Please refer our documentation for more details and for the PowerShell/T-SQL commands to be used for adding a guest user as a database user and as Active Directory Admin.
For feedback/questions on this preview, please reach out to the SQL AAD team at SQLAADFeedback@Microsoft.com

Recent Comments