by Scott Muniz | Aug 11, 2020 | Azure, Microsoft, Technology, Uncategorized
This article is contributed. See the original author and article here.
by @Edwin Hernandez
In this article, I will describe the implementation of a logger for UI Test automation and the integration with test execution from an Azure DevOps Release pipeline. This article and the demo solution are standalone articles; however, I do build on concepts we reviewed on previous articles, specifically:
You may want to read through those articles before starting with this one. Having said that, let us get started describing what the logger does.
Purpose
UI Test automation and Regression are time-consuming expensive tasks because of their initial time investment and their maintenance effort. Even if a test suite is well maintained, once Automated Regression is executed, you still need a QA Automation Engineer to analyze the results and investigate any errors.
The purpose of this logger is to provide a detailed log of the flow of the UI script, including test case steps and screenshots. The QA Engineer or a Business Analyst can use the information from the logger to follow the business logic of the UI test and more easily validate if the intended work was completed or the reason for failure if an error occurred. A descriptive log can be more useful than even an actual video recording of the test.
Logger Features
- The logger creates a single HTML file that contains all messages and embedded images.
- This class is meant to be used in a Page Object Model project, when the LogMessage method is called it reflects itself to get the calling method and class and it uses this information to write a message into the HTML log.
- There are 4 log levels to help filtering how much information you want to log (error, warning, passed, info). This and other configurations are exposed as global variables. You can also specify the level up to which you want screenshots to be taken.
- Screenshots are saved as binary strings and embed into the HTML file so that you end up with a single file. This greatly helps the integration with Azure DevOps.
- This logger is adaptable since it is a standalone class. You can plug it into several types of UI Test projects. I have personally used it with WinAppDriver, CodedUI, Selenium WebDriver, and Xamarin.UITests projects with minimal changes, pretty much all that needs to be changed is the type of session object that is passed as an argument and the screenshot method.
Logger Requirements
- Given the frameworks I just mentioned, you can guess that this Logger class was written in C# and is meant to be used on Visual Studio for UI Test projects running over MSTest or NUnit projects. You could adapt it to other types of frameworks, but it would require more work.
- As I said this logger is meant to be used as part of a Page Object Model (POM), it is not that you couldn’t use it with a straight Top to Bottom test but you would take more advantage of it in a POM project.
Other than that, the log method needs to be specifically called every time something needs to be logged. I explored the option of using the constructor or interfaces, but it would require the class to be more coupled with the test solution and I wanted it to be more portable.
Configuration Variables
The logger configuration variables should be put for example on the Class Initialize method:

A log level of 4 would log all messages, a log level of 3 would log only messages level 1 to 3. You can change the labels of the labels in the HTMLLogFile class itself.
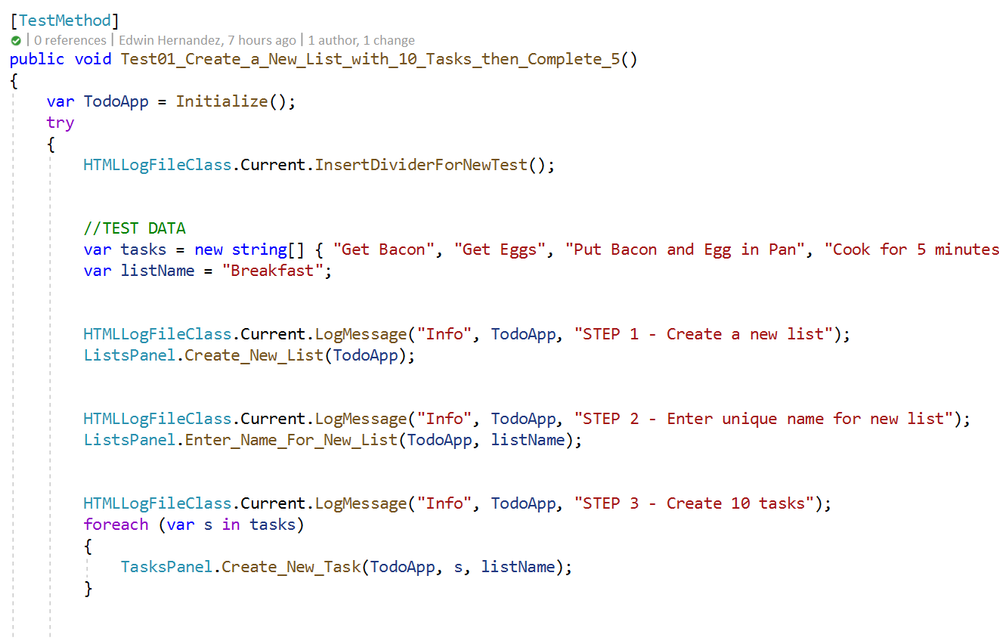
Logging Messages from the Test Method
As I mentioned earlier, the LogMessage method needs to be called every time something is to be logged into the file. I recommend that only “Info” level messages should be logged from the Test Method, mostly to log comments and business step details that would make the HTML report easier to read, for example:

The InsertDividerForNewTest creates a header for the report, then every “Info” step is logged with or without screenshots depending on the configured level.
Logging Messages from the Page Class Methods
This may be the most interesting part, every time you use LogMessage from the Page Class Methods, the HTMLLogFile class will use reflection to get the calling method/class information and it will include this information into the HTML report, take the following for example:

By including LogMessage “Passed” at the end, the HTML log will print the following:
Thus, by having well-constructed Page Object Classes, the log would build itself with very few additional comments.

Finding the Log for Local Test Executions
To have this HTML file to be uploaded to Azure DevOps it must be part of the Test Context. This part is included in this demo in the Class Cleanup Method:

If the UI test is executed from Visual Studio (make sure you have WinAppDriver installed, please check my other post about this on the top). The Test Detail Summary should show additional output already part of the Test Context, and inside of that you can see the HTML file:

.

If you open that, the HTML log should have a header, then every Log Message. Please note that screenshots are expandable on hover.

Integration with Azure DevOps Release Pipeline
Now for the next part, I will only show what the result would look like. Setting up a Release Pipeline in Azure DevOps for UI Test Regression is not in the scope of this article. I intend to cover that in a future article, there are several ways to accomplish that depending on what you need to do.
For now, the screenshot below is a simple Release Pipeline that takes the Test Assemblies as an artifact, executes the Tests on a Private (Self-Hosted) Build Agent set on interactive mode.
MSTest automatically uploads to the Release Pipeline test results information (# of test passed, pass %, duration, etc.) and if you expand a specific test and navigate to the Attachments panel, the HTML Log file should be there already associated with that test. Every test will get a unique HTML file:

The benefits of running Regression from a Release Pipeline are related to traceability against a Build/Environment and even user stories and test cases. For deployment approval and for historical purposes since tests are saved into the cloud instead of local files.
Download Demo Project and HTMLLogFIle class
You can find at the bottom of this post, a file containing a Visual Studio solution that has a demo POM library project, a test project, and the HTMLLogFIle class, as well as a demo HTML report file as a reference.
If you have any comments/concerns, please reach out or comment below.
by Scott Muniz | Aug 11, 2020 | Azure, Microsoft, Technology, Uncategorized
This article is contributed. See the original author and article here.
This installment is part of a broader series to keep you up to date with the latest enhancements to the Azure Sentinel Devops template.
This blog is a collaboration between @Cristhofer Munoz & @Matt_Lowe.
Introduction
Threats are evolving just as quickly as data-volume growth, with bad actors exploiting every possibility and technique to gain access to the corporate network. At the same time, the risk surface has widened as companies shift to hybrid-cloud environments, adopt DevOps and Internet of Things (IoT) technologies, and expand their remote workforces.
Amid this landscape, organizations require a bird’s-eye view of security posture across the enterprise, hence a security information and event management (SIEM) system is a critical element.
Frankly, deploying a SIEM is not a trivial task. Organizations struggle with the number of tasks to adopt a SIEM due to the lack of an agile methodology to plan, execute, and validate its initial success and deploy into production.
To help alleviate this challenge, we’ve developed an Azure Sentinel DevOps Board Template which serves as a blueprint to understand the tasks and activities to deploy Azure Sentinel following recommended practices. By leveraging the Azure Sentinel DevOps Boards one can quickly start tracking user stories, backlog items, task, features, and bugs associated with your Azure Sentinel deployment. The Azure Sentinel DevOps Board is not a static template, it can be modified to reflect your distinctive needs. You will have the ability to quickly add and update the status of work using the Kanban board. You can also assign work to team members and tag with labels to support queries and filtering.
For additional information on Azure Boards, please refer the public documentation.
In this template we provide prescriptive guidance for the following Azure Sentinel use cases:
- Define Use Cases
- Get Started with Azure Sentinel | Tutorials
- Onboard Azure Sentinel | Prerequisites
- Azure Sentinel Architecture
- Setup Azure Sentinel
- Data Collection
- Visualize your security data with Workbooks
- Enabling Analytics
- Respond to threats
- Proactive threat hunting
- Advanced Topics

Getting Access | Azure DevOps Generator
The purpose of this initiative is to simplify the process and provide tactical guidance to deploy Azure Sentinel by providing an Azure Sentinel DevOps board template that provides the prescriptive guidance you need to get going with your deployment. To populate the Azure Sentinel board, we utilized the Azure DevOps Demo generator service to create pre-populated content.
To get started:
1. Browse to the Azure DevOps Demo Generator site by selecting the link, or copy https://azuredevopsdemogenerator.azurewebsites.net/ into your browser’s URL field.
2. Click Sign In and provide the Microsoft or Azure AD account credentials associated with an organization in Azure DevOps Services. If you don’t have an organization, click on Get Started for Free to create one and then log in with your credentials.
3. After signing in, you will arrive at the “Create New Project” page.

4. Provide a name for your project (such as “AzSentinelDeployment”) that you and other contributors can use to identify the project.
5. Next, Select the organization you will use to host the project created by the Azure DevOps Demo Generator. (You may have multiple accounts of which you are a member, and which are associated with your login, so choose carefully.)
6. Lastly, select the demo project template you want to provision by clicking … (Choose Template) button.

7. A new pane will populate providing you the ability to select a pre-populated template. Click on the Azure Community tab, there you will find the Azure Sentinel Devops template.

8. Select the Azure Sentinel Devops template and create the project. Your project may take a couple of minutes for the Demo Generator to provision. When it completes, you will be provided with a link to the demo project.

9. Select the link to go to the new demo Azure DevOps Services project and confirm it was successfully provisioned. You should arrive at the following page:

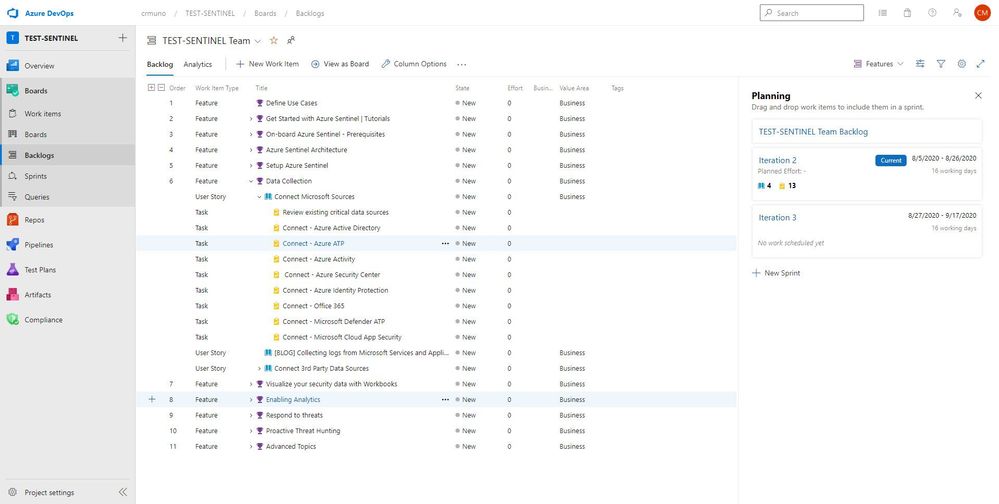
10. To access the Azure Sentinel backlog where you will find the features, user stories, and tasks to deploy Azure Sentinel, hover over Boards, and select Backlogs. Make sure that you are viewing the Features hierarchy. The backlog page will be the main page you will visit to consume the recommended practices and detailed steps to deploy Azure Sentinel.
.

Adding Team Members
1. Open your project, and then select Project settings > Teams. Then, select your project.

2. Select Add to invite members to your project.

3. Add users or groups, and then choose Save.

Enter the email addresses of the new users, separated by semicolons, or enter the display names of existing users. Add them one at a time or all at once.
How to Use
The template is comprised of features, user stories, and tasks providing guidance and recommended practices for your Azure Sentinel deployment. The template should help your team to discuss, agree on acceptance criteria, delegate ownership, create iterations, track the progress and efficiently deploy Azure Sentinel.
Note: Please remember that the template is not static, it can be modified to your reflect distinctive needs. You have the ability to add your own features, user stories, and tasks to reflect your custom use cases.
In this template we provide prescriptive guidance for the following Azure Sentinel use cases:
- Define Use Cases
- Get Started with Azure Sentinel | Tutorials
- Onboard Azure Sentinel | Prerequisites
- Azure Sentinel Architecture
- Setup Azure Sentinel
- Data Collection
- Visualize your security data with Workbooks
- Enabling Analytics
- Respond to threats
- Proactive threat hunting
- Advanced Topics
The use cases above are listed as Features, comprised of user stories and tasks providing detailed steps to satisfy the use case. The user stories and tasks are nested within each feature. Each task under the user stories includes important information such as links to public documentation, blogs, and webinars that provide you the necessary information complete the task.

In total, there are 11 features that have been listed above. Features 1 through 4 cover any initial steps and pre-requisites for preparing your Azure Sentinel deployment. Features 5 through 11 cover the actual steps for setting up and exploring features with Azure Sentinel.
Feature 1: Define Use Cases
Defining use cases is the most important step for this entire process. There must be a need and use when pursuing the deployment of a product. To provide some ideas or guidance, Gartner has created an article that covers how to determine and build great use cases when deploying a SIEM.
Feature 2: Get Started with Azure Sentinel | Tutorials
To help introduce and prepare you for the deployment of Azure Sentinel, this feature includes the well put together Azure Sentinel Ninja Training with additional Kusto training to assist. This training is to help introduce the concepts and features of the product with materials to help educate and prepare your users for day to day usage of Azure Sentinel.
Feature 3: Onboard Azure Sentinel | Prerequisites
It is important to identify and understand what the prerequisites are for deploying and using Azure Sentinel. To assist with this, this feature in the template provides a list of prerequisites as well as any associated documents that provide additional information that will help with addressed them.
Feature 4: Azure Sentinel Architecture
The design of a SIEM is as important as the SIEM itself. When deploying, it is essential to anticipate design, architecture, and best practices. To provide some guidance and advice, a blog that covers the best practices for implementing Azure Sentinel and Azure Security Center is included.
Along with the best practices for implementing Azure Sentinel, it is essential to understand the costs associated with using the product. Azure Sentinel as a service is mostly free but it is important to understand where the costs are coming from and how you can project costs when reviewing data ingestion options and volume. The Azure Calculator is an invaluable tool that assists with this process and can provide insight into how much it will cost to ingest data that is not free.
Feature 5: Setup Azure Sentinel
The use cases have been determined. The learning material has been reviewed. The prerequisites are understood. The architecture is set and the costs are projected. It is time to begin to take action and deploy the resources to set up Azure Sentinel. As covered in the Ninja training, Azure Sentinel is built on top of the Azure Log Analytics service. This service will serve as the main point for ingestion and log retention. The Azure Log Analytics is where one will collect, process, and store data at cloud scale. For reference, documentation for creating a new workspace is listed in this feature. Once the workspace is ready to go, it is time to onboard it to Azure Sentinel. The documentation for onboarding the workspace is also included in the feature.
Once the service is set up, it is time to determine the permissions that are needed for the users that will be using it. Azure Sentinel has 3 different roles backed by Azure role-based access control (Azure RBAC) to provide built-in roles that can be assigned to users, groups, and services in Azure. The document with the roles is listed in the feature. Additionally, permissions can be assigned on the table level for data in order to prevent users from seeing certain data types if desired.
Feature 6: Data Collection
Data ingestion is the oxygen of Azure Sentinel. Azure Sentinel improves the ability to collect and use data from a variety of sources to unblock customer deployments and unlock full
SIEM value.
Setting up data collection begins not only the data ingestion, but also the machine learning capabilities of Azure Sentinel. When exploring the dozens of connectors that are available out of the box, we recommend to enable the Microsoft security data connectors first. Once first part connectors are chosen, it is time to explore the 3rd party connectors. Each connector listed in this feature includes a description and a reference to the associated document.


Feature 7: Visualize your security data with Workbooks
Once data begins to be ingested, it is time to visualize the data to monitor trends, identify anomalies, and present useful information within Azure Workbooks. Out of the box, there are dozens of built-in Workbooks to choose from as well as several from the Azure Sentinel GitHub community page. Within the feature for Workbooks are a few sample Workbooks to consider. Not every data source or connector will have a Workbook but there are quite a few that can be useful.
Feature 8: Enabling Analytics
One of the main features of Sentinel is its ability to detect malicious or suspicious behaviors based on the MITRE attack framework. Out of the box, there are over 100 different detections built in that were made by Microsoft Security Professionals. These are simple to deploy and the feature in the template provides documentation for deploying the template detection rules, as well as the document for creating your own custom detection rules.
Feature 9: Respond to threats
To compliment its SIEM capabilities, Azure Sentinel also has SOAR capabilities. This feature contains helpful documents for setting up Playbooks for automated response, deploying Playbooks from the GitHub repository, and how to integrate ticket managing services via Playbooks.
Feature 10: Proactive threat hunting
To go along with the reactive features, Azure Sentinel also provides proactive capabilities that provide you the ability to proactively search, review, and respond to undetected or potentially malicious activities that may indicate a sign of intrusion/compromise. Azure Sentinel offers dozens out of the box hunting queries that identify potentially exploitable or exploited areas and activities within your environment. This feature within the template provides links and information to ignite your proactive threat hunting journey with out the box threat hunting queries, bookmarks, Azure Notebooks, and livestream.
Feature 11: Advanced Topics
If desired, Azure Sentinel can be deployed and managed as code. To help provide context and guidance, this feature within the template includes a blog post that covers how one can deploy and managed Azure Sentinel as code.
Assign work items to a team member
You can only assign a work item to one person at a time. The Assigned To field is a person-name field designed to hold an user identity recognizable by the system. Within the work item form, choose the Assigned To field to select a project member. Or, you can begin typing the name of a project member to quickly focus your search to a select few.

Tracking Progress with Boards
Azure DevOps utilizes a progress tracking approach that is similar to Agile project management. Boards lists each task, the state of progress, and the individuals that are assigned to the tasks. As the tasks are worked on, they will move within the Board until they are closed. The tasks can also be clicked and dragged around the Board as desired. This will provide you the blueprint understanding the completed and outstanding tasks for your Azure Sentinel deployment.

What’s Next
The current version of the Azure Devops Board template provides you the blueprint to understand the tasks and recommended practices to onboard to Azure Sentinel. The next iteration will incorporate a CI/CD pipeline that will enhance and automate the tasks/phases covered in the Azure Devops Board template. The CI/CD pipeline will automate your Azure Sentinel deployment so you spend less time with the nuts and bolts and more time securing your environment.
Get started today!
Supercharge your cloud SIEM today!
We encourage you to leverage the Azure Sentinel Devops Board template to accelerate your Azure Sentinel deployment following recommended practices.
Try it out, and let us know what you think!
by Scott Muniz | Aug 11, 2020 | Azure, Microsoft, Technology, Uncategorized
This article is contributed. See the original author and article here.
We are bringing this blog post to continue the learning about the protection that Azure Security Center offers for the SQL IaaS VMs. As you learnt in this blog post, Azure Security Center protects SQL servers hosted on either Azure VMs, Azure Arc and on-premises.
SQL Server on Azure Arc
While hybrid approaches bring greater power and flexibility, they also present greater complexity. Azure Arc was announced at Ignite 2019 to better address these challenges. Using Azure Arc, organizations can deliver a broader range of services while simplifying matters of management and security. Azure Arc provides deeper integration across all your Azure environment. Essentially Azure Arc allows organizations to use Azure’s management technologies (“control plane”) to centrally administer public cloud resources along with on-premises servers, virtual machines, and containers. All of Azure’s AI, automation, compliance and security best practices are now available to manage all of their distributed cloud resources, and their underlying infrastructure, which is known as “connected machines.” Additionally, several of Azure’s AI and data services can now be deployed on-premises and centrally managed through Azure Arc, enhancing local and offline management and offering greater data sovereignty.
Utilize Azure Security Center to produce a comprehensive report of vulnerabilities in SQL Servers and get advanced, real-time security alerts for threats to SQL Servers and the OS. Azure Security Center centralizes all security policies and protects the entire managed environment. When Security Center is enabled, the Azure monitoring agents will report data back from the servers, networks, virtual machines, databases, and applications. The Azure Security Center analytics engines will ingest the data and use AI to provide guidance. It will recommend a broad set of improvements to enhance security, such as closing unnecessary ports or encrypting disks and more. Azure Arc extends these security features to connected machines and services to protect all registered resources.
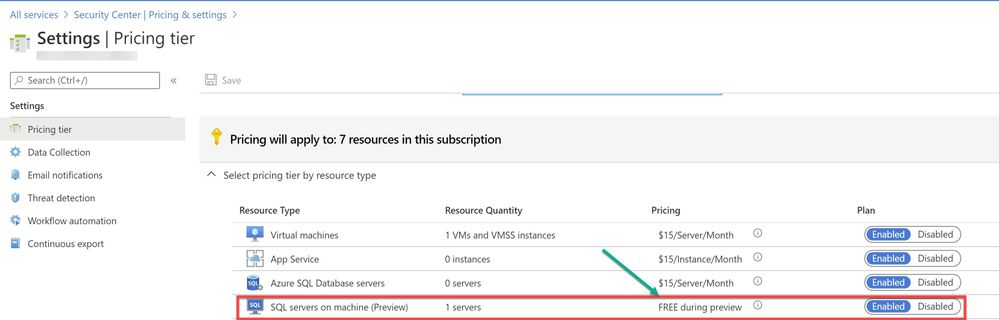
To use this threat detection capability, you need to enable the SQL servers on machine threat bundle in Azure Security Center pricing tier as shown in ‘Image 1’:

Image 1: Azure Security Center Pricing Tier
If your SQL server is hosted on Azure Arc machine and if you have auto-provisioning option enabled, Log Analytics agent will be automatically installed in your machine. If Otherwise, you can deploy the Log Analytics agent using the Security Center recommendation “Log Analytics agent should be installed on your Windows-based Azure Arc machines (Preview)”. Alternatively, you can install the agent manually in two easy steps by adding the Log Analytics VM extension. Refer to this article for step-by-step procedure to enable extension from portal/JSON/PowerShell.
A PowerShell script was used in this case to simulate a SQL injection attack scenario on the SQL server running on Azure Arc.
Injection flaws allow attackers to relay malicious code through an application to another system. These attacks include calls to the operating system via system calls, the use of external programs via shell commands, as well as calls to backend databases via SQL (i.e., SQL injection). Attackers can go around authentication and authorization of a web page or web application and retrieve the content of the entire SQL database. SQL injection is a particularly widespread and dangerous form of injection. The consequences are particularly damaging, as an attacker can obtain, corrupt, or destroy database contents. Security Center detects unusual and potentially harmful attempts to access SQL servers based on behavior analysis using machine learning.
In this scenario, Azure Security Center detected the threat and provided an alert with details of the machine, attacker activity, host information and more as shown in ‘Image 2 & Image 3’

Image 2: Security Alert, Alert details

Image 3: Security Alert, Take Action
NOTE: As of June 2020 release, Two new recommendations have been added to help deploy the Log Analytics Agent to your Azure Arc machines and ensure they’re protected by Azure Security Center:
- Log Analytics agent should be installed on your Windows-based Azure Arc machines (Preview)
- Log Analytics agent should be installed on your Linux-based Azure Arc machines (Preview)
These new recommendations will appear in the same four security controls as the existing (related) recommendation, Monitoring agent should be installed on your machines: remediate security configurations, apply adaptive application control, apply system updates, and enable endpoint protection. The recommendations also include the Quick fix capability to help speed up the deployment process.
In the next blog posts, we will discuss on how you can leverage Azure Security Center to protect your SQL IaaS VMs hosted On-premises. Stay Tuned!!
Special thanks to:
Yuri Diogenes, Senior PM, CxE Security – ASC Team for reviewing this post.
by Scott Muniz | Aug 11, 2020 | Azure, Microsoft, Technology, Uncategorized
This article is contributed. See the original author and article here.
With the recent release by HashiCorp and Microsoft of the Azure DevOps Provider 0.0.1 for Terraform we look at how to use these new features to create repeatable standardized projects into Azure DevOps.
Introduction.
In this article we are going to look at the new Terraform Provider for Azure DevOps. Firstly, lets provide some useful links:
At the time of authoring this article the provider is at version 0.0.1. Functionality is still a little limited and some of the documentation needs more detail, but all the basics are there.
So What Can I Do With This?
One question that has been asked many times is “Can I automate and template Azure DevOps Projects?”. Well, the answer is now yes.
The Terraform Azure DevOps Provider allows us to be able to create a standard Terraform deployment that creates a Project inside a DevOps Organization. We can use the resources to then describe what features we want enabled, disabled, or configured.
I have created a sample GitHub repo that holds the code examples we are going to look at below.
Ok, So Let’s Get Started.
Like many others, I tend to break my Terraform files up into smaller sub files to make things a little easier to navigate. In the GitHub Repo I have five .tf files:
- main.tf
- variables.tf (used to set my var. options cleanly)
- outputs.tf
- ado_repository.tf (we will cover this in more detail in the article)
- github_service_connection.tf (we will use this to setup a connection to the GitHub Repo)
I’m not going to cover what all of the files do in this article (there are some great blog posts out there already for that), but if you are interested in getting a detailed understanding of Terraform I recommend you check out our very own Adin Ermie.
Let’s start by taking a look at the main.tf file. The first area to note is that we need to define the org_service_url for Azure DevOps and personal_access_token we are going to use within the Provider Block.
The Organization Service URL is just the address to your DevOps org, for example https://dev.azure.com/myorg
Have a look at the following Microsoft document for detailed steps on how to setup a Personal Access Token in Azure DevOps.
main.tf
provider "azuredevops" {
  version = ">= 0.0.1"
  # Remember to specify the org service url and personal access token details below
  org_service_url = "xxxxxxxxxxxxxxxxxxxx"
  personal_access_token = "xxxxxxxxxxxxxxxxxxxx"
}

resource "azuredevops_project" "terraform_ado_project" {
  project_name       = var.project_name
  description        = var.description
  visibility         = var.visibility
  version_control    = var.version_control
  work_item_template = var.work_item_template
  # Enable or desiable the DevOps fetures below (enabled / disabled)
  features = {
      "boards" = "enabled"
      "repositories" = "enabled"
      "pipelines" = "enabled"
      "testplans" = "enabled"
      "artifacts" = "enabled"
  }
}
The rest of the arguments here are self-explanatory. we provide the basic options to setup the project and select to enable or disable the feature we require.
Next, we will look at the github_service_connection.tf. What we are doing here is defining a service connection into GitHub using GitHub Personal Access Tokens. Configuring GitHub PATs is documented here.
github_service_connection.tf
resource "azuredevops_serviceendpoint_github" "serviceendpoint_github" {
  project_id            = azuredevops_project.terraform_ado_project.id
  service_endpoint_name = "Sample GithHub Personal Access Token"

  auth_personal {
    # Also can be set with AZDO_GITHUB_SERVICE_CONNECTION_PAT environment variable
    personal_access_token = "xxxxxxxxxxxxxxxxxxxx"
  }
}
Finally, I am using an outputs.tf to return the newly created Project ID and Project URL.
outputs.tf
output "Project_ID" {
  value = azuredevops_project.terraform_ado_project.id
}

output "Project_URL" {
  value = azuredevops_project.terraform_ado_project.id
}
A Note About Repos.
Something that has been noted by a few people is that the Import option on the azuredevops_git_repository resource does not seem to work. Although documented as Import being a supported option (for public repos only at this time), it returns an error message.
Demo
Here is a quick demo of the code in action.
Wrap Up!
So thats it! A straightforward way to create Azure DevOps Projects within your Organization, simple and repeatable.
by Scott Muniz | Aug 10, 2020 | Azure, Microsoft, Technology, Uncategorized
This article is contributed. See the original author and article here.
Azure Active Directory B2C (Azure AD B2C) is a great way to enable secure authentication for your users across mobile and web — from basic sign-in and sign-out, to profile management and more.
While Azure AD B2C is designed to work well on any iOS or Android phone or tablet, integrating with any auth provider can be particularly tricky on a mobile device, particularly if you’re building a “hybrid” mobile app using something like Cordova or Capacitor. Issues like secure token storage, Man-In-The-Middle attacks, and timely security updates can be troublesome, and create risks if not handled properly.
That’s why the Ionic team designed Auth Connect. Ionic Auth Connect makes it easy to add secure authentication to any hybrid mobile app running on iOS, Android, or the web. Using a simple, powerful API, it handles logging in and/or registering a user with an authentication provider (such as Azure Active Directory) using industry-standard OAuth/OpenId Connect.
Getting Started
In this tutorial, we’ll add login/logout functionality to a basic Ionic app by integrating Ionic Auth Connect. There’s only a few steps required to implement Auth Connect with Azure AD B2C in an Ionic app: configure Azure AD B2C, install Auth Connect in an Ionic app, and configure Auth Connect to use Azure AD B2C.
To begin, clone this repository and follow along. The “start” folder contains the basic structure of the app that we’ll make changes to and the “completed” folder contains the finished app as a reference point if needed.
NOTE: An Ionic Native Enterprise Edition key is required in order to install and use the Ionic Auth Connect plugin. Ionic Native Enterprise features a library of Premier plugins and solutions that are fully supported and maintained by the Ionic team, with access to Ionic experts and a guaranteed response SLA to mission-critical app development. If you are interested in acquiring a key or learning more, please contact us here.
To see what Ionic Auth Connect looks like in action, view this short video.
After cloning the code, do the following:
1. Install the Ionic CLI:
npm install -g @ionic/cli
2. In a terminal, change directory into the “start” folder in the repository:
cd demo-authconnect-azureb2c/start
3. Run npm install. NOTE: This will fail if an Ionic Native key hasn’t been registered.
4. Run ionic serve to build and serve the app locally in a web browser.
The Reference App
The Ionic app is a modified version of a blank Angular starter project. It consists of two pages: the Home page displays the signed-in user’s details (which will be retrieved from Azure AD B2C) and the Login page protects the Home page from unauthorized access.
Azure Active Directory B2C Configuration
Before integrating Auth Connect into the Ionic app, you’ll need to get Azure Active Directory (AD) B2C up and running.
Note: For complete information on configuring Azure AD, consult the official B2C documentation which includes tutorials on creating a B2C tenant, registering applications, and more.
Create an Azure AD B2C Tenant
If you don’t have one, create a new B2C tenant.
Register an Application
Sign into the Azure Portal then navigate to the Azure AD B2C service page.
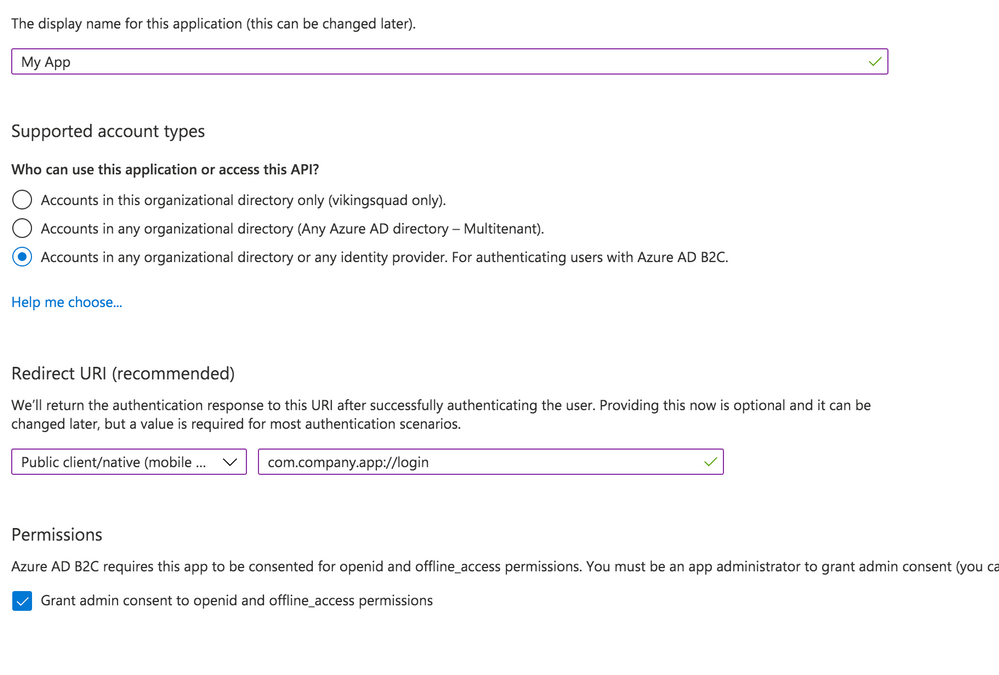
Begin by creating a new Application under Manage – App registrations – New registration.

Give your app a new name, then select the Supported Account Types.
With that in hand, set the Redirect URI. Choose “Public client/native (mobile & desktop)” – we’ll add web support in a separate step. Then, fill in the text field value with your globally unique App Id, which is used both in the Azure configuration as well as the native mobile app’s configuration. Typically, this takes the form of company-AppName or reverse DNS style – com.company.app. Use the formula “uniqueId://page”. After the app user signs into Azure AD, this tells Auth Connect which page to redirect to in your app. While any page can be used, in this example we’ll use the Login page, such as com.company.app://login. Click the register button to create the app.
Add Web Platform
With the app created, navigate to Manage – Authentication. Click the “Add a Platform” button. Under Web applications, choose “single-page application.”
Under Redirect URIs, specify a web URL. In this example, for local testing, we’ll use http://localhost:8100/ along with the name of your app’s core login page (typically, login).
Next, under Logout URL, specify a web URL to redirect to once the user has logged out of your app. Again, for local testing, specify https://localhost:8100/ along with the name of the logout page (typically logout).
Finally, under Implicit Grant, toggle “Access tokens.” Click the Configure button to save.

Back on the Authentication page, look under the Single-page application settings. Click the “Add URI” button to add additional Redirect URIs, including those for other environments like staging or production. Click Save when ready.

Expose an API
Navigate to the “Expose an API” page. Click “Add a scope”, then for the Scope name, provide a value such as “user_impersonation.” For the display name and description fields, add details describing that this is for authenticating your users. Set the state to enabled then click the “Add scope” button.
Configure API Permissions
Next, we need to authorize our app so it can connect to Azure B2C and retrieve user profile information alongside login credentials. Navigate to the API Permissions page then click the “Add a permission” button. Under “Select an API”, choose “My APIs” then click the name of the B2C app we’re currently configuring. Next, select the “user_impersonation” permission (or whatever name you labeled it in the previous step) then click the “Add permissions” button.
Save the application, then click on the newly added permission row. Click the “Grant admin consent for [your organization name]” button then choose “Yes.”

Click on the “user_impersonation” permission row again to open the modal window, then click to copy the link that is displayed. Note this URL, because it will be used as part of Auth Connect’s “scopes” property later.

Create User Flows (Policies)
Create at least one User Flow, the series of pages that define the entire authentication experience for your app. At a minimum, create a Sign up and sign in flow. Once the User Flow has been created, select it from the User Flow list, then click “Run user flow” from the Overview tab. Note the URL at the top of the page, used to configure Auth Connect’s Discovery URL property.
Azure AD B2C is now ready to use with Auth Connect.
Install Auth Connect
Auth Connect works on the web or on mobile. For deploying to mobile, we’ll use Capacitor, Ionic’s cross-platform native runtime for building native mobile and web apps, using JavaScript, HTML, and CSS, with one shared codebase. Learn more about the project and how to deploy this Ionic app to mobile here.
Adding Capacitor is easy:
ionic integrations enable capacitor
Run the following command to install the Auth Connect plugin. For the AUTH_URL_SCHEME variable, use the globally unique App Id (ex: com.company.app) you decided on when configuring the Azure AD app above.
npm install @ionic-enterprise/auth --variable AUTH_URL_SCHEME=com.company.app
npx cap sync
Configure Auth Connect
Configuring Auth Connect involves two steps: adding configuration details into the app from your Azure AD tenant and implementing login/logout functionality.
Azure Configuration Details
Since the Azure AD B2C app will support different values per environment (typically staging, QA, production, etc.) we can support that in the Ionic app using Angular’s environments. Open src/environments/environment.ts then add the following. We’ll begin with a web-based configuration since it’s easier to build and test locally in a browser:
import { IonicAuthOptions } from '@ionic-enterprise/auth';

export const azureWebConfig : IonicAuthOptions = {
  // the auth provider
  authConfig: 'azure',
  // The platform which we are running on
  platform: 'web',
  // client or application id for provider
  clientID: 'FILL_IN',
  // the discovery url for the provider
  // OpenID configuration
  discoveryUrl: 'FILL_IN',
  // the URI to redirect to after log in
  redirectUri: 'http://localhost:8100/login',
  // requested scopes from provider
  scope: 'openid offline_access email profile FILL_IN',
  // the URL to redirect to after log out
  logoutUrl: 'http://localhost:8100/login',
  // Show provider login in either current window or new tab
  implicitLogin: "CURRENT"
};
Some of these `IonicAuthOptions` values are unique and must be set based on the Azure AD app that we just created above:
* platform: Use “web” if running as a PWA or “capacitor” when the app is deployed as an iOS or Android app.
* clientID: Your app’s _Application (client) ID_, found on the Overview page. Example: cebbb0be-d578-4bbd-9712-4b0fe05c06aa
* redirectUri: The URI to redirect to after the user has logged in. Since we’re testing locally in a browser, use “http://localhost:8100/login” since this is what `ionic serve` runs on.
* logoutUrl: The URI to redirect to after the user has logged out. Again, use “http://localhost:8100/”.
The scope property is used to unlock access to protected resources, such as read/write permissions. There’s a variety of attributes available; an example looks like: “openid offline_access email profile”.
In addition to the values above, add the Full Scope Value link created earlier to the `scope` property. To find it in the Azure AD B2C portal, navigate to the “Expose an API” page then click on the Scope you defined earlier. In the modal window, copy the link that appears under “Scope name.” All together, it will look similar to this:
scope: 'openid offline_access email profile https://orgname.onmicrosoft.com/api/user_impersonation',
The discoveryUrl can be found by navigating to the main Azure AD B2C page -> Policies -> User flows -> [Select User Flow] -> Overview tab -> Run user flow button. The discovery link is at the top of the page and will look like the following format:
https://B2C-TENANT-NAME.b2clogin.com/B2C-TENANT-NAME.onmicrosoft.com/v2.0/.well-known/openid-configuration?p=POLICY-NAME
Where B2C-TENANT-NAME is your tenant name and the POLICY-NAME is the name of the User Flow created earlier.
The native mobile configuration is almost the same as the web. Make a copy of the web configuration then change the redirect and logout urls. Use the same AUTH_URL_SCHEME variable value (App Id) from when the Auth Connect plugin was installed. For example, “com.company.app://” plus the name of the Login page. Change the platform to “capacitor”:
export const azureNativeConfig : IonicAuthOptions = {
  platform: 'capacitor',
  redirectUrl: 'com.company.app://login',
  logoutUrl: 'com.company.app://logout'

  // snip - other variables
}
Create an Authentication Service for Login Functionality
With Azure AD environment configurations added to the Ionic app, we can now leverage them in an AuthenticationService class that encapsulates Azure AD and Ionic Auth Connect’s login functionality.
Generate this class using the ionic generate command:
ionic generate service services/authentication
Open up src/app/services/authentication.service.ts and import Auth Connect, RxJs (for tracking login status changes), and the Azure AD configuration objects we just created:
import { Injectable } from '@angular/core';
import { Platform } from '@ionic/angular';
import { IonicAuth } from '@ionic-enterprise/auth';
import { Subject, Observable } from 'rxjs';
import { azureNativeConfig, azureWebConfig } from '../../environments/environment';
Next, extend the IonicAuth class in order to gain access to Auth Connect’s functionality, and in the constructor, instantiate it with the proper Azure configuration object. Using Ionic’s Platform API, we can dynamically choose which configuration to use based on whether the app is running on the web or a mobile device.
export class AuthenticationService extends IonicAuth {
  constructor(platform: Platform) {
    // Determine whether to run on mobile or the web
    const selectedConfig = platform.is('hybrid') ? azureNativeConfig : azureWebConfig;
    super(selectedConfig);
}
Implementing login functionality is quite simple – we define our own login method then call Auth Connect’s login method.
async login(): Promise<void> {
  await super.login();
}
Upon successful login, Auth Connect calls the `onLoginSuccess` event, which we can override here to run any additional logic we need. In this case, we can emit an RxJs event when the login status changes (either logged in or logged out) then react accordingly (direct the user into the app or back to the Login page).
onLoginSuccess() {
    this._loginStatusChanged.next(true);
}
Define the status change observable right below the class definition:
 // Emit event when login status changes
  private _loginStatusChanged: Subject<boolean>;

  get loginStatusChanged(): Observable<boolean> {
    return this._loginStatusChanged.asObservable();
  }
To detect and act on the login status changing, head over to `app.component.ts` in `src/app`. Import the AuthenticationService class, then subscribe to the status change observable:
import { AuthenticationService } from './services/authentication.service';

// snip

constructor(

    private auth: AuthenticationService,
    private navController: NavController,
    private platform: Platform
  ) {

    this.initializeApp();

    this.auth.loginStatusChanged.subscribe(authenticated =>
         this.handleAuthChange(authenticated));
  }
Next, add a method that inspects the status of the login attempt. If successful, redirect the user to the Home page, otherwise, remain on the Login page:
private handleAuthChange(authenticated: boolean) {
    if (authenticated) {
      this.navController.navigateRoot(['home']);
    } else {
      this.navController.navigateRoot(['login']);
    }
  }
The last step is easy: leveraging the AuthenticationService from the Login page (`src/app/login/login.page.ts`). First, add a click handler to the Login button:
<ion-button (click)="login()" strong shape="round">
   Log in
</ion-button>
Next, add a new method to call the AuthenticationService’s login method:
async login() {
  await this.authService.login();
}
Just one last step required. When running as a web app, the user will be redirected to the Azure AD sign-in page. After successful sign-in, they’ll be sent back to the Ionic app and since this is a “fresh” load of the page, we need to pass the access token along to Auth Connect. To do so, pass the browser’s url to Auth Connect’s `handleCallback` function:
async ngOnInit() {
    if (window.location.hash) {
        await this.authService.handleCallback(window.location.href);
    }
}
Once handleCallback completes, Auth Connect will call `onLoginSuccess()` in the AuthenticationService class, which triggers the login status change event, ultimately permitting the user access to the Home page.
That’s it! Click the Login button in the browser, sign in using your Azure AD B2C credentials, then you should be redirected to the Home app.
View Azure AD User Details
Logging in is nice, but what if we took it one step further by displaying some of the Azure AD user’s profile details on the Home page?
Back over in the AuthenticationService, declare a new method to retrieve the user’s profile info from Azure. Access all information via Auth Connect’s `getIdToken` function:
async getUserInfo() {
    const idToken = await this.getIdToken();
    if (!idToken) {
      return;
    }

    let email = idToken.email;

    if (idToken.emails instanceof Array) {
      email = idToken.emails[0];
    }

    return {
      id: idToken.sub,
      email: email,
      firstName: idToken.given_name,
      lastName: idToken.family_name,
      picture: "assets/user-placeholder.jpg"
    };
  }
Next, over in the Home page (`src/app/home/home.page.ts`), make the call to `getUserInfo` when the page loads:
user: any;

constructor(private authService: AuthenticationService) { }

async ngOnInit() {
    this.user = await this.authService.getUserInfo();
}
To complete this, update the Home page’s HTML template so that it now displays the user’s profile info:
<ion-content>
  <div class="ion-padding">
    <div align="center" *ngIf="user">
      <ion-avatar>
        <img src="{{ user.picture }}">
      </ion-avatar>

      <p>{{ user.firstName}} {{ user.lastName }}</p>
      <p>{{ user.email }}</p>
    </div>

    <ion-button expand="block" (click)="logout();" style="margin-top: 50px">Log out</ion-button>
  </div>
</ion-content>
If you’re still running `ionic serve`, save all files, then the page should reload, displaying your Azure AD user profile details.
Implementing Log Out
The last step is to add logout functionality. Since we’re already in the Home page code, add a new function that calls Auth Connect’s `logout` function directly:
async logout() {
    await this.authService.logout();
  }
Back over in AuthenticationService, implement Auth Connect’s “onLogout” event, which fires once it has successfully logged out the current user. All the app needs to do is fire the login status changed event, passing “false” to indicate that the user is no longer logged in:
onLogout() {
    this._loginStatusChanged.next(false);
  }
Recall that this event will be caught over in `app.component.ts`, and since “authenticated” is now false, the user will be redirected to the Login page:
private handleAuthChange(authenticated: boolean) {
    if (authenticated) {
      this.navController.navigateRoot(['home']);
    } else {
      this.navController.navigateRoot(['login']);
    }
  }
Reload the page, click the Logout button, and you should be signed out then redirected to the Login page.
What’s Next?
In just a few steps, we added Azure AD B2C authentication to an Ionic app, with complete login and logout functionality. With Auth Connect now in place, there are many paths to go from here. You can further tweak the Azure AD user experience (such as customizing the user interface) or begin testing Auth Connect in a native app right away.
About Ionic Auth Connect
Auth Connect is built and maintained by the Ionic team. Ionic makes tools and services that empower web developers to deliver stunning native mobile and web applications, using the web tools, libraries, and frameworks that they know and love. Our cross-platform native runtime, Capacitor, provides a secure way to deliver web-based applications on a mobile device. When coupled with Ionic’s Auth Connect solution, implementing single sign-on in web applications is even easier.
Happy app building!

by Scott Muniz | Aug 10, 2020 | Alerts, Microsoft, Technology, Uncategorized
This article is contributed. See the original author and article here.
|
We continue to expand the Azure Marketplace ecosystem. For this volume, 90 new offers successfully met the onboarding criteria and went live. See details of the new offers below:
|
Applications
|
 |
Akenza Core- IoT made simple: Akenza Core on Microsoft Azure is an easy-to-use enterprise IoT system designed to help companies and cities build real-time connected solutions and add any type of device or technology to it.
|
 |
Aparavi, The Platform: Aparavi is a cloud-based data intelligence and automation platform that empowers organizations to find, control, and unlock the value of their data. Built on Microsoft Azure, Aparavi ensures secure access for analytics, machine learning, and collaboration.
|
 |
Astronomer: Astronomer enables users to easily spin up, deploy code to, and configure isolated Apache Airflow environments on Microsoft Azure Kubernetes Service clusters. It includes a full Prometheus and Grafana monitoring stack, user permission control, and a flexible logging system for full-text log search.
|
 |
Atgenomix SeqsLab: Atgenomix SeqsLab creates and manages elastic Spark clusters and a parallel file system, installs container-based pipelines, and schedules tasks to execute on CPU/GPU cores. Researchers can use it as a bio-IT platform service to build DNA/RNA workflows where large-scale execution is required.
|
 |
Barracuda CloudGen WAN Service: Barracuda CloudGen WAN is a cloud-delivered service combining the benefits of next-generation firewalls, secure SD-WAN, cloud integration, and automation to deliver a practical Secure Access Service Edge (SASE) solution on Microsoft Azure.
|
 |
Better Platform: Better is an open electronic health record (EHR) data platform designed to store, manage, query, retrieve, and exchange structured EHR data. Retrieve relevant patient information in the right place at the right time to promote safe and efficient care.
|
 |
Bitdefender GravityZone Elite – BYOL: Bitdefender’s GravityZone Elite detects and prevents sophisticated cyber threats with a proven layered approach and next-gen, non-signature technologies that stop techniques such as ransomware, zero-day malware, fileless attacks, script-based attacks, targeted attacks, and grayware.
|
 |
braincure: Available only in Japanese, the braincure smartphone application on Microsoft Azure is designed to promote improved health and wellness among the elderly.
|
 |
CLEVAS: CLEVAS is a video sharing platform that allows users to add comments to, rate, share, and analyze educational videos. It supports learning activities such as university lectures, medical practices, corporate education, and training seminars. This app is available only in Japanese.
|
 |
Dataguise for Azure Marketplace: Dataguise monitors access to elements containing raw, sensitive data; provides thorough identity inventory and classification of sensitive data; and delivers back-end automation of data subject requests for privacy standards such as PII, PCI, HIPAA, CCPA, and GDPR.
|
.png") |
DxEnterprise for Availability Groups (AGs): DxEnterprise for Availability Groups (AGs) enables SQL Server AGs to be made highly available within and between Windows and Linux nodes and across any type of infrastructure – all without relying on other cumbersome, restrictive cluster orchestration technologies.
|
 |
Expert Integrator for Power Platform: Expert Integrator for Power Platform integrates and rationalizes Salesforce data and presents it in an industry-specific format in Microsoft Power Platform, enabling rapid low-code/no-code development, app coexistence, and integration with Dynamics 365 and other Microsoft services.
|
 |
FileCloud on Red Hat Linux: CodeLathe’s FileCloud on Red Hat Linux allows businesses to host their own branded file-sharing, sync, and backup solution on Microsoft Azure for employees, partners, and customers. It provides secure, high-performance backup across all platforms and devices with unlimited file versioning.
|
 |
FlexProtect for Apps: Imperva’s FlexProtect application security is a SaaS solution that provides multi-layered defenses to protect Microsoft Azure-hosted workloads and applications from attacks while ensuring an optimal user experience.
|
 |
Fortinet FortiGate Next-Generation Firewall: Fortinet FortiGate firewall technology delivers complete content and network protection by combining stateful inspection with a comprehensive suite of powerful security features. Identify and mitigate the latest complex security threats with FortiGate on Microsoft Azure.
|
 |
Fortinet FortiWeb Web Application Firewall WAF VM: Fortinet FortiWeb web application firewalls provide advanced features and AI-based machine learning detection engines that defend web applications from vulnerability exploits, bots, malware uploads, denial-of-service attacks, advanced persistent threats, and zero-day attacks.
|
 |
Harbor Adapter Trivy Container Image: Harbor Adapter for Trivy translates the Harbor API into Trivy API calls and allows Harbor to provide vulnerability reports on images through Trivy. Bitnami packages applications following industry standards and continuously monitors all components and libraries for vulnerabilities.
|
 |
Hexplora Healthcare Analytics: Hexplora’s cloud-based Healthcare Analytics solution on Microsoft Azure is made for small-to-midsize risk-bearing healthcare entities entering value-based contracts. It provides insights that can help healthcare organizations reduce costs and improve quality.
|
 |
Horizon: SecuriThings’ Horizon is an IoTOps software-only solution that brings IT standards to the realm of IoT by providing risk detection, predictive maintenance, and automated operations. Protect IoT devices while maximizing operational efficiency in one unified view.
|
 |
Identity and Data Governance for Multi-cloud: The Dig platform from Sonrai Security delivers a complete risk model of all identity and data relationships in public clouds, including activity and movement across cloud accounts, cloud providers, and third-party data stores.
|
 |
IIS on Windows Server 2016: This image from Skylark Cloud includes Internet Information Services (IIS) and Windows Server 2016. IIS is a flexible and secure web server for hosting anything on the web, from streaming media to web applications. IIS features scalable and open architecture that is ready to handle the most demanding tasks.
|
 |
IIS on Windows Server 2019: This image from Skylark Cloud includes Internet Information Services (IIS) and Windows Server 2019. IIS is a flexible and secure web server for hosting anything on the web, from streaming media to web applications. IIS features scalable and open architecture that is ready to handle the most demanding tasks.
|
 |
Innovaccer’s COVID-19 Management system: Innovaccer’s COVID-19 Management System enables practices to more easily and efficiently manage and screen high volumes of patients. Innovaccer features a robust set of security policies, procedures, and controls to ensure full compliance with HIPAA requirements.
|
 |
JRuby Container Image: JRuby is a Java implementation of the Ruby programming language that provides core built-in classes and syntax for Ruby. Bitnami packages applications following industry standards and continuously monitors all components and libraries for vulnerabilities and application updates.
|
 |
Kong Helm Chart: Kong is an open-source microservice API gateway and platform designed for managing microservice requests to high-availability, fault-tolerant, and distributed systems. Bitnami ensures its Helm charts are secure, up to date, and packaged using industry best practices.
|
 |
LTI Security in a Box: LTI’s Security in a Box solution provides a comprehensive security stack to support simple to complex operating environments and requirements, simplified security choices with easy cloud adoption, a zero-trust security framework based on NIST standards, and more.
|
 |
Maintenance Management Solution for Solar Plants: Designed for solar operators and maintenance providers, this SharePoint maintenance management solution from WIZSP offers a flexible work environment that allows workers to collaborate seamlessly from anywhere on any device.
|
.png") |
MATLAB Production Server (PAYG): MATLAB Production Server is an application server for integrating MATLAB analytics into web, database, and production enterprise applications running on dedicated servers or on Microsoft Azure.
|
 |
Matomo with Windows Server 2016: This image from Skylark Cloud includes Matomo, formerly Piwik, and Windows Server 2016. Matomo is a free and easy-to-use open-source web analytics application offering complete data ownership, user privacy protection, GDPR compliance, and more.
|
 |
Matomo with Windows Server 2019: This image from Skylark Cloud includes Matomo, formerly Piwik, and Windows Server 2019. Matomo is a free and easy-to-use open-source web analytics application offering complete data ownership, user privacy protection, GDPR compliance, and more.
|
 |
ModernFlow: ModernFlow is an integrated process automation solution that uses Microsoft Azure and Office 365 to automate, streamline, and optimize business processes to help reduce costs, add control, and improve productivity.
|
 |
Nuventive COVID-19 Response Hub: Nuventive’s COVID-19 Response Hub is a quick-start cloud solution with a framework to bring your institution’s COVID-19 plan to life. Survey faculty and staff on their welfare with results linked to your plan in Nuventive.
|
 |
OneCore Smart Calculation Engine: OneCore Smart Calculation Engine allows organizations to replace different calculation engines with one central solution. This change supports a “one truth” vision where all calculations in ERP, CRM, and purpose-built systems use the same calculation mechanisms to calculate financial products.
|
 |
Personalization Platform: CloudEngage helps you give your customers personalized, relevant, and intuitive experiences when they visit your website. CloudEngage works seamlessly with any CMS or commerce system to help increase your web and mobile conversion rates.
|
 |
Photron-Mobile Video Creator: Photron-Mobile Video Creator is an iPhone/iPad video production and editing application that organizations use to document and share technology transfer, video manuals, work procedures, safety education, internal communications, and more. This app is available only in Japanese.
|
 |
phpPgAdmin Container Image: phpPgAdmin is a free software tool written in PHP for handling PostgreSQL database administration over the web. Bitnami packages applications following industry standards and continuously monitors all components and libraries for vulnerabilities and application updates.
|
.png") |
Platform Security (CA): New Signature’s Platform Security managed service complements and integrates with your IT services, enabling your team to focus on providing great user support and working on initiatives that deliver significant business value.
|
 |
Prometheus RSocket Proxy Container Image: Prometheus RSocket Proxy is a collection of resources used to get application metrics into Prometheus using a bidirectional, persistent remote procedure call (RPC) without ingress.
|
 |
QuickStart: QuickStart is a cloud readiness platform that uses AI, adaptive learning, and multimodality delivery to personalize employee learning and engagement. QuickStart also accelerates Microsoft Azure or multi-cloud enablement and certification.
|
 |
ResFrac Hydraulic Fracturing Reservoir Simulator: ResFrac is an integrated hydraulic fracturing and reservoir simulator that can model the well lifecycle from treatment through production. The three-dimensional compositional simulator seamlessly couples hydraulic fracturing, wellbore, geomechanical, and reservoir simulation.
|
 |
Riversand PIM-MDM for Manufacturing & CPG: Riversand’s Master Data Experience Platform for manufacturing and consumer packaged goods addresses the master data-related challenges typically encountered when organizations digitize the information value chain and enhance their omnichannel product experience for customers.
|
 |
School Day Wellbeing for Individual Schools: School Day supports students’ well-being in real time by delivering anonymous well-being data that supports decision-making in schools and empowers the school community to focus on learning.
|
 |
ScrumGenius – Automate daily standups: ScrumGenius automates team status meetings to help managers track the progress, goals, and performance of their employees. It integrates with third-party tools such as Jira, GitHub, and Microsoft Azure DevOps Services to display team activity along with each member’s status updates.
|
 |
SharpCloud Subscriptions: SharpCloud connects people, data, and processes to create dynamic threads across a business, revealing valuable insights that can be analyzed in real time. Collaborate around data-driven stories that offer a clear view of key metrics, time, relationships, and costs across projects and portfolios.
|
 |
Spring Cloud Data Flow Container Image: Spring Cloud Data Flow is a microservices-based toolkit for building streaming and batch data processing pipelines in Cloud Foundry and Kubernetes. Bitnami packages applications following industry standards and monitors components and libraries for vulnerabilities and application updates.
|
 |
Spring Cloud Data Flow Shell Container Image: Spring Cloud Data Flow Shell is a tool for interacting with the Spring Cloud Data Flow server. Bitnami packages applications following industry standards and continuously monitors all components and libraries for vulnerabilities and application updates.
|
 |
Spring Cloud Skipper Container Image: This package manager installs, upgrades, and rolls back Spring Boot applications on multiple cloud platforms. Bitnami packages applications following industry standards and continuously monitors all components and libraries for vulnerabilities and application updates.
|
 |
Spring Cloud Skipper Shell Container Image: Spring Cloud Skipper Shell is a tool for interacting with the Spring Cloud Data Skipper server. Bitnami packages applications following industry standards and continuously monitors all components and libraries for vulnerabilities and application updates.
|
 |
Sukra Industrial Platform: Based on flexible microservices, sukra.io is a fully customizable, enterprise-grade IoT platform that scales with the needs of any business and supports advanced deployment models for multi-cloud IoT solutions.
|
 |
TwinWorX – Centralized Monitoring and Control of Facilities: TwinWorX is a scalable and secure platform that integrates and normalizes all telemetry data into a single platform, resulting in increased operational visibility while providing real-time and historical data for visualization, reporting, analytics, optimization, and more.
|
 |
Visual Diagnostics: Vastmindz uses AI, computer vision, and signal processing technology to turn any device with an embedded camera into a non-invasive diagnostic tool that displays information about an individual’s heart rate, respiration rate, oxygen saturation levels, stress levels, and more.
|
 |
WAULT: The WAULT platform provides secure and verifiable data exchange between users and companies involved in business transactions without compromising privacy or data control. It’s ideal for storing and sharing verified documents that you don’t want changed.
|
 |
WAULT Portal for Businesses and Individuals: This is the trial version of the WAULT platform from Wymsical Inc. WAULT provides secure and verifiable data exchange between users and companies involved in business transactions without compromising privacy or data control.
|
 |
WordPress with Windows Server 2016: This image from Skylark Cloud includes WordPress and Windows Server 2016. WordPress is a free and open-source content management system used for websites, blogs, and applications.
|
 |
WordPress with Windows Server 2019: This image from Skylark Cloud includes WordPress and Windows Server 2019. WordPress is a free and open-source content management system used for websites, blogs, and applications.
|
Consulting services
|
 |
Application Modernization Using Containers- 4wk Imp: Hexaware will use its Amaze cloud modernization service to replatform your monolithic application to containerized macroservices or microservices with reduced total cost of ownership. Hexaware’s offering supports Java and .Net applications.
|
 |
AZ-900 Microsoft Azure Fundamentals: 2-Day Workshop: This workshop from Qualitia Energy is suitable for IT personnel who are just beginning to work with Microsoft Azure. Attendees will get hands-on experience to prepare for Exam AZ-900: Microsoft Azure Fundamentals.
|
 |
Azure Episerver Rapid Deploy: 2-Wk Implementation: Kin + Carta’s consultants will work alongside your internal team to rapidly launch and configure your Microsoft Azure environment and deploy Episerver so you can benefit from enhanced agility, elastic scale, and ease of management.
|
 |
Azure Infrastructure Migration: 2-week Assessment: Let Wintellect work with you to migrate your on-premises applications, servers, and databases to Microsoft Azure. In this engagement, Wintellect will review your environment and estimate migration costs.
|
 |
Azure Innovation Design Think: 2-day workshop: In this workshop, Dimension Data’s team will identify key opportunities to drive revenue, improve customer retention, and gain competitive business insight through analytics on Microsoft Azure.
|
 |
Azure Migration Consultant – 4 Week Implementation: Inde will use a practical approach based on the Microsoft Cloud Adoption Framework for Azure to discover your requirements, create a safe landing zone, and move your workload to Azure.
|
 |
Azure Transition Framework: 1 day workshop: Moving to Microsoft Azure requires a clear strategic route. In this workshop, Solvinity B.V. will map out that route with its cloud transition framework. This offer is available only in Dutch.
|
 |
Citrix on Azure: 3-Day Readiness Assessment: Are you ready to take advantage of Microsoft Azure for Citrix workloads? Third Octet’s assessment will evaluate your Citrix digital workspace strategy and present you with a high-level summary of findings, cost estimations, and guidelines for the transformation ahead.
|
 |
Cloud Data Warehouse: Free 1 Day Workshop: A key element of any data strategy on Microsoft Azure is a modern data warehouse. This workshop from Agile Solutions will consider your business requirements and infrastructure, charting a clear path to migrate or rebuild your data warehouse on Azure.
|
 |
Cloud Security Assessment: Two Week Assessment: In this assessment, Logicalis will examine your company’s Microsoft Azure environment, comparing it against best practices for security, performance, agility, scale, and cost. Logicalis will then offer prioritized remediation steps.
|
 |
Cloud-native 5-Wk App Modernization Implementation: In this implementation, Cloud Services LLC will help chief information officers and chief technology officers modernize their business’s legacy applications by migrating them to Microsoft Azure.
|
 |
Code First in Azure: 3-Week Proof of Concept: Tallan’s offer is designed to help organizations accelerate a technology decision for new application development projects built on Microsoft Azure, and it caters to organizations that need to deliver apps and services in a short time frame.
|
 |
Data & AI: 4 Week Proof-of-Concept: Optimus Information will use the Microsoft Cloud Adoption Framework for Azure to jump-start your data and AI journey. Optimus Information will build data pipelines and analytics pipelines for use with Azure, along with reports or dashboards using Microsoft Power BI.
|
 |
Data Strategy on Azure: 4 week Implementation: In this engagement, Agile Solutions will review your strategic vision, underlying data availability, architecture, and data management maturity to help you align your data strategy to your business needs.
|
 |
Data Strategy: 2 Week Assessment: Tallan will assess your organization’s data strategy to modernize your data management landscape. Tallan’s experts will provide recommendations for Microsoft Azure and will discuss Azure readiness.
|
 |
E2E Managed Network Solutions: Tech Mahindra’s E2E managed services provide a transformation model and approach with key Azure technologies, including IaaS and networking, to help users easily enable services in a hybrid, multi-vendor environment. |
 |
Endpoint Manager Workshop: This workshop from Move AS will teach you how to deploy and implement Microsoft Endpoint Manager in your environment. Endpoint Manager combines several Microsoft services, including Intune, Desktop Analytics, and Windows Autopilot, to keep data secure. |
 |
Free 1 Day Supplier 360 Workshop- Contact Us Offer: In this workshop, Agile Solutions will identify business use cases, infrastructure requirements, Microsoft Azure architecture, and delivery structure for a fully customized Supplier 360 data management solution.
|
 |
Free 8 hours Cloud One Day Workshop: On behalf of Zenith & Company, CLOUDZEN will deliver a free workshop for organizations interested in migrating to Microsoft Azure and needing to make a formal case to senior management. The workshop will present a roadmap to Azure through an understanding of its architecture.
|
 |
GDPR Compliant Cloud Solutions: Learn about GDPR compliance and how to attain it in this workshop from Move AS. The workshop is a good foundation for implementing Microsoft Azure Information Protection and data loss prevention. |
 |
Knowledge Mining: 2-Month Proof of Concept: Companies hold large amounts of data, yet much of it isn’t easily searchable or stored in a structured way. Predica’s proof of concept will use Microsoft Azure AI speech, vision, and language services to transform your company’s raw, unstructured information into searchable content.
|
.png") |
Manufacturing IoT: 3-Week Proof of Concept (PoC): CloudPro APS’ Microsoft Azure IoT Hub experts will help you plan for an implementation of Azure IoT to gain production insights. The solution will span calibrated telemetry sensors, endpoint devices like mobile phones, and web-based dashboards.
|
 |
Master Data Management: Free 1 Day Workshop: This workshop from Agile Solutions will identify business use cases, infrastructure requirements, Microsoft Azure architecture, and delivery structure for a master data management solution that utilizes Azure Storage and Azure SQL Database.
|
 |
Migrate Dynamics GP to Azure – 2 Hour Briefing: In this briefing, Incremental Group will discuss the process of migrating your on-premises Microsoft Dynamics GP system to Microsoft Azure. Incremental Group’s cloud experts will address any questions you have.
|
 |
Migration Service: 4-Wk Implementation: With information from Microsoft Azure Service Map, which groups applications by risk and complexity, Logicalis will migrate your environment to Azure. Environments will be migrated on an application, database, server, or workload basis, depending on the requirements gathered.
|
 |
Network Transformation Strategy: 4-Wk Assessment: In this assessment, Tech Mahindra will evaluate the customer’s virtual or physical infrastructure, determine the customer’s challenges and desired future state, and identify potential solution strategies to meet the customer’s growth objectives.
|
 |
Oakwood Cloud Ascent Suite: 4-Week Assessment: Oakwood will use its Cloud Ascent Suite to evaluate your use of Microsoft Azure services with the goal of discovering optimization and cost-saving opportunities. Cloud Ascent Suite accelerates Azure migrations by providing in-depth planning and robust price comparison tools.
|
|
SAP Cloud Readiness 10-Day Assessment: Tech Mahindra will analyze the customer’s SAP environment and assess its cloud readiness. Tech Mahindra aims to eliminate any surprises about product compatibility or migration strategy that may surface when a customer embarks on a cloud transformation journey.
|
 |
SAP on Azure – 2 weeks Assessment: In this engagement, Span d.o.o. will conduct a comprehensive assessment of your SAP landscape and provide recommendations for system architecture that will result in a modernized and cost-optimized environment on Microsoft Azure.
|
 |
SAP on Azure Landscape Review Workshop: 1 Day: This workshop from Dimension Data will guide technology managers and executives through approaches for migrating their SAP estate to Microsoft Azure. The workshop will consider potential pitfalls and conduct a landscape review to establish a business case for migration.
|
 |
Velocity Discovery Workshop Standard – 4 Hours: Sol-Tec’s workshop will help you understand the different offerings of Microsoft Azure and how Azure can support and transform your business. You’ll leave prepared for your cloud journey, with clear steps to follow.
|
 |
Velocity Landing Zone – 2 Hour Evaluation Workshop: In this free consultation, Sol-Tec’s Microsoft Azure architects and delivery consultants will help you understand how Sol-Tec can design and deploy your Azure landing zone.
|
 |
Virtual Workplace: 2-Days Implementation: Experts from Matrix3D will move your IT infrastructure to Microsoft Azure with a practical approach designed for small businesses. Enable your employees to collaborate regardless of their work location.
|
 |
Windows Autopilot: In this engagement, Move AS will deliver a proof of concept of Windows Autopilot, a Microsoft product used to set up and pre-configure new devices. Move AS will map the technical components within Windows AutoPilot, configure a Windows AutoPilot profile, and give a brief demo. |
 |
Your Clean Code MVP: 10-week implementation: Through an architecture workshop and the principles of clean code development, generic.de will use your product vision to create a sustainable prototype on Microsoft Azure. This offer is available only in German.
|
|

Recent Comments