by Scott Muniz | Aug 20, 2020 | Azure, Microsoft, Technology, Uncategorized
This article is contributed. See the original author and article here.
The Azure Sphere 20.08 OS quality release is now available in the Retail feed. This update includes enhancements and bug fixes in the Azure Sphere OS including a security update that represents a critical update to the OS. Because of this, the retail evaluation period has been shortened.
In addition, 20.08 includes new Sample applications; It does not include an updated SDK.
The following changes are included in the 20.08 OS release:
- Upgrades to incorporate a critical security update. This update addresses a CVE that has not yet been assigned an ID. We will update this post to provide more information when available. Please check back for updates.
- Resolution of a problem that caused Ethernet-enabled devices to receive a non-random MAC address after OS recovery to 20.07 (via the azsphere device recover command).
- Resolution of an issue with the system time not being maintained with RTC and battery.
- Changes to WifiConfig_GetNetworkDiagnostics to return AuthenticationFailed in a manner consistent with 20.06 and earlier. This change fixes the issue mentioned for the 20.07 release.
- Improvements to Networking_GetInterfaceConnectionStatus to more accurately reflect the ConnectedToInternet state.
- Updated the Linux kernel to 5.4.54.
For hardware manufacturers:
The 20.08 release also contains important improvements for hardware manufacturers. These changes support greater flexibility in the manufacturing process and improved stability for customers.
We’ve updated the EEPROM configuration file , which is used with the command-line FT_PROG tool, to:
- Disable Virtual COM ports to improve the stability of device-to-PC communications and reduce the number of PC crashes.
- Supply unique serial numbers that start with ‘AS’ to distinguish Azure Sphere devices from other USB Serial Converters that may be present on the same PC.
We strongly recommend that you use the updated configuration file to program your devices.
The documentation now also shows how to program the FTDI EEPROM on multiple boards in parallel. See the MCU programming and debugging interface topic for details.
Sample Applications
We are also releasing three new sample applications on Friday, 8/21. We will update this post to provide a direct link when they are available. Please check back on Friday.
- wolfSSL Sample for client-side TLS APIs – demonstrates using wolfSSL for SSL handshake in a high-level application.
- Low power MCU-to-cloud reference solution –demonstrates how you might connect an external MCU to an Azure Sphere device and send data to IoT Central. This reference solution is optimized for low power scenarios.
- Error reporting tutorial – demonstrates how to use error reporting features on the Azure Sphere platform.
For more information
For more information on Azure Sphere OS feeds and setting up an evaluation device group, see Azure Sphere OS feeds.
If you encounter problems
For self-help technical inquiries, please visit Microsoft Q&A or Stack Overflow. If you require technical support and have a support plan, please submit a support ticket in Microsoft Azure Support or work with your Microsoft Technical Account Manager. If you would like to purchase a support plan, please explore the Azure support plans.
by Scott Muniz | Aug 20, 2020 | Azure, Microsoft, Technology, Uncategorized
This article is contributed. See the original author and article here.
by Scott Muniz | Aug 19, 2020 | Azure, Microsoft, Technology, Uncategorized
This article is contributed. See the original author and article here.
This blog post continues the series about Azure Security Center threat protection for SQL IaaS VMs. As you learnt in this blog post, Azure Security Center protects SQL servers hosted on either Azure VMs, Azure Arc and on-premises. This post will focus on SQL running on-premises and how to leverage ASC threat protection for SQL in this type of scenario.
SQL Server running on-premises
If your SQL server is installed in a Windows machine, located on-premises Windows and without Azure Arc, you really have two options for connecting it to Azure:
- Deploy Azure Arc
- Connect Windows machines to Azure Security Center without Azure Arc using Log Analytics agent.
Deploying Azure Arc
You can connect any Windows machine to Security Center, however, Azure Arc provides deeper integration across all your Azure environment. If you set up Azure Arc, you will see the SQL Server – Azure Arc page in the portal and your security alerts will appear on a dedicated Security tab on that page. The first and recommended option is to set up Azure Arc on the host. Please refer to this blog post for SQL VMs hosted on Azure Arc.
Connect Windows machines to Azure Security Center without Azure Arc
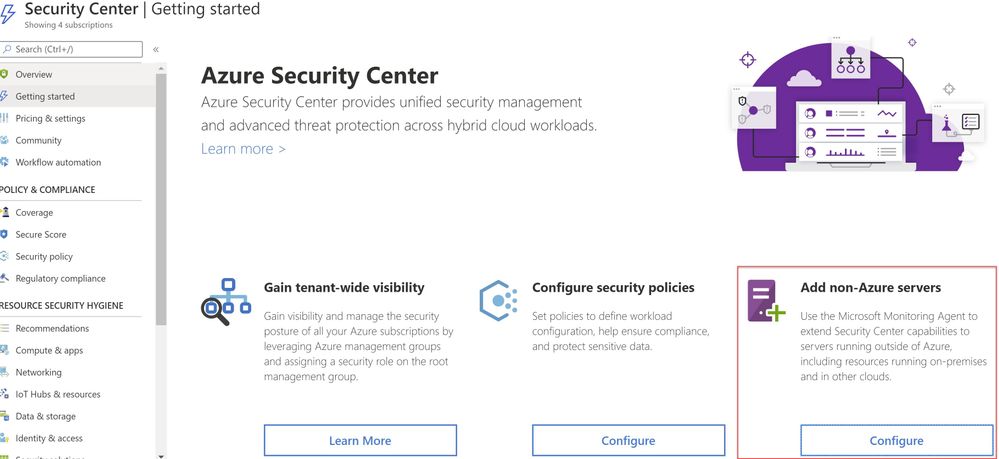
Security Center can monitor the security posture of non-Azure computers, but you need to first onboard these resources. If you choose to connect a SQL Server running on a Windows machine without using Azure Arc, you can use the option Add non-Azure servers from the Getting started blade or from the Compute blade as shown in ‘Image 1 & 2’.
 Image 1: Add Non-Azure Servers
 Image 2: Onboard servers to Security Center
You will be redirected to Direct Agent page from where you can install appropriate Windows Agent.
TIP: You can connect any on-premises machine to Azure Security center by manually installing Log Analytics agent to extend the Security Center capabilities to servers running outside of Azure be it in on-premises or in other clouds. Just make sure the on-premises machine (In our scenario, SQL server) is connected to the relevant log analytics workspace. You can check this by navigating to Log Analytics workspace > Advanced settings > Connected sources > Choose either Windows/Linux server, as shown in ‘Image 3’.
 Image 3: Confirmation of Connected Sources
Once you have the Log Analytics agent installed, Azure Security Center will start scanning the machines and flag prioritized list of recommendations accordingly, if not configured according to security best practices.
Note: for Step-by-Step instructions to onboard a non-azure computer, please refer to this article.
Validating SQL threat detection
When Azure Security Center identifies the pre-attack you should be able to view the alert in the Security alerts section as shown in ‘Image 4’
Note: Make sure you have non-azure environment selected from the Filter.
 Image 4: Security Alerts snapshot
Conclusion
Alerts are designed to be self-contained, with detailed remediation steps and investigation information in each one. You can investigate further by using Azure Security Center and Azure Sentinel capabilities for a broader view:
- Enable SQL Server’s auditing feature for further investigations. If you are an Azure Sentinel user, you can upload the SQL auditing logs from the Windows Security Log events to Sentinel and enjoy a rich investigation experience. Learn more about SQL Server Auditing.
- To improve your security posture, use Security Center’s recommendations for the host machine indicated in each alert. This will reduce the risks of future attacks.
What are you waiting for? Go ahead, leverage Azure Security Center to protect your SQL IaaS VMs.
Special thanks to:
Yuri Diogenes, Senior PM, CxE Security – ASC Team for reviewing this post.
by Scott Muniz | Aug 19, 2020 | Azure, Microsoft, Technology, Uncategorized
This article is contributed. See the original author and article here.
The cloud revolution solved one of the basic problems of infrastructure: ensuring scalability easily and simply. With Microsoft Azure services, you can now expand computing capacity on demand. While getting access to extra infrastructure is easier than ever before, the same cannot be said for the deployment tools that take advantage of this infrastructure. That’s where an Azure Marketplace partner like Codefresh can help software developers.
Kostis Kapelonis, Developer Advocate at Codefresh, explains how his company’s continuous integration/continuous delivery (CI/CD) solution in the Azure Marketplace helps companies stay competitive by delivering new features to production in a fully automated manner and at a steady pace. Adding new features quickly can help any company adapt and pivot to market needs, offering its customers the best service possible without lengthy delays. Especially in the case of important security updates, the speed at which a company can upgrade systems to a new version is paramount.
Codefresh CI/CD has native support for Azure and a heavy focus on cloud services such as Docker containers and Kubernetes clusters. It enables developers to take advantage of Azure services and minimize the time from feature inception to deployment.

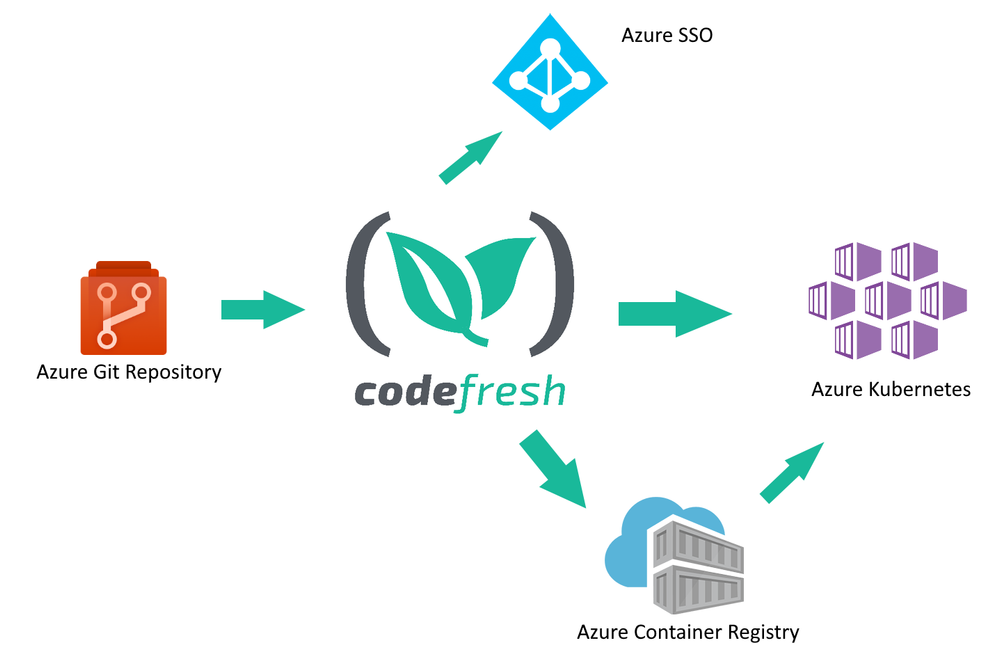
Codefresh acts as a central hub for several related Azure services:
• Developers use Azure Git repositories to create new features for their company
• Codefresh continuously builds and tests the source code from the repository
• New releases of a software product are packaged in one or more Docker containers and stored in Azure Container Registry
• The final release is deployed to Azure Kubernetes
Codefresh can also take advantage of Azure SSO/AD installations to help enterprise companies provide a unified way of credential usage among employees.
How to store Docker images in the Azure Container Registry
One of the most basic functions of a CI/CD system is the creation of software artifacts comprising a software application. Especially for cloud services, Docker images have become the de facto standard for application packaging and deployment.
Using the Azure Container Registry in Codefresh is a straightforward process. First, you connect your Azure Registry in your Codefresh account using the Integration UI screen.

Then you can use the registry in any deployment pipeline, simply by referencing it by name. A starting workflow is one that has only two steps:
• Checking out source code from Azure Git
• Building a Docker image and storing it in the Azure Container Registry.
This can be easily accomplished in Codefresh with a pipeline of two steps (a git-clone step and a build step).

Each pipeline in Codefresh is defined with declarative YAML format. Here is the respective pipeline definition:
version: “1.0”
stages:
– “clone”
– “build”
steps:
clone:
title: “Cloning repository”
type: “git-clone”
repo: “kostis-codefresh/trivial-go-web”
revision: “master”
stage: “clone”
build:
title: “Building Docker image”
type: “build”
image_name: “my-go-app”
working_directory: “${{clone}}”
tag: “latest”
dockerfile: “Dockerfile”
registry: azure
stage: “build”
This pipeline has a clone step that checks out the source code and a build step that creates the Docker image and also pushes it to ACR.
Notice the “registry” property in the build steps that define our Azure registry as the target of the Docker push action.
After the pipeline has run, the Docker image is stored in the Azure Container Registry.

How to deploy applications to Azure in an automated manner
Creating a Docker image is only one part of the software delivery process. The other part is to deploy the image artifact into production. Codefresh also has native integration for Azure Kubernetes Service (AKS).
First, you need to connect your Azure cluster in your Codefresh account.

Once the cluster is connected, you can easily deploy any application in an ad hoc manner using the deployment GUI of Codefresh.

Manual application deployments are a welcome solution for test environments and quick prototypes, but for production deployments, a delivery pipeline is the better choice, as it completely automates the software delivery process.

This delivery pipeline includes an extra deploy step that instructs the Azure Kubernetes cluster to pull the Docker image in the cluster and create an application deployment.
Here is the full pipeline definition:
version: “1.0”
stages:
– “clone”
– “build”
steps:
clone:
title: “Cloning repository”
type: “git-clone”
repo: “kostis-codefresh/trivial-go-web”
revision: “master”
stage: “clone”
build:
title: “Building Docker image”
type: “build”
image_name: “my-go-app”
working_directory: “${{clone}}”
tag: “latest”
dockerfile: “Dockerfile”
registry: azure
stage: “build”
deploy_to_aks:
title: Deploy App
type: deploy
stage: deploy
kind: kubernetes
cluster: ‘mydemoAkscluster@BizSpark Plus’
namespace: default
service: sample
candidate:
image: ‘${{build_image}}’
registry: azure
Again, notice the “registry” and “cluster” properties that explain how the Docker image deployed to the Azure Kubernetes cluster will also come from the Azure registry.
After the pipeline has finished running, you can verify the application deployment from the Codefresh Kubernetes dashboard and get more details such as health status or the number of replicas the application is using:

Conclusion
Codefresh makes the creation of Docker images and their deployment to Azure a very easy process. With built-in integration for AKS, ACR, Azure SSO, and Azure Git repositories, it is an extremely fast way for companies to take advantage of Azure scalability for any software product in any sector.
Create a free Codefresh account today and start deploying applications to Azure now.
by Scott Muniz | Aug 19, 2020 | Azure, Microsoft, Technology, Uncategorized
This article is contributed. See the original author and article here.
This installment is part of a broader series to keep you up to date with the latest features in Azure Sentinel. The installments will be bite-sized to enable you to easily digest the new content.
Every second counts. Some security incidents are unstoppable, but when prevention isn’t possible, the right investigation and response is everything. To help SOC analysts’ quickly reason over copious amount of security volume, we are delighted to introduce a set of enhancements that enrich and improve the investigation experience in Azure Sentinel.
Enable Line Numbers to Aid Quicker Debugging of Your Azure Sentinel KQL Queries
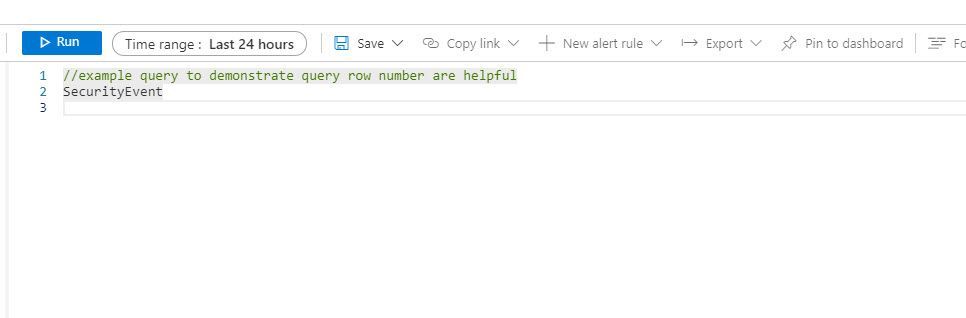
The Azure Monitor team released a new capability that enhances that way your SOC analyst reason and monitor the critical security data ingested into Azure Sentinel. To help enable quicker debugging for KQL queries in the Log Analytics workspace, analysts have the ability to enable line numbers to their KQL queries to quickly identify the line in which an error exist.
With this enhancement, when creating a Log Analytics query, each row in the query editor is indicated by a number:

This makes it easier to find the part of the query you need, when composing a new query.. The new line numbers work in tandem with our new error messages.
If there’s an error in the query the analysts composed, our newly designed error messages will indicate the row where an issue was found. Row numbers in query editor makes it faster and easier to find the issue and provides guidance to get rectify the error.

How to enable:
Open the Settings panel by clicking on the Settings cog icon and select the switch to turn row numbers off and on.

Azure Sentinel in the logs screen schema
Small, but never the less important, finally it is “Azure Sentinel”, rather than “SecurityInsights” on the schema pane of the log screen in Sentinel and in Log Analytics. This will help your SOC analysts easily identify all the data tables under the Azure Sentinel solution.

Get started today!
We encourage you to leverage the new enhancements aid in debugging and improving the investigation experience in Azure Sentinel.
Try it out, and let us know what you think!
by Scott Muniz | Aug 19, 2020 | Azure, Microsoft, Technology, Uncategorized
This article is contributed. See the original author and article here.
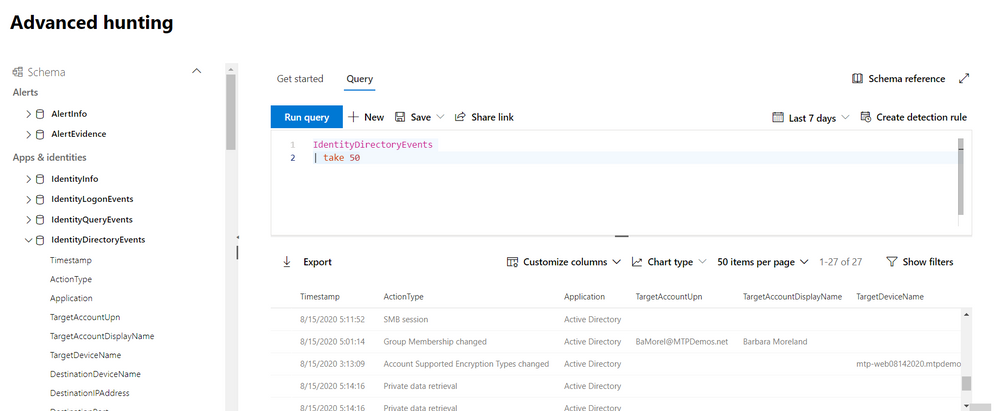
We’re thrilled to share that you can now hunt for threats using events on your domain controller with advanced hunting in Microsoft Threat Protection.
The new IdentityDirectoryEvents table—available in public preview—incorporates data from the Azure Advanced Threat Protection (Azure ATP) sensor, including various identity-related activities, such as account password changes or remote creation of scheduled tasks on the domain controller.

In general, the table captures three categories of events on your domain controller:
- Remote code execution
- Changes to attributes of Active Directory objects, including groups, users, and devices
- Other activities performed against the directory, such as replication or SMB session enumeration
You can get the full list of supported events or action types in the in-portal reference.

Here are some samples queries you can use:
//Track domain controller replication
IdentityDirectoryEvents
| where ActionType == "Directory Services replication"
| limit 100
Run query
//Track service creation activities on domain controllers
IdentityDirectoryEvents
| where ActionType == "Service creation"
| extend ServiceName = AdditionalFields["ServiceName"]
| extend ServiceCommand = AdditionalFields["ServiceCommand"]
| project Timestamp, ActionType, Protocol, DC = TargetDeviceName, ServiceName, ServiceCommand, AccountDisplayName, AccountSid, AdditionalFields
| limit 100
Run query
//Find the latest password change event for a specific account
let userAccount = '<insert your user account>';
let deviceAccount = '<insert your device account>';
IdentityDirectoryEvents
| where ActionType == "Account Password changed"
| where TargetAccountDisplayName == userAccount
//If you are looking for last password change of a device account comment the above row and remove comment from the below row
//| where TargetDeviceName == deviceAccount
| summarize LastPasswordChangeTime = max(Timestamp) by TargetAccountDisplayName // or change to TargetDeviceName for device account
Run query
As always, please let us know what you think and how we can tweak this enhancement further!
To learn more about advanced hunting in Microsoft Threat Protection and these new enhancements, go to the following links:

Recent Comments