by Scott Muniz | Sep 2, 2020 | Azure, Microsoft, Technology, Uncategorized
This article is contributed. See the original author and article here.
This post was co-authored by Krishna Anumalasetty, Tom Drabas, Nalini Chandhi from Microsoft and Abhilash Somasamudramath, Manuel Reyes Gomez, Brad Genereaux, Akhil Docca from NVIDIA

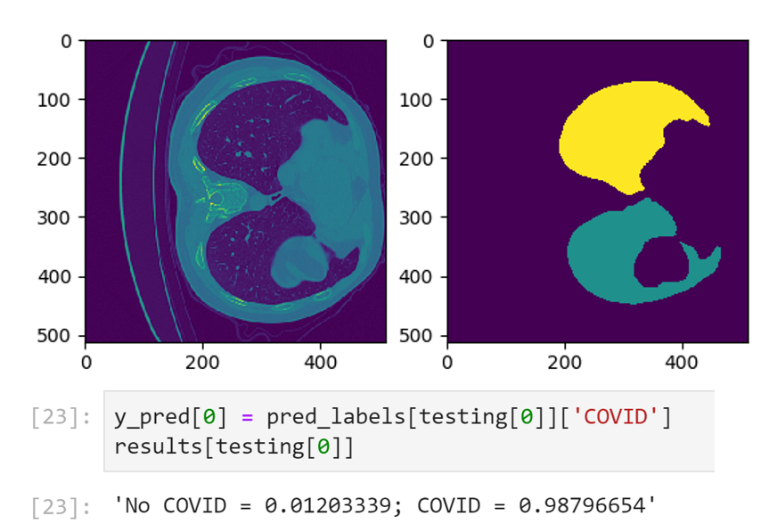
Figure 1. CT-Scan Images Classified for COVID-19 Probability
COVID-19 has fundamentally transformed the world we live in. As the scientific community across the globe unites in the face of this pandemic, it is crucial to enable researchers to collaborate and leverage tools that will speed up detection and drug discovery for COVID-19. The power of AI in radiological medical imaging is helping with faster detection, segmentation, and notifications.
Leveraging AI for healthcare applications is challenging for many reasons. The complicated science required to build and train deep learning neural networks, setup and maintenance of the supporting infrastructure required to develop, deploy, and manage these applications at scale, pose barriers towards addressing our most pressing healthcare challenges with AI.
Cloud computing has enabled researchers with easy access to scalable, on-demand infrastructure to get their AI applications up and running quickly. In the medical imaging space, the real need is for a platform that combines the power of NVIDIA GPUs with a secure environment that also allows easy access to AI software. NVIDIA Clara™ is a full-stack GPU-accelerated healthcare framework accelerating the use of AI for medical research and is available on the NVIDIA NGC Catalog.
Azure Machine Learning
Azure Machine Learning (Azure ML) empowers developers, data scientists, machine learning engineers, and AI engineers to build, train, deploy, and manage machine learning models. It is an open platform with built-in support for open-source tools and frameworks, such PyTorch, SciKit Learn and, TensorFlow along with numerous Integrated Developer Environments (IDEs), supporting key languages like Python and R.
Azure ML abstracts the set-up, installation and configuration of the machine learning environment, saving you the hassle of infrastructure management by taking care of the underlying technicalities. This enables domain experts, such as healthcare researchers and developers, to build mission-critical AI solutions faster and easier. Whether the project requires image classification, object detection, speech analysis, or natural language processing. Azure ML streamlines AI-powered solution development.
Productivity is also boosted by accelerating your training jobs with Azure’s global infrastructure. Enhance your workflow by scaling out to multi-node compute clusters or scaling up to powerful GPU-enabled machines. Combining this with end-to-end AI lifecycle management through industry-leading MLOps means data science teams can collaborate better and get to production quicker. And, with more than 60 compliance certifications including FedRAMP High, HIPAA and DISA IL5, plus configurable security features, Azure ML allows you to create a trusted working environment.
NVIDIA NGC Catalog and Clara
A key component of the NVIDIA AI ecosystem is the NGC Catalog. It is a software hub of GPU-optimized AI, HPC, and data analytics software built to simplify and accelerate end-to-end workflows. With over 150 enterprise-grade containers, 100+ models, and industry-specific SDKs that can be deployed on-premise, cloud or at the edge, the NGC Catalog enables data scientists and developers to build best-in-class solutions, gather insights, and deliver business value faster. Every single asset in the NGC Catalog is validated for performance, quality, and security by NVIDIA, providing you with the confidence needed to deploy within the Azure ML environment.
The deep learning containers in the NGC Catalog are updated and fine-tuned monthly to enable maximum performance through software-driven optimizations that augment GPU hardware acceleration. These performance improvements are made to libraries and runtimes to extract maximum performance from NVIDIA GPUs. Pre-trained models from the NGC Catalog help speed up the application building process. You can find more than 100 pre-trained models across a wide array of applications such as image analysis, natural language processing, speech processing and recommendation systems. The models are curated and tuned to perform optimally on NVIDIA GPUs for maximum performance. By applying transfer learning, you can create custom models by retraining it against your own data.
NVIDIA Clara is one many artifacts available in the NGC Catalog. Clara is a healthcare framework that comprises of full-stack GPU-accelerated libraries, SDKs, and reference applications to create secure, and scalable healthcare applications.
The Clara family of application frameworks include:
- Clara Imaging: Application frameworks for accelerating the development and deployment of AI based medical imaging workflows in radiology and pathology, as well as in some medical instruments
- Clara Parabricks: Computational framework supporting genomic analysis in DNA and RNA
- Clara Guardian: Application framework and partner ecosystem that simplifies the development and deployment of smart sensors within the hospital with multimodal AI
Clara Imaging, the focus of this blog, offers easy-to-use, domain-optimized tools to create high-quality, labeled datasets, collaborative techniques to train robust AI models, and end-to-end software for scalable and modular AI deployments. It consists of two essential elements – Clara Train and Clara Deploy:
- Clara Train is a framework that includes two main libraries; AI-Assisted Annotation (AIAA), which enables medical viewers to rapidly create annotated datasets suitable for training, and a Training Framework, a TensorFlow based framework to kick start AI development with techniques like transfer learning, federated learning, and AutoML.
- Clara Deploy provides a container-based development and deployment framework for multi-AI, multi-domain workflows in smart hospitals for imaging, genomics, and signal processing workloads. It leverages Kubernetes to enable developers and data scientists to define a multi-staged container-based pipeline.

Figure 2. The entire Clara pipeline that includes Clara train and deploy
The entire Clara Framework can be easily accessed from the Clara portfolio page. In addition to Clara Train and Deploy, reference models and pipelines are also available for download. Applying transfer learning, developers can create new models with their own custom dataset.

Figure 3. Various types of pre-trained models that cover both 2D and 3D segmentation and classification for different use cases
NGC-AzureML Quick Launch Toolkit
A ready-to-use Jupyter notebook was created to showcase the fine-tuning of a pre-trained COVID-19 CT Scan Classification model from the NGC Catalog.
To help automate the deployment, we have developed the NGC-AzureML Quick Launch toolkit that leverages the Azure ML SDK and creates the necessary compute and software resources needed to run Machine Learning applications. The Azure ML SDK uses Azure Machine Learning Compute Clusters, which require their own quota, and can be created using the same mechanism as the process followed to setup a quota for Azure VMs.
The toolkit can be used to launch any asset from the NGC Catalog, by just changing a config file. In our example, the toolkit takes relevant assets for Clara, but you can customize it to pull assets related to other uses cases such as computer vision, natural language understanding, and more.
The toolkit automates the steps outlined below:
- An Azure instance with NVIDIA GPUs is configured with the right NVIDIA libraries and drivers
- Setting the desired NGC Catalog image (Clara Train SDK in this example) onto the Azure instance
- Uploading additional material: model(s) (the pre-trained COVID-19 CT Scan Classifier in this case), auxiliary code and the corresponding datasets from the NGC Catalog to the Azure instance
- Loading the ready-to-use Jupyter notebook from the NGC Catalog that contains the application
- Installing JupyterLab the Azure instance and accessible locally to run the ready-to-use Jupyter notebook
To set up the AzureML environment, you only need to run two commands in the command line interface (CLI):
Install azureml-ngc-tools
First, install the NGC-AzureML Quick Launch Toolkit on the local machine, via Pip:
pip install azureml-ngc-tools
Configure azure_config.json
This file contains the Azure credentials and desired choice of instance type. A ready-to-use template for this example to complete can be downloaded here, which should be edited with user credentials.
An example of how the azure_config.json file might look is the following:
{
    "azureml_user":
    {
        "subscription_id": "ab221ca4-f098-XXXXXXXXX-5073b3851e68",
        "resource_group": "TutorialTestA",
        "workspace_name": "TutorialTestA1",
        "telemetry_opt_out": true
    },
    "aml_compute"
    {
        "ct_name":"clara-ct",
        "exp_name":"clara-exp",
        "vm_name":"Standard_NC12s_v3",
        "admin_name": "clara",
        "min_nodes":0,
        "max_nodes":1,
        "vm_priority": "dedicated",
        "idle_seconds_before_scaledown":300,
        "python_interpreter":"/usr/bin/python",
        "conda_packages":["matplotlib","jupyterlab"],
        "environment_name":"clara_env",
        "docker_enabled":true,
        "user_managed_dependencies":true,
        "jupyter_port":9000
    }
}
When the above file is used with the azureml-ngc-tools command, an Azure Machine Learning Compute Cluster named “clara-ct” is created using a node from the “Standard_NC12s_v3” VM size. Follow this link to learn more about the other specifications.
This file lists references to all the NGC Catalog assets that are to be pre-installed in the Azure ML environment to achieve the specific use-case. In this example, the additional resources are the ready-to-use Jupyter notebook and the associated data files. A ready-to-use config file lists the various assets needed for the application below, can be downloaded here. No additional modifications are required for this file.
The ngc_config.json file looks like:
{
    "base_dockerfile":"nvcr.io/nvidia/clara-train-sdk:v3.0",
    "additional_content": {
        "download_content": true,
        "unzip_content": true,
        "upload_content": true,
        "list":[
            {
"url":"https://api.ngc.nvidia.com/v2/models/nvidia/med/clara_train_covid19_3d_ct_classification/versions/1/zip",
                "filename":"clara_train_covid19_3d_ct_classification_1.zip",
                "localdirectory":"clara/experiments/covid19_3d_ct_classification-v2",
                "computedirectory":"clara/experiments/covid19_3d_ct_classification-v2",
                "zipped":true
            },
            {
"url":"https://api.ngc.nvidia.com/v2/resources/nvidia/med/getting_started/versions/1/zip",
                "filename":"clarasdk.zip",
                "localdirectory":"clara",
                "computedirectory":"clara",
                "zipped":true
            },
            {
"url":"https://api.ngc.nvidia.com/v2/resources/nvidia/azuremlclarablogquicklaunch/versions/example/zip",
                "filename":"claractscanexample.zip",
                "localdirectory":"clara/claractscanexample",
                "computedirectory":"clara",
                "zipped":true
            }
        ]
    }
}
When used with the azureml-ngc-tools command, the “nvcr.io/nvidia/clara-train-sdk:v3.0” container is pulled from the NGC Catalog and loaded onto the Azure ML Compute Cluster. Additionally, three resources are downloaded and unzipped into the local environment (with the names “filename” and at the relative directories “localdirectory” provided) and then loaded into the Compute Cluster at the provided location (“computedirectory”).
Run azureml-ngc-tools
Once the two configuration files are ready, run the azureml-ngc-tools command on the local machine to provision the instance:
azureml-ngc-tools --login azure_config.json --app ngc_config.json
Refer to the following screenshot:

Figure 4. AzureML instance being setup by NGC-AzureML Quick Launch Toolkit
The command creates a Compute Cluster “clara-ct” using vmSize :”Standard_NC12s_v3,” then it creates AzureML environment, “clara_env,” with base image “nvcr.io/nvidia/clara-train-sdk:v3.0.” The container is downloaded and subsequently cached after the first use, making it easier for you to reuse the container the next time.
Next, the additional NGC Catalog content is downloaded and unzipped locally, which is then uploaded to the Compute Cluster. The user should be able to see the newly created Compute Cluster, “clara-ct”, in the Azure Portal under the specified workspace, “TutorialTestA1” in this example and tabs Compute ->Compute clusters. This should look like the following:

Figure 5. Console view of AzureML Environment Setup by NGC-AzureML Quick Launch Toolkit
Additional Clara introductory content such as examples of other pre-trained model, datasets and Jupyter notebooks are also downloaded and unzipped locally at the relative directories provided in the “ngc_config.json” file. That content is also uploaded to the Compute Cluster, visible as follows:

Figure 6. Assets from the NGC Catalog pre-loaded onto Azure ML by NGC-AzureML Quick Launch toolkit
The command creates and launches JupyterLab in the Compute Cluster and forwards the port to the local machine so that the Jupyter Lab is accessed on your local machine. A URL is generated that contains the link to JupyterLab running on the Azure ML instance setup, along with the assets specified in the “ngc_app.json” file to be used on your local machine.

Figure 7. Direct URL to fully setup and configured Azure ML JupyterLab for this particular use-case
Once the you have completed your work on the JupyterLab, the Compute Cluster can be stopped by simply entering CTRL+C on the terminal.
The JupyterLab can be launched by copying and pasting the URL into a browser window, as follows:

Figure 8. URL opened on any browser window launches ready-to-use Azure ML JupyterLab
Note that it starts at the workspace root folder for the provided workspace.
To access the content uploaded by the NGC-AzureML Quick Launch Toolkit, you should navigate to the “workspaceblobstore/clara/” folder. All your relevant content will be now available in the session:

Figure 9. Overview of NGC assets pre-loaded onto your AzureML JupyterLab for this use-case
Fine-Tuning a Model with Clara Imaging and Azure ML
To demonstrate how to build and deploy AI for medical imaging using Clara Imaging and Azure ML, we will fine-tune a pre-trained COVID-19 CT Scan Classification model and optimize it for inference with a custom dataset. This pre-trained model was developed by NVIDIA Clara researchers in collaboration with the NIH, which had a repository of CT radiological images from around the world. The NVIDIA pre-trained model reports an accuracy of over 90% on classification of COVID vs. Non-COVID findings from chest CT scans. More information about the training methodology and results achieved by this pre-trained model are contained in a white paper here.
The model uses two inputs– a CT scan image, and a lung segmentation image. A computerized tomography (CT) scan is a 3D medical imaging procedure that uses computer-processed combinations of many X-ray measurements taken from different angles to produce cross-sectional (tomographic) slices of images. The data needs to be preprocessed, first by converting to Hounsfield units and then rotated to a prescribed orientation, before it can be used for training. A multitude of other pre-trained models developed by NVIDIA Clara for various healthcare applications are made available for free in the NGC Catalog. (N.B. These models are provided for research purposes only.)
The following images show one slice of the stack of images that comprise of the patient’s CT and the corresponding mask:

Figure 10. Example CT-Scan Slice with the corresponding mask (on the right) to focus the model on the lungs
The classifier produces a probability between zero and one, indicating whether the patient has or has not been infected with COVID-19. However, such predictions require a high degree of accuracy and in most cases, the CT scans used for training may have different characteristics from the original data set used to build the base model. Thus, a model will need to be fine-tuned to achieve the necessary accuracy. NVIDIA Clara includes a fine-tuning mechanism to efficiently adapt the pre-trained model to your dataset, with minimal effort, while increasing the accuracy of your model.
The hospital data for the blog is simulated using 40 labelled data from two sources:

Figure 11. The Jupyter notebook for this blog example walks through these steps
Step 1: Set Up
The ready-to-use Jupyter notebook first describes the mechanics of how the pre-trained model is built, and how it can be fine-tuned by introducing the concept of a MMAR (Medical Model ARchive). The dataset from Kaggle is downloaded (by previously obtaining the user’s Kaggle key) and the input examples are examined and visualized. The new data is then indexed in a way that Clara can refer to it for different tasks, such as inferring if the patient has COVID-19 or not, fine tuning, and/or deploying the model. Refer to the CovidCT-ScanClassifier.ipynb Jupyter notebook to see how all these tasks are done with more details.
The data set that we are using to fine-tune the model consists of 40 samples studies. To test the current accuracy of the model, we’ll use three data points from the set. We’ll exclude these three data points when we eventually fine-tune the model.
The Jupyter notebook separates those example as seen here:

Figure 12. Slicing the reference dataset for training and testing
Step 2 Classify/Infer on Test Data
Use the infer.sh command to check the accuracy of the model by using the test data.
The MMAR from the base model has the original configuration files used to train the base model with. Those files need to be adapted to the new data before the infer.sh command is run. The Jupyter notebook will execute all the modifications needed to the required files.
Once the configuration files have been adapted, the infer command is run on the test data.
Inspecting the inference results
The Jupyter Notebook then retrieves the probabilities produced by the “new_infer.sh” command and estimates the predicted labels (1:COVID, 0:NO COVID). Those labels are then used along the true labels to compute the testing examples average precision score using the sklearn.metrics.average_precision_score function.

Figure 13. Testing the pre-trained model for performance without fine-tuning on the new reference dataset
Notice that the average precision (0.833) is not as high as expected (.90 or 90% or higher) because some instances of the new data have either not been preprocessed in Hounsfield units or haven’t be rotated to a specific orientation. We can now improve the accuracy of the model by fine-tuning it with the full data set.
Step 3 Fine Tune
The train_finetune.sh command executes the fine-tuning mechanism where the original script and its configuration files are adapted to point to the new training data.
Execute new_train_finetune.sh Command


Figure 14. Fine-tuning the Clara COVID-19 CT Scan Classification pre-trained model with training set of reference dataset
Once the training is complete, you can view the training accuracy, training loss, mean accuracy, and the time it took for the fine-tuning to finish. You can decide to either export the model or continue fine-tuning the model. By default, the resulting model is not automatically saved nor exported. The trained model can be exported using the export.sh command. This produces the frozen graphs necessary for the model to be used by other applications, such as Clara Deploy. The Jupyter notebook sets up the new model so that it can be used to classify the test data.
Step 4: Re-test Reclassifying Inference with fine-tuned model
The Jupyter notebook creates a new infer.sh command that points to the full data set and to the new fine-tuned model and then executes the command.
The next step is to compute the Average COVID-19 Classification Precision across all testing examples. The Jupyter Notebook then retrieves the probabilities produced by the “finetuned_infer.sh” command and estimates the predicted labels with 1 (high likelihood of infection) or 0 (low likelihood of infection).
Those labels are then used along the true labels to compute the testing examples’ average precision score using the sklearn.metrics.average_precision_score function.

Figure 15. Testing the fine-tuned model for performance on the testing slice of data from the new reference dataset
Notice that the average precision is now much higher, so the fine-tuning mechanism has succeeded to fine tune the model to account for the peculiarities of the new data.
Deploying the Model
After the AI model is exported and checked, the Medical Model Archive MMAR can then be connected into research workflow pipelines. These pipelines contain operators for the various phases of pre-transforms and inference. The results are consumable by a medical imaging ecosystem. (e.g. a DICOM-SR, a secondary capture image with burnt-in results, an HL7 or FHIR message) The imaging pipeline can be constructed using Clara Deploy SDK, which uses building blocks called operators. Clara Deploy SDK comes with many ready-made pipelines for getting started.
Understanding and mapping the architecture in any given environment is important to know when constructing this pipeline. For example, simulating the connectivity from an image manager like a PACS by using transformation frameworks to transform the data for the model, is a good first step. Subsequent to the first step, inference tasks follow, and then delivering the outputs in the format accepted by systems and devices at medical institutions.

Figure 16. A sample deployment workflow using the Clara Deploy application framework
When thinking about the results, it is important to consider the types of data being produced and the systems that it will be deployed on. For instance, is it a classification result (presence or absence of a disease, like COVID-19), a DICOM-SR for display within a PACS, or a FHIR Observation object. If it is a segmentation result (identifying a lesion or nodule), creating a DICOM Segmentation object may be appropriate. These are examples of the types of objects consumable by the medical imaging ecosystem and the architecture of the environment is important to know when constructing this pipeline.
Summary
We have shown you how you get started with Clara Train on AzureML for radiological CT images, using a pre-trained AI COVID-19 classification model. This is one example that can be built with the software from the NGC Catalog and AzureML. Beyond just building healthcare centric application, you can use the containers, models, and SDKs from the NGC Catalog to build applications across other use cases, such as conversational AI, recommendation systems, and many more.
Get started today with NVIDIA Clara from the NVIDIA NGC Catalog on Azure ML.
by Scott Muniz | Sep 1, 2020 | Azure, Microsoft, Technology, Uncategorized
This article is contributed. See the original author and article here.
Howdy folks,
Over the past six months, we have seen organizations adapt to remote business environments and engage with an unprecedented number of external users, and we’ve seen our own service usage growing like crazy for scenarios. With this growth, we also know that security continues to be top of mind.
Today, we are excited to announce the Public Preview of Conditional Access and Identity Protection for Azure Active Directory (Azure AD) B2C. We also have an update to our pricing that makes all Azure AD External Identities features more predictable and affordable with support for premium security features. On the blog today, we’re welcoming back Robin Goldstein, to share more about the new capabilities and pricing.
Regards,
Alex
—–
Hi everyone,
Previously, I shared our Azure AD External Identities vision to make it easier to secure, manage and build apps for collaborating and connecting with external users. Today’s announcement, which adds Conditional Access and Identity Protection to Azure AD B2C, is another step in our journey to help organizations protect all their identities with Microsoft’s world-class security features.
Protect your customers, apps, and brand
Security is essential to maintaining your customers’ and consumers’ trust and protecting your organization’s data. That’s why so many of our Azure AD customers rely on Azure AD Identity Protection and Azure AD Conditional Access. Identity Protection helps organizations automatically protect against account compromise with cloud intelligence, powered by advanced risk detection based on heuristics, User and Entity Behavior Analytics (UEBA), and machine learning (ML) from signals across the Microsoft ecosystem. By pairing Conditional Access policies with the power of Identity Protection, admins can. This combination already helps Fortune 500 organizations prevent over 10 million attacks each month.
By making risk-based Conditional Access and risk detection features of Identity Protection available in Azure AD B2C, our customers can now:
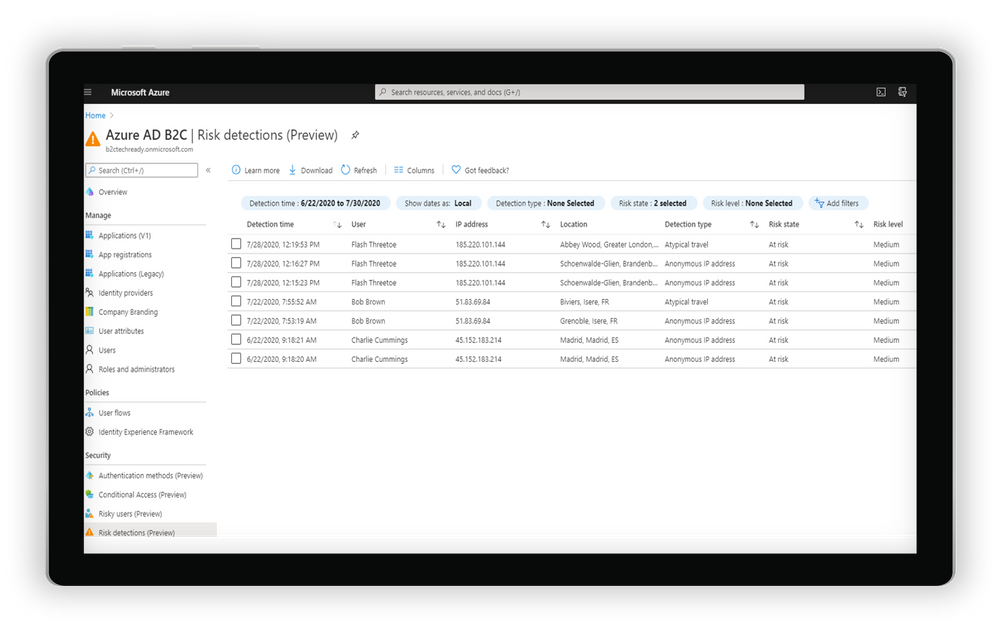
- Leverage intelligent insights to assess risk with B2C apps and end user accounts. Powered by signals from billions of monthly authentications across Azure AD and Microsoft accounts, Identity Protection real-time ML algorithms use adaptive intelligence to flag authentications as low, medium, or high risk and gets smarter and more accurate over time. Detections include atypical travel, anonymous IP addresses, malware-linked IP addresses, and Azure AD threat intelligence. Portal and API-based reports are also available.
 Examine risk detections flagged through the portal
- Automatically address risks by configuring adaptive authentication policies for B2C users. By tailoring Conditional Access policies, app developers and administrators can mitigate real-time risk by requiring multi-factor authentication (MFA) or blocking access depending on the user risk level detected, with additional controls available based on location, group, and app.

Create a Conditional Access policy based on the level of sign-in risk
- Integrate with Azure AD B2C user flows and custom policies. Conditions can be triggered from built-in user flows in Azure AD B2C or can be incorporated into B2C custom policies. As with other aspects of the B2C user flow, end user experience messaging can be customized according to the organization’s voice, brand, and mitigation alternatives.

Create a user flow in Azure AD B2C
Get started today
Conditional Access and Identity Protection for Azure Active Directory (Azure AD) B2C will be progressively rolled out across Azure regions starting on September 1. To start using the new features, you will need to do a few things first:
- Link your Azure AD B2C tenant to an Azure subscription. This allows you to use Azure AD premium features for Azure AD External Identities and Azure AD B2C.
- Enable Premium P2 features in your Azure AD B2C tenant. This allows you to access Identity Protection and all future Premium P2 features for Azure AD External Identities and Azure AD B2C.
- Start using the new recommended user flows in Azure AD B2C. This allows you to connect to your Conditional Access policies and all new features added to B2C user flows in the future.

Selecting and creating recommended user flows in Azure AD B2C
And of course, you can always check out our documentation to learn more about setting up risk-based Conditional Access policies for Azure AD B2C.
Pricing update
Azure AD External Identities features are now available as part of one unified offer based on monthly active usage. Whether you use Azure AD B2C, B2B collaboration or the new self-service sign-up features in Azure AD, securing and managing external users is more affordable than ever, with the first 50,000 monthly active users free at both the Premium P1 and Premium P2 tiers. For more information on the new offer with pricing details click For documentation to set up your tenants for this offer, click here.
As always, we hope you’ll try out the new features and share feedback through the Azure forum or by following @AzureAD on Twitter.
Thanks!
Robin
Learn more about Microsoft identity:
by Scott Muniz | Sep 1, 2020 | Azure, Microsoft, Technology, Uncategorized
This article is contributed. See the original author and article here.
Hi, all! Rod Trent here. I am a Cybersecurity CE/Consultant at Microsoft and working with Azure Sentinel. I also blog for our Secure Infrastructure Blog and have quite a few Azure Sentinel articles posted there already.
As a general best practice, you want to configure access to Azure Sentinel resources through the Resource Group and you want to ensure you are providing only the access required i.e., using a least permissive model. Azure Sentinel resource access is applied using the following assignment roles…
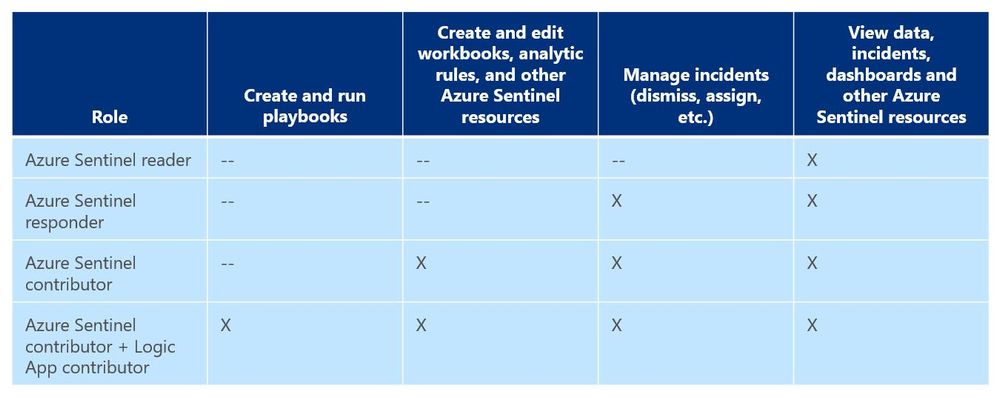
 Azure Sentinel roles and allowed actions
I talk about these roles, access, and best practices for access based on analyst levels quite often with our customers. Building security team members’ responsibilities is important and a critical part of the SOC workflow. However, one of the first things customers ask during this discussion is about Playbook usage. As you can see from the table above, to actually run Playbooks (apply automation), an analyst is required to have both Azure Sentinel contributor and Logic App contributor roles. Hmmm…so what if you want the Responder or Reader roles to perform automation?
Keep in mind that Playbooks are powerful. In the wrong hands, dangerous things can happen. Who really wants to accidentally lock the CEO out their login account because the password was forgotten, was typed in wrong 10 times in the last hour, and the HelpDesk was never called due to ego? But if it’s going to happen – even on purpose – it’s probably best for a seasoned analyst to take the blame for it. It could be a career-ending move for a Tier 1 analyst.
Creating Playbooks should go through a methodical, logical process. Only create a Playbook out of need and also ensure that the proper teams are involved during the design. Don’t automate just to automate. For example, for those situations where a Playbook causes a user account to be locked or a port to be blocked at the firewall, its best for the Security team to work with the Operations team to make sure it’s done correctly and effectively and that it’s gone through the proper authorizations. Think about it. By applying automation through Playbooks you are effectively shortcutting the Change Management process. Without proper vetting from the proper teams, bad things could happen both technically and politically. Oh…and feelings could be hurt, too. And, what’s worse than that?
So, after all the vetting has taken place and the authorization checkboxes have been ticked, you may determine that certain Playbooks are safe and they might fit a requirement to be run by those who don’t have the overarching Logic App contributor role or god-like powers in either Azure or Azure Sentinel. You probably don’t want a Tier 1 analyst who is assigned the lowly Azure Sentinel Reader role to be able to lockout users, but it might be beneficial for them to do something more simple like ensuring each open Incident has the IP GEO location applied.
Fortunately, since Playbooks are built on Logic Apps and Logic Apps provides the ability to set specific access per resource, you can assign specific Playbook access using Access Control (IAM).
Here’s an example…
In my Azure tenant I have a user account, Jaime Sommers, who has been assigned the Azure Sentinel Reader role. With that role Jaime is limited to only being able to view data in the Azure Sentinel console.
But I want Jaime to be able to add the GEO location to Incidents using the Get-GeoFromIpandTagIncident Playbook – but only THAT Playbook – and none of the others. That’s going to save our team time as our Tier 2 analysts gear up each day to determine which new Incidents they need to start investigating.
Through the Playbooks blade in the Azure Sentinel console, I access the Access Control (IAM) blade and assign the Logic Apps Contributor role specifically to the user account Jaime Sommers.
 Adding the Logic App Contributor role to a specific Playbook for a specific analyst
Adding the Log Analytics Contributor role to a specific Playbook for a specific analyst
After a brief sync (it can sometimes take a minute or longer), when Jaime refreshes her Playbooks blade, she can now see the specific Playbook and can then use it to apply GEO location to an Incident she is working on.
 Playbook access for Jaime
As you can see in the image above, the bottom screenshot example is Jaime without the specific Logic App Contributor role assigned and the top screenshot example is after she has been granted access to it.
Summary
And, even though Jaime is severely limited in what she can do in the Azure Sentinel console due to her lowly Azure Sentinel Reader role assignment, she can now run the Playbook and GEO is assigned to the Incident.
 Huzzah!
* Check out my other blog for more Azure Sentinel content: Rod Trent at the Secure Infrastructure Blog
* Follow me on Twitter: https://twitter.com/rodtrent

by Scott Muniz | Sep 1, 2020 | Azure, Microsoft, Technology, Uncategorized
This article is contributed. See the original author and article here.
Introduction
With an ever-expanding ocean of data, more and more organizations need to perform advanced and fast analytics over their business data, logs, and telemetry while seeking to reduce costs. Many of them are shifting towards Azure Data Explorer (ADX) and taking advantage of the significant benefits it offers to analyze billions of records quickly and cost-effectively.
But sometimes they are already using other tools. One common scenario is that organizations are already using Elasticsearch, Logstash, and Kibana (The ELK Stack). Migration between big data platforms sounds like a long and complicated process. But that’s not always true. Switching from ELK to Azure Data Explorer offers the opportunity to significantly boost performance, reduce costs and improve the quality of insights by offering advanced query capabilities; all this without entering a long and complex migration, thanks to the tools described below.
This blog post covers the following topics:
- Why organizations are moving to Azure Data Explorer
- How you can use Azure Data Explorer with Kibana
- What additional tools for data exploration, visualizations, and dashboards are available
- How you can send data to Azure Data Explorer through Logstash (or other tools)
- How to use Logstash to migrate historical data from Elasticsearch to Azure Data Explorer
- Appendix: Step by step example – using Logstash to migrate historical data from Elasticsearch to Azure Data Explorer
1. Why organizations are moving to Azure Data Explorer
Azure Data Explorer is a highly scalable and fully managed data analytics service on the Microsoft Azure Cloud. ADX enables real-time analysis of large volumes of heterogeneous data in and allows rapid iterations of data exploration to discover relevant insights. In short, the advantages of ADX can be summed up using the three Ps: Power, Performance, Price.
Power
 Azure Data Explorer has a unique column-store inverted-index design. With the intuitive Kusto Query Language (KQL) you can query an enormous amount of data and perform ad-hoc analytics in seconds.
Users state that they find it easier to find value and new insights from their data, using KQL. They are more engaged and understand the data better, since they can efficiently explore the data and run ad-hoc text parsing, create run-time calculated columns, aggregations, use joins, and plenty of other capabilities.
These capabilities are natively supported without the need to modify the data. You don’t have to pre-organize the data, pre-define scripted fields, or de-normalize the data. There is no need to manage and take care of the hierarchy of Indices, Types, and IDs.
Azure Data Explorer’s machine–learning capabilities can identify patterns that are not obvious and detect differences in data sets. With capabilities like time series analysis, anomaly detection, and forecasting, you can uncover hidden insights and easily point out issues or unusual relationships you may not even be aware of. You can also run inline Python and R as part of the queries.
Also, Azure Data Explorer supports many communication APIs and client libraries, all of which make programmatic access easy.
Performance
 As a fully managed service, Azure Data Explorer gives you best–in-class performance. You can get results from one billion records in less than a second without modifying the data or metadata. ADX can accept hundreds of billions of records a day and store this data reliably for months. ADX is specifically built to handle complex analytics queries on the data and return answers in a matter of seconds, even when the data is a combination of structured, semi-structured (JSON-like nested types), and unstructured (free text).
Price
 Azure Data Explorer is a managed Platform as a Service (PaaS), so you can reduce the management and operations overhead and save the cost of purchasing and maintaining hardware. Auto–scale capabilities are available for better cost control. Due to the efficient data ingestion process and querying engine, compute resources are consumed wisely and economically. The inverted-index columns-store design enables ADX to have a superb data compression ratio, which reduces the amount of required storage, compared to other services. You can run as many queries as you need, thanks to the optimized cost structure, without incurring additional costs. In addition, ADX provides a granular cache policy that customers can set to differentiate between hot data cache and cold data cache, and get even more control over the costs.
You can configure and estimate the costs with our cost estimator.
2. How you can use Azure Data Explorer with Kibana
As announced in a separate blog post, we developed the K2Bridge (Kibana-Kusto Bridge), an open-source project that enables you to connect your familiar Kibana’s Discover tab to Azure Data Explorer. Starting with Kibana 6.8, you can store your data in Azure Data Explorer on the back end and use K2Bridge to connect to Kibana. This way, your end-users can keep using Kibana’s Discover tab as their data exploration tool.  Connect Kibana to Azure Data Explorer with K2Bridge
3. What additional tools for data exploration, visualizations, and dashboards are available
Azure Data Explorer offers various other exploration and visualization capabilities that take advantage of the rich and built-in analyses options of KQL, including:
- Azure Data Explorer Web UI/Desktop application – to run queries, analyze and explore the data using powerful KQL queries.
- The KQL render operator offers various out-of-the-box visualizations such as tables, pie charts, anomaly charts, and bar charts to depict query results. Query visualizations are helpful in anomaly detection, forecasting, machine–learning scenarios, and more.
As described in the first chapter, you can efficiently run ad-hoc text parsing, create calculated columns, use joins and plenty of other capabilities, without any modifications or pre-organizations of the data.
- Azure Data Explorer dashboards – a web UI that enables you to run queries, build dashboards, and share them across your organization.
- Integrations with other dashboard services like Power BI and Grafana.
4. How you can send data to Azure Data Explorer through Logstash (or other tools)
Are you already using Logstash as the data pipeline? If so, redirecting the data to ADX is easy! You can use the open-source Logstash Output Plugin for Azure Data Explorer (a detailed example is described in the next chapter), and keep using the Logstash input plugin according to your specific source of the ongoing event stream, as you use it today. 
There are many other ways to ingest data into Azure Data Explorer, including:
- Ingestion using managed pipelines – using Azure Event Grid, Azure Data Factory (ADF), IoT Hub and Event Hub (Event Hub can receive data from several publishers, including Logstash and Filebeat, through Kafka).
- Ingestion using connectors and plugins – Logstash plugin, Kafka connector, Power Automate (Flow), Apache Spark connector
- Programmatic ingestion using SDKs
- Tools – LightIngest or One–click ingestion (a detailed example is described in the next chapter)
- KQL ingest control commands
For more information, please refer to the data ingestion overview.
5. How to use Logstash to migrate historical data from Elasticsearch to Azure Data Explorer
Choose the data you care about
When you decide to migrate historical data, it is a great opportunity to validate your data and needs. There is a good chance you can remove old, irrelevant, or unwanted data, and only move the data you care about. By migrating your freshest and latest data only, you can reduce costs and improve querying performance.
Usually, when organizations migrate from Elasticsearch to Azure Data Explorer, they do not migrate historical data at all. The approach is a “side-by-side” migration: they “fork” their current data pipeline and ingest the ongoing live data to Azure Data Explorer (by using Logstash/Kafka/Event Hub connectors, for example). Anyway, we show how you can migrate your historical data using Logstash. For efficiency, the Logstash output plugin section in the next examples contains a ‘query’ section in which you specify the data you care about and would like to export from Elasticsearch.
Data migration from Elasticsearch to Azure Data Explorer
Here we describe two methods to migrate historical data from Elasticsearch using Logstash. See the appendix for a step-by-step tutorial.
Method 1: Logstash and One-click Ingestion/LightIngest

Use Logstash to export the data from Elasticsearch into CSV or JSON file(s), and then use Azure Data Explorer’s One-Click Ingestion feature to ingest the data.
- This is an easy way to quickly ramp-up and migrate data because One-Click Ingestion automatically generates the destination table and the ingestion mapping based on the structure of the data source (of course, you can edit the table schema if you want to).
- One-Click Ingestion supports ingesting up to 1 GB at a time. To ingest a more massive amount of data, you can:
- Slice your data into multiple files and ingest them separately.
- Use LightIngest – a command-line utility for ad-hoc data ingestion. The utility can pull source data from a local folder (or from an Azure blob storage container).
- Use the second method described below.
Method 2: Using Logstash only (with the output plugin for Azure Data Explorer)

Use Logstash as a pipeline for both exporting data from Elasticsearch and ingesting it into Azure Data Explorer. When you use this method, you should manually create the Azure Data Explorer destination table and define the ingestion mapping. (You can automatically generate the destination table and the table mapping by using One-Click Ingestion with sample data, as described in method 1 first, and then use method 2 for the rest of the data)
In this blog post, we talked about the advantages of Azure Data Explorer, went over several visualizations options, including the open-source Kibana-Azure Data Explorer connector, and introduced a variety of ways you can ingest your ongoing data into Azure Data Explorer. Then, we presented two ways to migrate historical data from Elasticsearch to Azure Data Explorer.
In the appendix, you can find two step-by-step sample scenarios for historical data migration.
Please do not hesitate to contact our team or leave a comment if you have any questions or concerns.
Appendix: Step-by-step example of historical data migration
Method 1: Logstash and One–Click Ingestion
- Use Logstash to export the relevant data to migrate from Elasticsearch into a CSV or a JSON file. Define a Logstash configuration file that uses the Elasticsearch input plugin to receive events from Elasticsearch. The output will be a CSV or a JSON file.
- To export your data to a CSV file: use the CSV output plugin. For this example, the config file should look like this:
# Sample Logstash configuration: Elasticsearch -> CSV file

input {
    # Read documents from Elasticsearch matching the given query
    elasticsearch {
        hosts => ["http://localhost:9200"]
        index => "storm_events"
        query => '{ "query": { "range" : {  "StartTime" : { "gte": "2000-08-01 01:00:00.0000000", "lte": "now" }}}}'
    }
}

filter {
    ruby {
        init => "
            begin
                @@csv_file    = 'data-csv-export.csv'
                @@csv_headers = ['StartTime','EndTime','EpisodeId','EventId','State','EventType']
                if File.zero?(@@csv_file) || !File.exist?(@@csv_file)
                    CSV.open(@@csv_file, 'w') do |csv|
                        csv << @@csv_headers
                    end
                end
            end
        "
        code => "
            begin
                event.get('@metadata')['csv_file']    = @@csv_file
                event.get('@metadata')['csv_headers'] = @@csv_headers
            end
        "
    }
}

output {
    csv {
        # elastic field name
        fields => ["StartTime","EndTime","EpisodeId","EventId","State","EventType"]
        # This is path where we store output.
        path => "./data-csv-export.csv"
    }
}
This config file specifies that the ‘input’ for this process is the Elasticsearch cluster, and the ‘output’ is the CSV file.
- Implementation note:The filter plugin adds a header with the field names to the CSV file’s first line. This way, the destination table will be auto built with these column names. The plugin uses the ‘init’ option of the Ruby plugin to add the header at Logstash startup-time.
- Alternatively, you can export your data to a JSON file, using the file output format.
This is what our Logstash config file looks like:
# Sample Logstash configuration: Elasticsearch -> JSON file
input {
# Read documents from Elasticsearch matching the given query
elasticsearch {
hosts => ["http://localhost:9200"]
index => "storm_events"
query => '{ "query": { "range" : { "StartTime" : { "gte": "2000-08-01 01:00:00.0000000", "lte": "now" }}}}'
}
}
output {
file {
path => "./output_file.json"
codec => json_lines
}
}
- The advantage of using JSON over CSV is that later, with One–Click Ingestion, the Azure Data Explorer ‘create table’ and ‘create json mapping’ commands will be auto-generated for you. It will save you the need to manually create the JSON table mapping again (in case you want to ingest your ongoing data with Logstash later on. The Logstash output plugin uses json mapping).
- Start Logstash with the following command, from Logstash’s bin folder:
logstash -f pipeline.conf
- If your pipeline is working correctly, you should see a series of events like the following written to the console:

- The CSV/JSON file should be created at the destination you specified in the config file.
- Ingest your data into Azure Data Explorer with One–Click Ingestion:
- Open the Azure Data Explorer web UI. If this is the first time you are creating an Azure Data Explorer cluster and database, see this doc.
- Right–click the database name and select Ingest new Data.
- In the Ingest new data page, use the Create new option to set the table name.
- Select Ingestion type from a file and browse your CSV/JSON file.
- Select Edit schema. You will be redirected to the schema of the table that will be created.
- Optionally, on the schema page, click the column headers to change the data type or rename a column. You can also double-click the new column name to edit it.
For more information about this page, see the doc.
- Select Start Ingestion to ingest the data into Azure Data Explorer.
- After a few minutes, depending on the size of the data set, your data will be stored in Azure Data Explorer and ready for querying.
Method 2: Using Logstash only
- Create an Azure Data Explorer cluster and database.
Note: If you have already created your Azure Data Explorer cluster and database, you can skip this step.
More information on creating an Azure Data Explorer cluster and database can be found here.
-
Create the destination table.
Note: If you have already created your table with One-Click Ingestion, or in other ways, skip this step.
Tip: The One-Click Ingestion tool auto-generates the table creation and the table mapping commands, based on the structure of sample JSON data you provide. If you use One-Click Ingestion with a JSON file, as described above, you can use the auto-generated commands, from the Editor section.
 Auto-generate the table and its mapping using One-Click IngestionIn the Azure portal, under your cluster page, on the left menu, select Query (or use Azure Data Explorer Web UI/Desktop application) and run the following command. This command creates a table with the name ‘MyStormEvents’, with columns according to the schema of the data.
.create tables MyStormEvents(StartTime:datetime,EndTime:datetime,EpisodeId:int,EventId:int,State:string,EventType:string)
- Create ingestion mapping.
Note: If you used One-Click Ingestion with a JSON file, you can skip this step. This mapping is used at ingestion time to map incoming data to columns inside the ADX target table.
The following command creates a new mapping, named ‘mymapping’, according to the data’s schema. It extracts properties from the incoming temporary JSON on files, that will be automatically generated later, as noted by the path, and outputs them to the relevant column.
.create table MyStormEvents ingestion json mapping 'mymapping' '[{"column":"StartTime","path":"$.StartTime"},{"column":"EndTime","path":"$.EndTime"} ,{"column":"EpisodeId","path":"$.EpisodeId"}, {"column":"EventId","path":"$.EventId"}, {"column":"State","path":"$.State"},{"column":"EventType","path":"$.EventType "}]'
- Your table is ready to be ingested with data from your existing Elasticsearch index. To ingest the historical data from Elasticsearch, you can use the Elasticsearch input plugin to receive data from Elasticsearch, and the Azure Data Explorer (Kusto) output plugin to ingest the data to ADX.
- If you have not used Logstash, you should first install it
- Install the Logstash output plugin for Azure Data Explorer, which sends the data to Azure Data Explorer, by running:
bin/logstash-plugin install logstash-output-kusto
- Define a Logstash configuration pipeline file in your home Logstash directory.
In the input plugin, you can specify a query to filter your data according to a specific time range or any other search criteria. This way, you can migrate only the data you care about.
In this example, the config file looks as follows:
input {
# Read all documents from your Elasticsearch, from index “your_index_name”
    elasticsearch {
        hosts => ["http://localhost:9200"]
		index => " your_index_name "
        query => '{ "query": { "range" : {  "StartTime" : {"gte": "2020-01-01 01:00:00.0000000", "lte": "now"}} } }'
    }
}

output {
    kusto {
        path => "/tmp/kusto/%{+YYYY-MM-dd-HH-mm }.txt"
		ingest_url => "https://<your cluster name>.<your cluster region>.kusto.windows.net”
		app_id => "<Your app id>"
		app_key => "<Your app key>"
		app_tenant => "<Your app tenant>"
        database => "<Your Azure Data Explorer DB name>"
		table => "<Your table name>"
		mapping => "<Yor mapping name>"
    }
}
- Edit your configuration pipeline file according to your Azure Data Explorer cluster details and start Logstash with the following command, from Logstash’s bin folder:
logstash -f pipeline.conf
- If your pipeline is working correctly, you should see a series of events like the following written to the console:
- After a few minutes, run the following Azure Data Explorer query to see the records in the table you defined:
MyStormEvents | count
The result is the number of records that were ingested into the table. It might take several minutes to ingest the entire dataset, depending on the size of the data set. The result of this query reflects the quantity of ingested records. Your data is now stored in Azure Data Explorer and is ready for querying!


.png")
.png")


Recent Comments