New Threat analytics report shares the latest intelligence on recent nation-state cyber attacks

New Threat analytics report shares the latest intelligence on recent nation-state cyber attacks

This article is contributed. See the original author and article here.

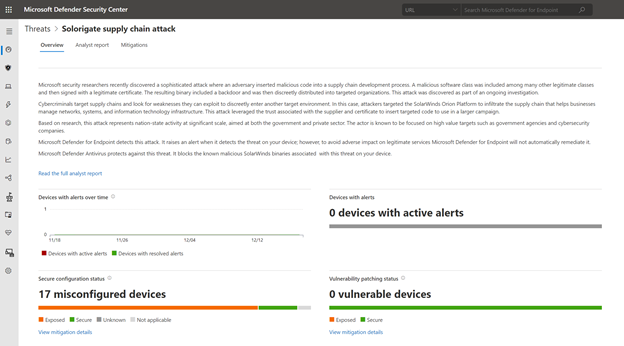
Microsoft security researchers have been investigating and responding to the recent nation-state cyber-attack involving a supply-chain compromise followed by cloud assets compromise.

Microsoft 365 Defender can help you track and respond to emerging threats with threat analytics. Our Threat Intelligence team has published a new Threat analytics report, shortly following the discovery of this new cyber attack. This report is being constantly updated as the investigations and analysis unfold.

The threat analytics report includes deep-dive analysis, MITRE techniques, detection details, recommended mitigations, updated list of indicators of compromise (IOCs), and advanced hunting queries that expand detection coverage.

Given the high profile of this threat, we have made sure that all our customers, E5 and E3 alike, can access and use this important information.

If you’re an E5 customer, you can use threat analytics to view your organization’s state relevant to this attack and help with the following security operation tasks:

  • Monitor related incidents and alerts
  • Handle impacted assets
  • Track mitigations and their status, with options to investigate further and remediate weaknesses using threat and vulnerability management.

For guidance on how to read the report, see Understand the analyst report section in threat analytics.

TA blog.png

Read the Solorigate supply chain attack threat analytics report:

For our E3 customers, you can read similar relevant Microsoft threat intelligence data, including the updated list of IOCs, through the MSRC blog. Monitor the blog, Customer Guidance on Recent Nation-State Cyber Attacks, where we share the latest details as the situation unfolds.

Announcing new Microsoft Information Protection capabilities to know and protect your sensitive data

Announcing new Microsoft Information Protection capabilities to know and protect your sensitive data

This article is contributed. See the original author and article here.

Microsoft Information Protection (MIP) is a built-in, intelligent, unified, and extensible solution to protect sensitive data in documents and emails across your organization. MIP provides a unified set of capabilities to know and protect your data and prevent data loss across Microsoft 365 apps (e.g., Word, PowerPoint, Excel, Outlook), services (e.g., Microsoft Teams, SharePoint, Exchange, Power BI), on-premises locations (e.g., SharePoint Server, on-premises files shares), devices, and third-party apps and services (e.g., Box and Dropbox).

We are excited to announce availability for new MIP capabilities:

  • General availability of Exact Data Match user interface in Microsoft 365 compliance center and configurable match
  • External sharing policies for Teams and SharePoint sites, in public preview
  • Customer key support for Teams, in public preview
  • Expansion of MIP sensitivity labels support to Power BI desktop application (PBIX), in public preview

Exact Data Match user interface in Microsoft 365 compliance center

The first step to effectively protect your data and prevent data loss is to understand what sensitive data resides in your organization. Foundational to Microsoft Information Protection are its classification capabilities—from out-of-the-box sensitive information types (SITs) to Exact Data Match (EDM). Out-of-box SITs use pattern matching to find the data that needs to be protected. Credit card numbers, account numbers, and Social Security Numbers are examples of data that can be detected using patterns. MIP offers 150+ out-of-the-box sensitive information types mapped to various regulations worldwide. EDM is a different approach. It is a classification method that enables you to create custom sensitive information types that use exact data values. Instead of matching on generic patterns, EDM finds exact matches of data to protect the most sensitive data in your organization. You start by configuring the EDM custom SIT and uploading a CSV table of the specific data to be protected, which might include employee, patient, or other customer-specific information. You can then use the EDM custom SIT with policies, such as Data Loss Prevention (DLP), to protect your sensitive data. EDM nearly eliminates false positives, as the service compares the data being copied or shared with the data uploaded for protection.

We continue to invest in and enhance our EDM service, increasing its service scale by a factor of 10 to support data files containing up to 100 M rows, while decreasing by 50% the time it takes for your data to be uploaded and indexed in our EDM cloud service. To better protect sensitive data uploaded into our EDM service, we added salting to the hashing process, which adds additional protection for the data while in transit and within the cloud repository. You can learn more about these EDM enhancements and details on how to implement in this three-part blog series.

Today we are announcing general availability of a user interface in the Microsoft 365 compliance center to configure and manage EDM in the portal, in addition to the option of using PowerShell. This allows customers who are unable to use PowerShell or prefer to use the UI to manage EDM. Learn more here.


 MIP EDM schema.gif


                                            Figure 1: Details of an Exact Data Match schema

We are also announcing general availability of configurable match (aka normalization). This feature will add additional flexibility in defining the matches, allowing you to protect your confidential and sensitive data more broadly. For example, you can elect to ignore case so customer email address will match whether it is capitalized or not. Similarly, you can choose to ignore punctuation such as spaces or dashes in the data such as for social security number. Learn more here.

 External sharing policies for Teams and SharePoint sites

Core to Microsoft Information Protection are sensitivity labels. You can apply your sensitivity labels to not only protect document and emails but also to protect entire Teams and sites. In spring, we enabled you to apply a sensitivity label to a Team or site and associate that label with policies related to privacy and device access. This allows for holistically securing sensitive content whether it is in a file or in a chat by managing access to a specific team or site. Along with manual and auto-labeling of documents on SharePoint and Teams, this capability helps you scale your data protection program to manage the proliferation of data and the challenge of secure collaboration while working remotely.

We are pleased to announce that you can now also associate external sharing policies with labels to achieve secure external collaboration. This capability is in public preview. Administrators can tailor the external sharing settings according to the sensitivity of the data and business needs. For example, for ‘Confidential’ label you may choose to block external sharing whereas for ‘General’ label you may allow it.  Users then simply select the appropriate sensitivity label while creating a SharePoint site or Team and the appropriate external sharing policy for SharePoint content is automatically applied. It is common for projects at an organization to involve collaboration across employees, vendors, and partners. This capability further helps ensure only authorized users can get access to sensitive data in Teams and SharePoint sites.

 MIP external sharing.gif

Figure 2: External sharing policies available alongside policy for unmanaged device access

Customer Key support for Teams

Microsoft 365 provides customer data protection at multiple layers, starting with volume-level encryption enabled through BitLocker, and then there is protection at the application layer. We offer Customer Key, so you can control a layer of encryption for your data in Microsoft’s data centers, with your own keys. This also enables you to meet requirements of compliance regulations for controlling your own keys.

Customer Key was already available for SharePoint, OneDrive, and Exchange. Today, we are pleased to announce that Customer Key is available in Public Preview for Microsoft Teams. You can now assign a single data encryption policy at the tenant level to encrypt your data-at-rest in Teams and Exchange. Click here to learn more.

Sensitivity labels in Power BI desktop

In June we announced general availability of MIP sensitivity labels in Power BI service, helping organizations classify and protect sensitive data even as it is exported from Power BI to Excel, PowerPoint and PDF files, all this without compromising user productivity or collaboration.

We’re now expanding MIP sensitivity labels support to Power BI desktop application (PBIX), in public preview, to enable content creators to classify and protect sensitive PBIX files while authoring datasets and reports in Power BI desktop. The label applied on PBIX files persist when uploaded to Power BI service. Learn more here.

MIP Contoso Power BI.gif

Figure 3: Sensitive built-in label experience in Power BI Desktop

We are also announcing the availability of a new API that enables administrators to get information on sensitivity labels applied to content in Power BI service. With this information, Power BI and Compliance admins can answer questions like which workspaces in Power BI service have reports with a specific label. Learn more here.

Data is the currency of today’s economy. Data is being created faster than ever in more locations than organizations can track. To secure your data and meet compliance requirements like the General Data Protection Requirement (GDPR) – you need to know what data you have, where it resides, and have capabilities to protect it. The above new capabilities are part of the built-in, intelligent, unified, and extensible solution that Microsoft Information Protection offers to enable both administrators and users to protect organization data while staying productive.

Getting Started

Here’s information on licensing and on how to get started with the capabilities announced today:

Maithili Dandige, Principal Group Program Manager

Microsoft Cloud App Security (MCAS) Activity Log in Azure Sentinel

Microsoft Cloud App Security (MCAS) Activity Log in Azure Sentinel

This article is contributed. See the original author and article here.

Overview

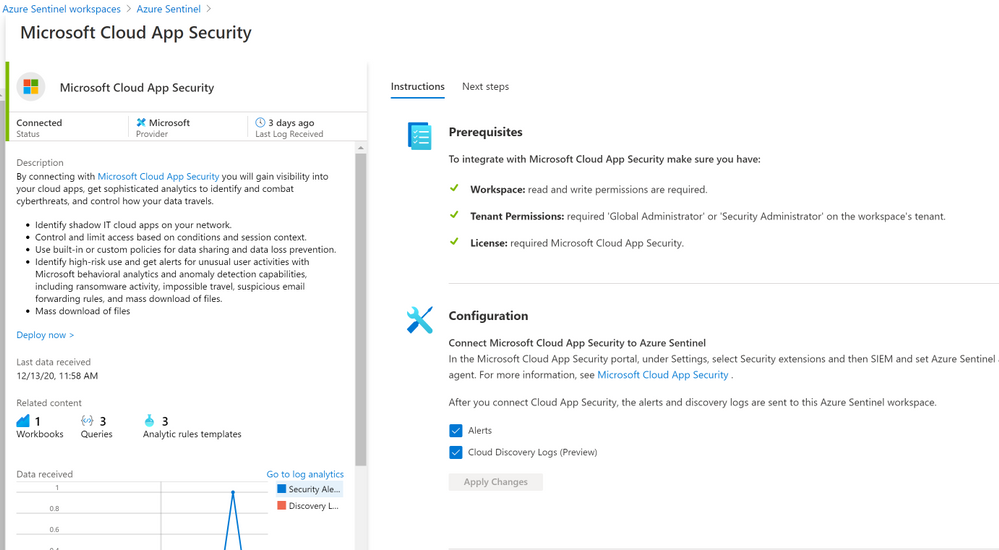
The Microsoft Cloud App Security (MCAS) connector lets you stream alerts and Cloud Discovery logs from MCAS into Azure Sentinel. This will enable you to gain visibility into your cloud apps, get sophisticated analytics to identify and combat cyberthreats, and control how your data travels, more details on enabling and configuring the out of the box MCAS connector (Connect data from Microsoft Cloud App Security)

MCAS3.PNG

Cloud App Security REST API (URL Structure , Token & Supported Actions)

The Microsoft Cloud App Security API provides programmatic access to Cloud App Security through REST API endpoints. Applications can use the API to perform read and update operations on Cloud App Security data and objects.

To use the Cloud App Security API, you must first obtain the API URL from your tenant. The API URL uses the following format:

https://<portal_url>/api/<endpoint>

To obtain the Cloud App Security portal URL for your tenant, do the following steps:

– In the Cloud App Security portal, click the question mark icon in the menu bar. Then, select About.

MCAS1.PNG – In the Cloud App Security about screen, you can see the portal url.

MCAS2.PNG

Once you have the portal url, add the /api suffix to it to obtain your API URL. For example, if your portal’s URL is https://m365x933168.eu2.portal.cloudappsecurity.com, then your API URL is https://m365x933168.eu2.portal.cloudappsecurity.com/api.

Cloud App Security requires an API token in the header of all API requests to the server, such as the following:

Authorization: Token <your_token_key>

Where <your_token_key> is your personal API token. For more information about API tokens, see Managing API tokens., here’s an example of CURLing MCAS Activity log:

MCAS4.PNG

The following table describes the actions supported:

MCAS5.PNG

Where Resource represents a group of related entities, fore more details please visit MCAS Activities API

Implementation (MCAS Activity Connector)

  • Log in to the Azure tenant, http://portal.azure.com
  • Go to Azure Sentinel > Playbooks
  • Create a new Playbook and follow the below gif / step-by-step guide, the code being uploaded to github repo as well:
    • Add a “Recurrence” step and set the following field, below is an example to trigger the Playbook once a daily basis:
      • Interval: 1
      • Frequency: Day
    • Initialize a variable for the MCAS API Token value, make sure to generate MCAS API Token following this guide
      • Name: MCAS_API_Token
      • Type: String
      • Value: Token QhXXXXBSlodAV9AXXXXXXQlMcFhweXXXXXRXXh1OGkXXkXXkeX
    • Set an HTTP endpoints to Get MCAS Activity data:
    • Parse MCAS Activities data via Json:
      • Parse JSON – MCAS Activities:
        • Content: @{body(‘HTTP_-_MCAS_Activities_API’)}
        • Schema: uploaded to github
    • Initialize an Array Variable:
      • Name: TempArrayVar
      • Type: Array
    • Append to array variable:
      • Name: TempArrayVar
      • Value: @{body(‘Parse_JSON_-_MCAS_Activities’)}
    • Add For each control to iterate MCAS Activities parsed items:
      • Select an output from previous steps: @variables(‘TempArrayVar’)
      • Send the data (MCAS Activity Log) to Azure Sentinel Log analytics workspace via a custom log tables:
        • JSON Request body: @{items(‘For_each’)}
        • Custom Log Name: MCAS_Activity_Log

MCASActivitySentinel.gif

Notes & Consideration

  • You can customize the parser at the connector’s flow with the required and needed attributed / fields based on your schema / payload before the ingestion process, also you can create custom Azure Functions once the data being ingested to Azure Sentinel
  • You can customize the for-each step to iterate MCAS Activity log and send them to the Log Analytics workspace so eventually each activity log will be logged in a separate table’s record / row
  • You can build your own detection and analytics rules / use cases,  a couple of MCAS Activities analytics rules will be ready to use at github, stay tuned
  • Couple of points to be considered while using Logic Apps:

Get started today!

We encourage you to try it now!

You can also contribute new connectors, workbooks, analytics and more in Azure Sentinel. Get started now by joining the Azure Sentinel Threat Hunters GitHub community.

Announcing two new Microsoft Dynamics 365 Fundamentals certifications!

Announcing two new Microsoft Dynamics 365 Fundamentals certifications!

This article is contributed. See the original author and article here.

People in many different roles and at various stages in their careers can all benefit from the two new fundamentals certifications being added to the Microsoft training and certification portfolio: Microsoft Certified: Dynamics 365 Fundamentals Customer Engagement Apps (CRM) and Microsoft Certified: Dynamics 365 Fundamentals Finance and Operations Apps (ERP). With more and more businesses using Microsoft Dynamics 365, and a growing need for people skilled in using it to help take advantage of its potential, the opportunities for people who can demonstrate their skill with certification are also increasing. See if these two new certifications can help you advance your career.

Microsoft Certified: Dynamics 365 Fundamentals Customer Engagement Apps (CRM)

The training for this certification gives you a broad understanding of the customer engagement capabilities of Dynamics 365. It covers the specific capabilities, apps, components, and life cycles of Dynamics 365 Marketing, Sales, Customer Service, Field Service, and Project Operations, and also the features they share, such as common customer engagement features, reporting capabilities, and integration options. Exam MB-910: Dynamics 365 Fundamentals: Customer Engagement apps (CRM), which you must pass to earn this certification, measures skills in these areas. There are no prerequisites for this certification.

Is this certification right for you?

If you want to gain broad exposure to the customer engagement capabilities of Dynamics 365, and you’re familiar with business operations and IT savvy—with either general knowledge or work experience in information technology (IT) and customer relationship management (CRM)—this certification is for you.  Acquiring these skills and getting certified to validate them can help you advance, no matter where you are in your career or what your role is. Here are just a few examples of who can benefit from this certification:

  • IT professionals who want to show a general understanding of the applications they work with
  • Business stakeholders or people who use Dynamics 365 and want to validate their skills and experience.
  • Developers who want to highlight their understanding of business operations and CRM.
  • Student, recent graduates, or people changing careers who want to leverage Dynamics 365 customer engagement capabilities to move to the next level.

Microsoft Certified: Dynamics 365 Fundamentals Finance and Operations Apps (ERP)

The training for this certification covers the capabilities, strategies, and components of these finance and operations areas: Supply Chain Management, Finance, Commerce, Human Resources, Project Operations, and Business Central, along with their shared features, such as reporting capabilities and integration options. Exam-MB-920: Dynamics 365 Fundamentals: Finance and Operations apps (ERP), which you must pass to earn this certification, measures skills in these areas. There are no prerequisites for this certification.

Is this certification for you?

If you’re looking for broad exposure to the enterprise resource planning (ERP) capabilities of Dynamics 365 and a better understanding of how finance and operations apps fit within the Microsoft ecosystem—and how to put them to work in an organization—this certification is for you. People who are familiar with business operations, have a fundamental understanding of financial principles, and are IT savvy—with either general knowledge or work experience in IT and the basics of ERP—are good candidates for this certification.

By earning this fundamentals certification, you will gain the skills to solve ERP problems and you can validate those skills to current or potential employers, helping to open career doors. If one of the following groups describes you, earning this certification can benefit you.

  • IT professionals who want to highlight their broad understanding of the applications they work with
  • Technical professionals and business decision makers who are exploring how Dynamics 365 functionality can integrate with apps they’re using.
  • Business stakeholders and others who use Dynamics 365 and want to learn more.
  • Developers who want to show a deeper understanding of business operations, finance, and ERP.
  • Students, recent graduates, and people changing careers who want to leverage Dynamics 365 finance and operations apps to move to the next level.

 Exam MB-901 is being retired

The two exams associated with these new certifications, Exam MB-910 and MB-920, are replacing Exam MB-901: Microsoft Dynamics Fundamentals. Exam MB-901 will expire on June 30, 2021. After that date, it will no longer be available for you to take – only MB-910 and MB-920 will be – so if you’re currently preparing for MB-901, make sure you take and pass that exam before June 30, 2021.

Explore these two new fundamentals certifications and other Dynamics 365 and Microsoft Power Platform fundamentals certifications. While you’re looking for ways to build and validate skills to stay current and enhance your career, why not browse the 16 Dynamics 365 and Microsoft Power Platform role-based certifications too? Find a training and certification that’s a perfect match for where you are now.

HOW TO AUTHOR SCCM REPORTS LIKE A SUPERHERO

HOW TO AUTHOR SCCM REPORTS LIKE A SUPERHERO

This article is contributed. See the original author and article here.

Hi there, I am Matt Balzan, and I am a Microsoft Modern Workplace Customer Engineer who specializes in SCCM, APP-V and SSRS/PowerBI reporting.

Today I am going to show you how to write up SQL queries, then use them in SSRS to push out beautiful dashboards, good enough to send to your boss and hopefully win that promotion you’ve been gambling on!

INGREDIENTS

  • Microsoft SQL Server Management Studio (download from here)
  • A SQL query
  • Report Builder
  • Your brain

Now that you have checked all the above, let us first go down memory lane and do a recap on SQL.

WHAT EXACTLY IS SQL?

SQL (Structured Query Language) is a standard language created in the early 70s for storing, manipulating and retrieving data in databases.

Does this mean that if I have a database with data stored in it, I can use the SQL [or T-SQL] language to grab the data based on conditions and filters I apply to it?   Yep, you sure can!

A database is made up of tables and views and many more items but to keep things simple we are only interested in the tables and views.

DB-BLOG.png

Your table/view will contain columns with headers and in the rows is where all the data is stored.

ROWS-BLOG.png

The rows are made up of these columns which contain cells of data. Each cell can be designed to have text, datetime, integers. Some cells can have no values (or NULL values) and some are mandatory to have data in them. These settings are usual setup by the database developer. But thankfully, for reporting we need not worry about this. What we need is data for our reports, and to look for data, we use t-SQL!

But wait! – I have seen these queries on the web, and they all look double-Dutch to me!

No need to worry, I will show you how to read these bad boys with ease!

ANATOMY OF A SQL QUERY

We have all been there before, someone sent you a SQL query snippet or you were browsing for a specific SQL query and you wasted the whole day trying to decipher the darn thing!

Here is one just for simplicity:

select Name0,Operating_System_Name_and0 from v_R_System where Operating_System_Name_and0 like ‘%server%’

My quick trick here is to go to an online SQL formatter, there are many of these sites but I find this one to be perfect for the job: https://sql-format.com/

Simply paste the code in and press the FORMAT button and BOOM!

query.png

Wow, what a difference!!! Now that all the syntax has been highlighted and arranged, copy the script, open SSMS, click New Query, paste the script in it and press F5 to execute the query.

This is what happens:

ANATOMY-BLOG.png

  1. The SELECT command tells the query to grab data, however in this case it will only display 2 columns (use asterisk * to get all the columns in the view)
  2. FROM the v_R_System view
  3. WHERE the column name contains the keyword called server using the LIKE operator (the % tells the filter to bring back zero, one, or multiple characters)
  4. The rows of data are then returned in the Results pane. In this example only all the server names are returned.

 TIPS!

Try to keep all the commands in CAPITALS – this is good practice and helps make the code stand out for easier reading!

ALWAYS use single quotes for anything you are directing SQL to. One common mistake is to use code copied from the browser or emails which have different font types. Paste your code in Notepad and then copy them out after.

Here is another example:   Grab all the rows of data and all the columns from the v_Collections view.

SELECT * FROM v_Collections

The asterisk * means give me every man and his dog. (Please be mindful when using this on huge databases as the query could impact SQL performance!)

Sometimes you need data from different views. This query contains a JOIN of two views:

SELECT vc.CollectionName

,vc.MemberCount

FROM v_Collections AS vc

INNER JOIN v_Collections_G AS cg ON cg.CollectionID = vc.CollectionID

WHERE vc.CollectionName LIKE%desktop%

ORDER BY vc.CollectionName DESC

OK, so here is the above query breakdown:

  1. Grab only the data in the column called vc.CollectionName and vc.MemberCount from the v_Collections view
  2. But first JOIN the view v_Collections_G using the common column CollectionID (this is the relating column that both views have!)
  3. HOWEVER, only filter the data that has the word ‘desktop‘ in the CollectionName column.
  4. Finally, order the list of collection names in descending order.

SIDE NOTE: The command AS is used to create an alias of a table, view or column name – this can be anything but generally admin folk use acronyms of the names (example: v_collections will be vc) – Also noteworthy, is that when you JOIN tables or VIEWS you will need to create the aliases, they probably might have the same column names, so the alias also solves the problem of getting all of the joined columns mixed up.

T-SQL reference guide: https://docs.microsoft.com/en-us/sql/t-sql/language-reference?view=sql-server-ver15

OK, SO WHAT MAKES A GOOD REPORT?

It needs the following:

  • A script that runs efficiently and does not impact the SQL server performance.
  • The script needs to be written so that if you decide to leave the place where you work, others can understand and follow it!
  • Finally, it needs to make sense to the audience who is going to view it – Try not to over engineer it – keep it simple, short and sweet.

SCENARIO: My customer wants to have a Task Sequence report which contains their company logo, the task sequence steps and output result for each step that is run, showing the last step run.

In my lab I will use the following scripts. The first one is the main one, it will join the v_r_System view to the vSMS_TaskSequenceExecutionStatus view so that I can grab the task sequence data and the name of the device.

SELECT vrs.Name0

,[PackageID]

,[AdvertisementID]

,vrs.ResourceID

,[ExecutionTime]

,[Step]

,[GroupName]

,[ActionName]

,[LastStatusMsgID]

,[LastStatusMsgName]

,[ExitCode]

,[ActionOutput]

FROM [vSMS_TaskSequenceExecutionStatus] AS vtse

JOIN v_R_System AS vrs ON vrs.ResourceID = vtse.ResourceID

WHERE AdvertisementID = @ADVERTID

ORDER BY ExecutionTime DESC

The second script is for the @ADVERTID parameter – When the report is launched, the user will be prompted to choose a task sequence which has been deployed to a collection. This @ADVERTID parameter gets passed to the first script, which in turn runs the query to grab all the task sequence data rows.

Also highlighted below, the second script concatenates the column name pkg.Name (this is the name of the Task Seq) with the word ‘ to ‘ and also with the column name col.Name (this is the name of the Collection), then it binds it altogether as a new column called AdvertisementName.

So, for example purposes, the output will be: INSTALL SERVER APPS to ALL DESKTOPS AND SERVERS – this is great, as we now know which task sequence is being deployed to what collection!

SELECT DISTINCT

adv.AdvertisementID,

col.Name AS Collection,

pkg.Name AS Name,

pkg.Name + ‘ to ‘ + col.Name AS AdvertismentName

FROM v_Advertisement adv

JOIN (SELECT

PackageID,

Name

FROM v_Package) AS pkg

ON pkg.PackageID = adv.PackageID

JOIN v_TaskExecutionStatus ts

ON adv.AdvertisementID = (SELECT TOP 1 AdvertisementID

  FROM v_TaskExecutionStatus

  WHERE AdvertisementID = adv.AdvertisementID)

JOIN v_Collection col

ON adv.CollectionID = col.CollectionID

ORDER BY Name

LET US BEGIN BY CREATING THE REPORT

  1. Open Microsoft Endpoint Configuration Manager Console and click on the Monitoring workspace.
  2. Right-click on REPORTS then click Create Report.
  3. Type in the name field – I used TASK SEQUENCE REPORT
  4. Type in the path field – I created a folder called _MATT (this way it sits right at the top of the folder list)
  5. Click Next and then Close – now the Report Builder will automatically launch.
  6. Click Run on the Report Builder popup and wait for the UI to launch. This is what it looks like:

REPORT-BUILDER-BLOG.png

STEP 1 – ADD THE DATA SOURCE

 ADD-DS-BLOG.gif

To get the data for our report, we need to make a connection to the server data source.

Right-click on Data Sources / Click Add Data Source… / Click Browse… / Click on Configmr_<yoursitecode> / Scroll down to the GUID starting with {5C63 and double-click it / Click Test Connection / Click OK and OK.

STEP 2 – ADD THE SQL QUERIES TO THEIR DATASETS

ADD-DATASETS-BLOG.gif

Copy your scripts / Right-click on Datasets / click on Add Dataset… / Type in the name of your dataset (no spaces allowed) / Select the radio button ‘Use a dataset embedded in my report’ / Choose your data source that was added in the previous step / Paste your copied script in the Query window and click OK / Click the radio button ‘Use the current Window user’ and click OK.

STEP 3 – ADJUST THE PARAMETER PROPERTIES

PARAMS-PROPS-GEN-BLOG.png


Expand the Parameters folder / Right-click the parameter ADVERTID / Select the General tab, under the Prompt: field type DEPLOYMENT – leave all the other settings as they are.

PARAMS-PROPS-BLOG.png


Click on Available Values / Click the radio button ‘Get values from a query’ / for Dataset: choose ADVERTS, for Value field choose AdvertisementID and for Label field choose AdvertisementName / Click OK.

Now when the report first runs, the parameter properties will prompt the user with the DEPLOYMENT label and grab the results of the ADVERTS query – this will appear on the top of the report and look like this (remember the concatenated column?):

DeploymentLabel.png

OK cool – but we are not done yet. Now for the fun part – adding content!

STEP 4 – ADDING A TITLE / LOGO / TABLE

ADD-TITLE-BLOG.gif

Click the label to edit your title / change the font to SEGOE UI then move its position to the centre / Adjust some canvas space then remove the [&ExecutionTime] field.


ADD-LOGO-BLOG.gif

From the ribbon Insert tab / click Image, find a space on your canvas then drag-click an area / Click Import…, choose ALL files (*.*) image types then find and add your logo / Click OK.

 ADD-TABLE-BLOG.gif

Next click on Table, choose Table Wizard… / Select the TASKSEQ dataset and click Next / Hold down shift key and select all the fields except PackageID, AdvertisementID & ResourceID.

Drag the highlighted fields to the Values box and click Next / Click Next to skip the layout options / Now choose the Generic style and click Finish.

Drag the table under the logo.

STEP 5 – SPIT POLISHING YOUR REPORT

TS-SPITPOLISH-BLOG.png

A Placeholder is a field where you can apply an expression for labels or text, you wish to show in your report.

In my example, I would like to show the Deployment name which is next to the Task Sequence title:

ADD-PLACEHOLDER-BLOG.gif

In the title text box, right-click at the end of the text TASK SEQUENCE: / Click Create Placeholder… / under Value: click on the fx button / click on Datasets / Click on ADVERTS and choose First(AdvertisementName).

Finally, I wanted the value in UPPERCASE and bold. To do this I changed the text value to: =UCASE(First(Fields!AdvertisementName.Value, “ADVERTS”)) , click on OK.

I then selected the <<Expr>> and changed the font to BOLD.

Do not forget to save your report into your folder of choice!

Once you have finished all the above settings and tweaks, you should be good to run the report. Click the Run button from the top left corner in the Home ribbon.

If you followed all the above step by step, you should have now a report fit for your business – this is the output after a Deployment has been selected from the combo list:

FINAL-REPORT-BLOG.png

  • To test the Action Output column, I created a task sequence where I intentionally left some errors in the Run Command Line steps, just to show errors and draw out some detail.
  • To avoid massive row height sizes, I set the cell for this column to font size 8.
  • To give it that Azure report style look and feel, I only set the second row in the table with the top border being set. You can change this to your own specification.

Please feel free to download my report RDL file as a reference guide (Attachment on the bottom of this page)

 LESSONS LEARNED FROM THE FIELD

  • Best advice I give to my customers is to start by creating a storyboard. Draw it out on a sheet of blank or grid paper which gives you an idea where to begin.
  • What data do you need to monitor or report on?
  • How long do these scripts take to run? Test them in SQL SERVER MANAGEMENT STUDIO and note the time in the Results pane.
  • Use the free online SQL formatting tools to create proper readable SQL queries for the rest of the world to understand!
  • Who will have access to these reports? Ensure proper RBAC is in place.
  • What is the target audience? You need to keep in mind some people will not understand the technology of the data.

COMING NEXT TIME…

My next blog will go into a deep dive in report design. I will show you how to manipulate content based on values using expressions, conditional formatting, design tips, best practices and much more….Thanks for reading, keep smiling and stay safe!

DISCLAIMER

The sample files are not supported under any Microsoft standard support program or service. The sample files are provided AS IS without warranty of any kind. Microsoft further disclaims all implied warranties including, without limitation, any implied warranties of merchantability or of fitness for a particular purpose. The entire risk arising out of the use or performance of the sample files and documentation remains with you. In no event shall Microsoft, its authors, or anyone else involved in the creation, production, or delivery of the files be liable for any damages whatsoever (including, without limitation, damages for loss of business profits, business interruption, loss of business information, or other pecuniary loss) arising out of the use of or inability to use the sample scripts or documentation, even if Microsoft has been advised of the possibility of such damages.

Matt Balzan | Modern Workplace Customer Engineer | SCCM, Application Virtualisation, SSRS / PowerBI Reporting