This article is contributed. See the original author and article here.
Managers everywhere are struggling to find solutions to building trust, teamwork, and improving morale within their organization. Many are turning to games for help.
This article is contributed. See the original author and article here.
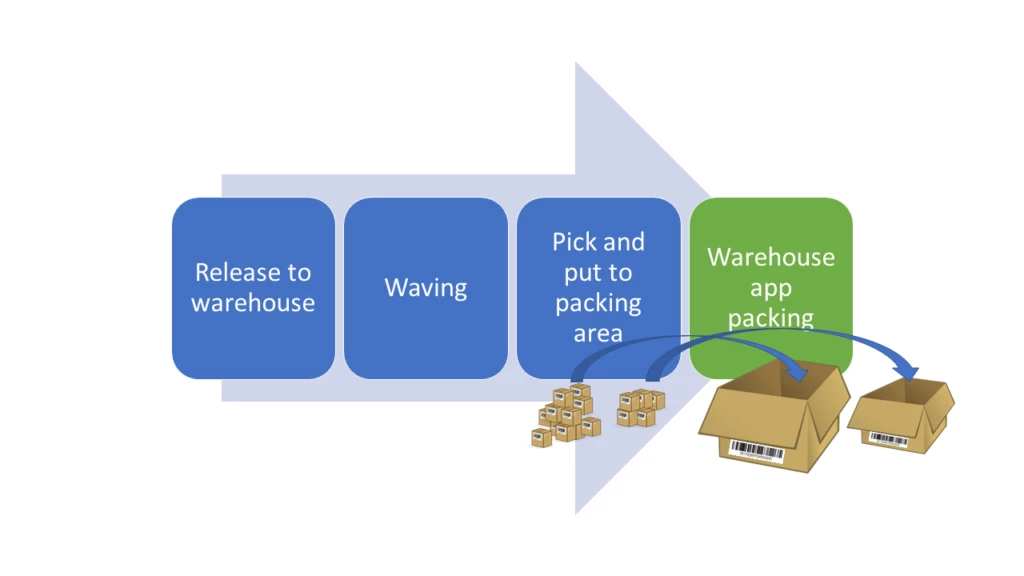
Traditionally, warehouse workers pack items for shipment at a specific packing station, using a process that’s optimized to ship small and medium-sized parcels. To improve packing efficiency when working in larger areas and with larger items, the Warehouse Management mobile app in Microsoft Dynamics 365 Supply Chain Management now provides a mobile packing experience that gives workers the freedom to move around while performing packing activities.
Flexibility improves packing efficiency
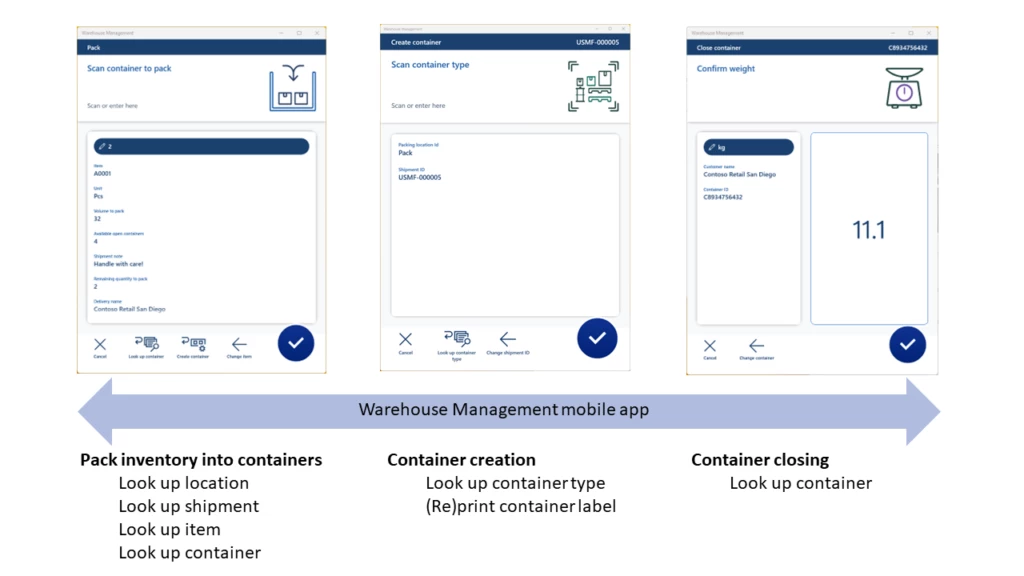
The packing flow in the Warehouse Management mobile app includes three main processes:
Identifying the items to pack
Creating and identifying the containers to pack the items into
Closing the containers to finalize the packing process
To provide for more flexibility, you can easily embed the container creation and closing processes in any packing operation step using a detour. The same applies to look-up requirements (for example, when not able to scan an item barcode label) by querying data using mobile app detours.
To improve packing efficiency even more, you can configure the packing process to automatically print a container label from the mobile app. Workers can apply the label to the container to ease the packing validation process when they are packing items into the container.
This article is contributed. See the original author and article here.
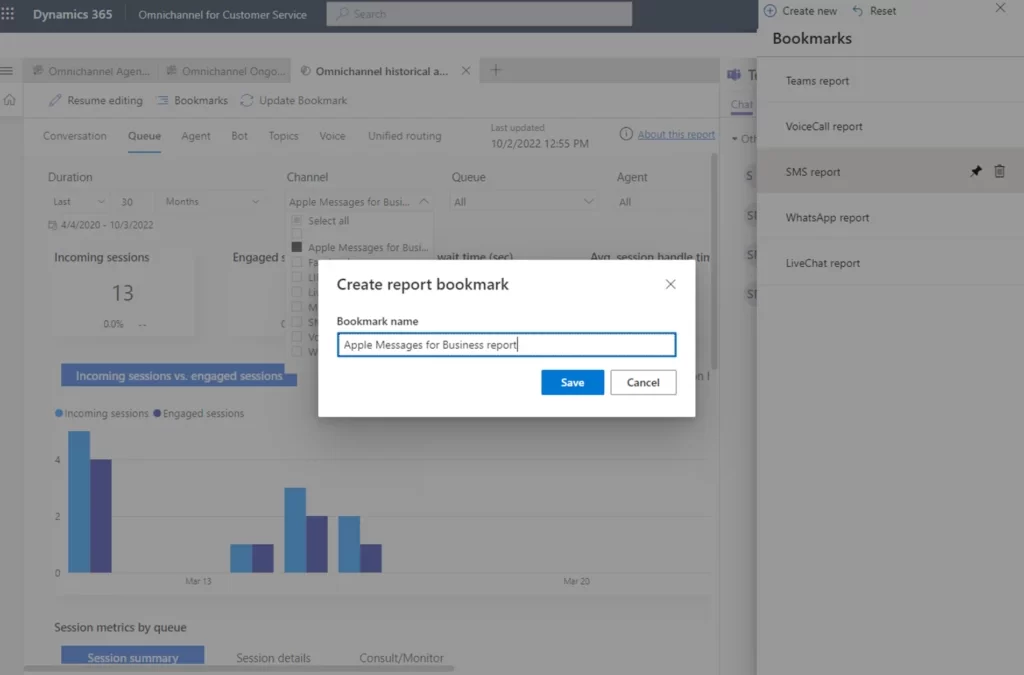
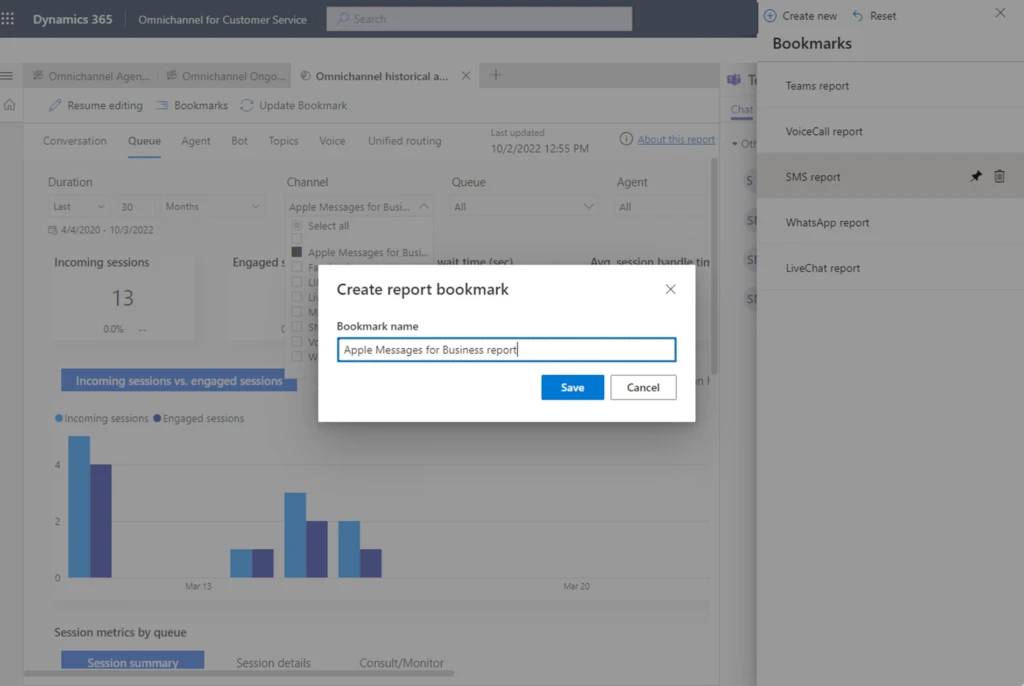
With Microsoft Dynamics 365 Customer Service 2022 release wave 2, we’ve supercharged the humble bookmark. Now you can save views as report bookmarks. Get back to your personalized, filtered reports faster than a speeding bullet, no cape needed.
Leap tall buildings in a single bound
You likely have at least one dashboard you visit regularly to monitor reports, charts, and other visual breakdowns of your Customer Service KPIs and insights. Chances are, you apply the same filters every time you visit.
Stop wasting all that effort. Adjust the report filters as you likejust onceand save the filtered view as a named bookmark.
The next time you want to check that same view, let your report bookmark do the heavy lifting. With a single bounder, click, the dashboard opens just the way you want it to.
Manage your report bookmarks just as easily
After you’ve created some report bookmarks, you won’t need abilities far beyond those of mortal men to keep them up to date. Need to change a filter value or add a whole new filter? No problem. Adjust the report filters to your liking, then select Bookmarks > Update Bookmark. If you don’t want to keep the change, one click resets everything back to the way it was. It’s that easy. If you no longer need a bookmark, delete it.
It’s just as easy to switch between your saved views using the new Bookmarks panel. You can even set a report bookmark as your personal default view every time you visit.
Bookmarks are available in historical analytics reports and knowledge analytics reports.
We plan to add more features, like bookmark groups, the ability to create a slideshow out of your bookmarks, and more. Stay tuned for the next exciting chapter!
This article is contributed. See the original author and article here.
In today’s business environment, efficiency is paramount for seller productivity. Sales teams must achieve more with less. Sellers are looking for tools to reduce the time-stealing work that gets in the way of engaging with customers. They need to keep focused and move from one call to the next with ease. Now Microsoft Dynamics 365 Sales can help. We are delighted to announce the general availability of the embedded Teams phone dialer to support outbound and inbound calls. The new phone dialer even automates note capture, improving data quality and ensuring sellers don’t miss a follow-up action. Sellers can take this a step further with optional conversation intelligence to get AI-generated analytics, meeting summaries, and follow-up actions.
Seller productivity benefits from an embedded Teams dialer
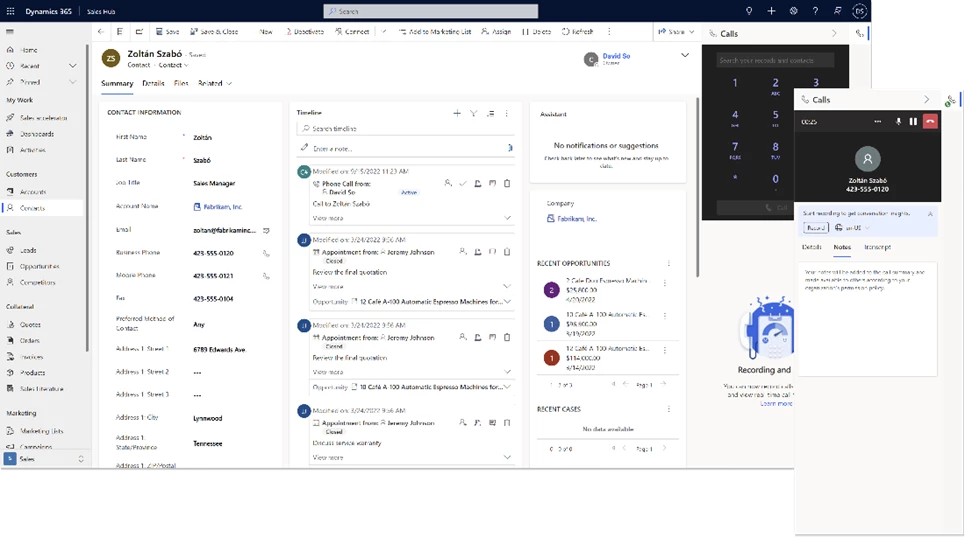
Sellers build customer relationships by capturing every nugget of insight they can from a call. With the embedded Teams dialer for Dynamics 365, sellers can make phone calls using the dial pad in the side panel or by selecting a phone number anywhere in Dynamics 365.
Digital selling teams using the sales accelerator can view all their upcoming actions and suggestions. Now they can easily call prospects from the same screen. Results are automatically tracked and summarized in the timeline, reducing the need for manual data input after each call.
The embedded dialing feature uses your organization’s existing Teams telephony service, supporting either a Teams call plan, direct routing, or operator connect.
Get real-time assistance from conversation intelligence
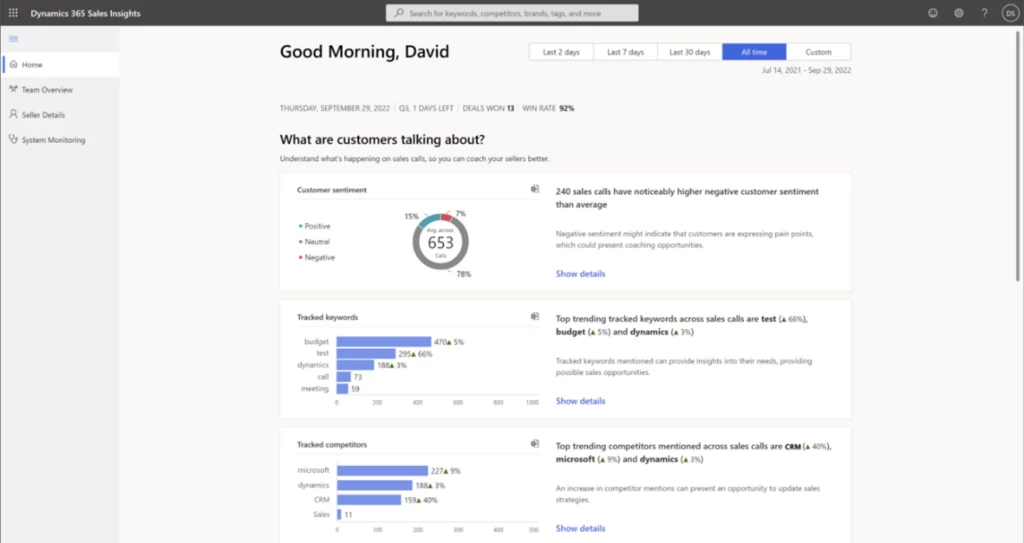
With Dynamics 365 AI-powered conversation intelligence, sellers get real-time assistance during sales calls. They can focus on building relationships and forget about forgetting. Sellers and managers can view aggregate statistics across the team. Reports highlight customer trends, help them understand the competition, and provide insights to coach sellers on best practices.
Let’s look at the capabilities and options available to help sellers stay focused on their best next actions.
Connect with customers right in Dynamics 365
With the Microsoft Teams dialer for Dynamics 365, sellers are more focused and efficient. Calling a customer is simple. Sellers can use any phone number recorded in Dynamics 365 to place a call. A built-in search tool makes finding contacts easier. Call activity is automatically logged with all essential details, sparing them tedious manual entry after the call and immediately increasing seller productivity.
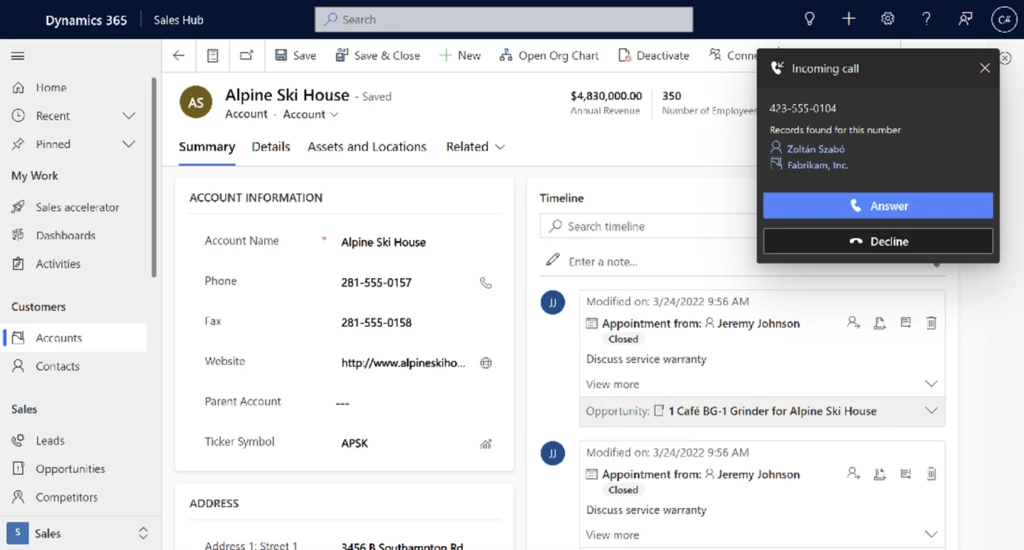
The embedded Teams dialer also supports incoming calls. When sellers receive a call, the dialer searches Dynamics 365 for a potential matching record. Sellers can quickly open the relevant record, review the information, and be ready to answer the call with maximum context. If the search returns multiple matches, sellers can review the options in the incoming call notification and select the right one. If there are no matches, sellers can manually associate the contact with a new record that’s created automatically.
On top of improving seller preparation before the call, we are also supporting sellers during their sales calls by including a built-in notepad in the embedded dialer. Sellers can take notes during their calls without having to navigate elsewhere. The notes are automatically saved to the phone call’s activity timeline.
Easily enable calls to boost your seller productivity
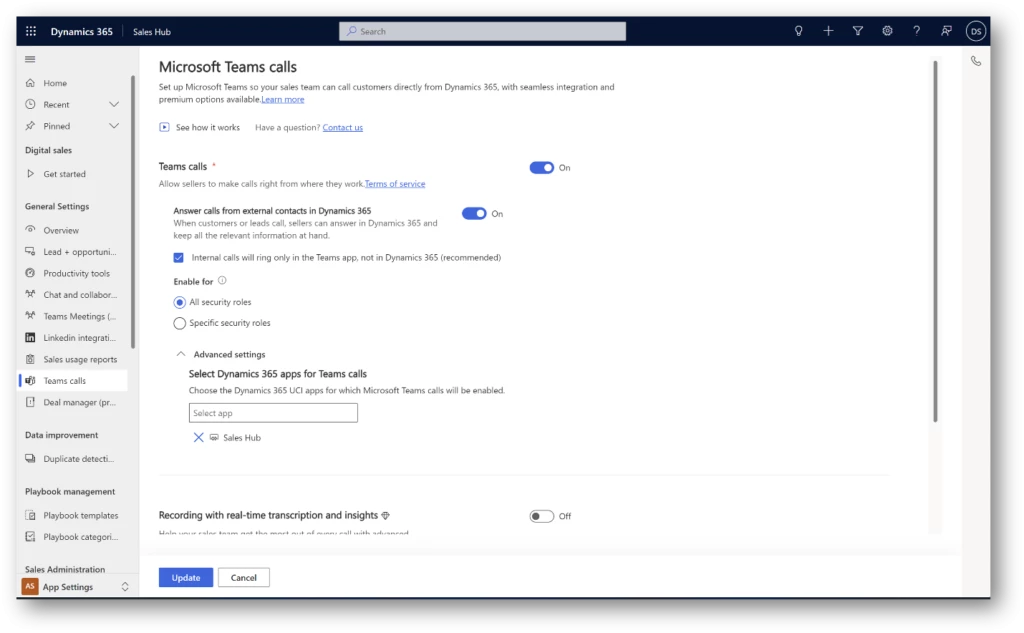
Setting up the dialer experience is easy. Settings control how you enable it, for what types of calls, where, and for which security roles. Configure what works best for your business needs.
For example, you can enable the dialer for outbound calls only or both inbound and outbound depending on your teams’ work habits. You can enable it for inbound calls from external numbers only to help your sellers focus on customer engagement when they are in the Dynamics 365 environment. By default, the dialer displays in the Sales Hub, our default sales experience optimized for sellers. However, the dialer also supports custom apps. You decide which security roles you’d like to enable the experience for, making sure access is available only to those who need it.
Supercharge seller productivity with conversation intelligence
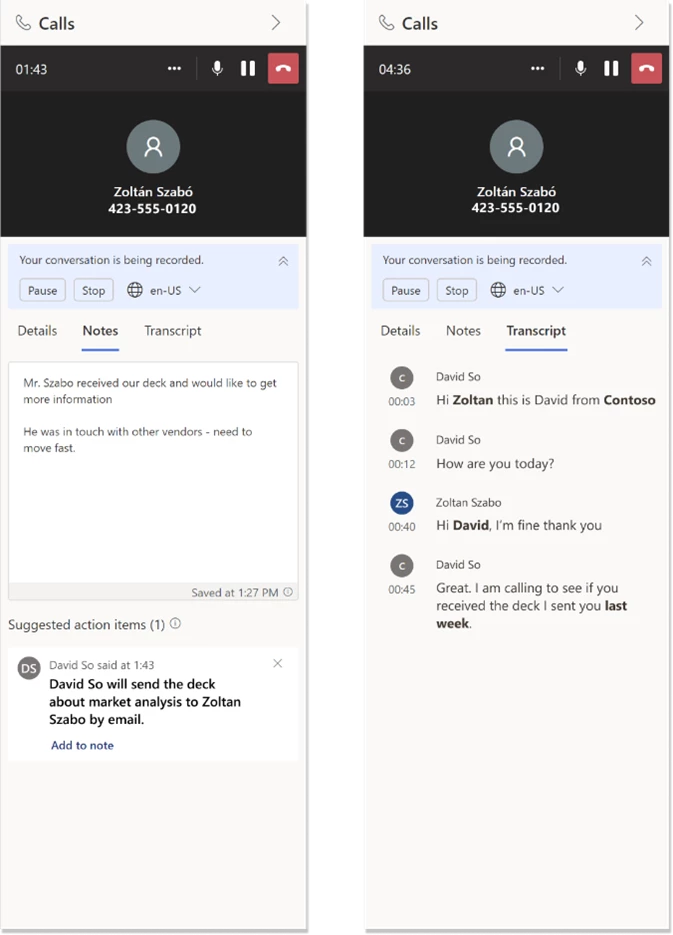
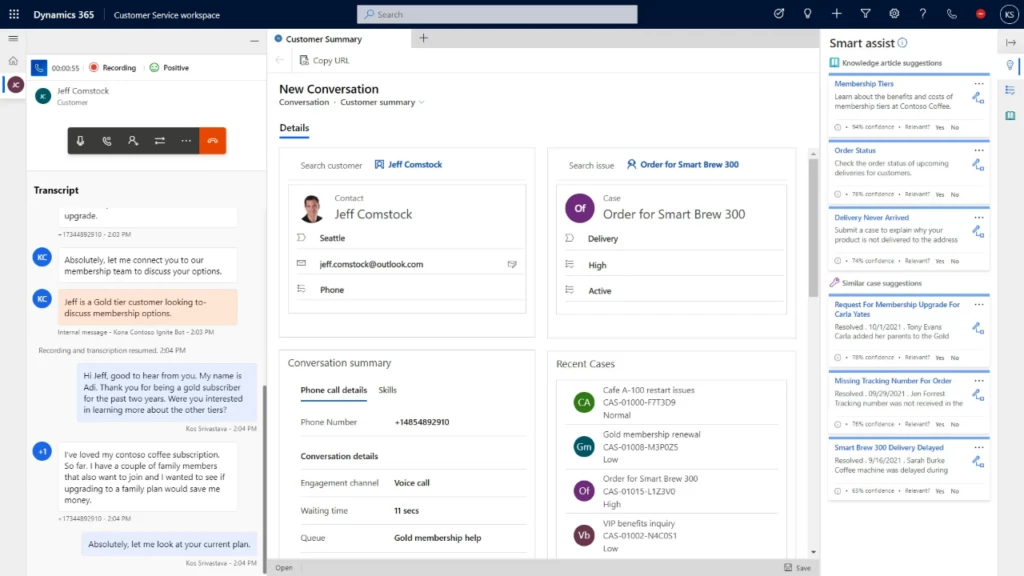
Seller productivity is at the core of a successful sales operation. With AI-powered conversation intelligence, sellers can focus on their conversations with customers, not on taking notes. With call recording enabled, conversation intelligence acts as an assistant right in the dialer’s side panel.
Sellers can view a real-time call transcription with business-critical insights such as key questions asked, detected action items, intelligent notes, and a call summary. The call summary provides a jump start to quality follow-up notes in the moment rather than piled up at the end of a week.
Managers have the tools they need to spot trends and better understand their customers and any patterns that need addressing.
Post-call analysis: Just a few seconds after a call ends, managers can access a rich call summary. The summary includes sentiment analysis, automatic call segmentation, call playback, and a transcript, where they can leave messages for their team members. Conversation intelligence also automatically tags calls, so managers know on which calls they should focus.
Better understand customers with advanced insights and interactions styles: Managers get a wide perspective of customers’ needs and interests in real time. They can use aggregated data to analyze market trends, rising competitors, and overall sentiment, and can dive into the details where needed.
Control conversation intelligence usage to support your sales team
We recognize that not all sales calls need to be treated equally. We made sure you can precisely control the usage of conversation intelligence capabilities across different locations and specialties.
For example, you can enable the capabilities based on security roles so that only the right people have access. Ensure compliance to any internal, external, or government policies by controlling:
whether calls are recorded
the way calls are recorded (manually or automatically)
who is being recorded (only sellers, or both sellers and customers)
where the analyzed data is stored
the data retention policy
You also control which languages are available for analysis. Decide the number of conversation intelligence processing hours available through the dialer experience to keep track of usage, spend, and adoption.
Help your sellers take back those lost hours of manual actions and keep on top of their growing customer relationships!
This article is contributed. See the original author and article here.
Since the November 2021 launch in select geographic regions of the native voice channel in Microsoft Dynamics 365 Customer Service, we have been expanding worldwide to satisfy growing customer demand. We are proud to announce that we now support local country regions as well. As of October 2022, the voice support channel is live in the United Kingdom.
Native voice support channel capabilities
The integrated voice channel allows customer service representatives to communicate with customers on the phone to resolve issues. The UK launch includes all the features that the voice channel in omnichannel Customer Service environments supports today.
Self-serve voice support channel with Power Virtual Agents
The UK general availability launch also integrates Power Virtual Agents. Subject matter experts can build conversational interactive voice response (IVR) bots in just a few clicks to help customers quickly self-serve, reducing contact center operation costs. Learn how to configure Power Virtual Agents bots for voice.
As the native voice channel in Dynamics 365 Customer Service continues to expand in regions, languages, and capabilities, subscribe to this blog for the latest updates. Set up your Omnichannel for Customer Service and install the voice channel today.
This article is contributed. See the original author and article here.
New make-to-order (MTO) automation capabilities available with the October 2022 release of Dynamics 365 Supply Chain Management streamline order-taking and related downstream processes. Supply chain planners can benefit from improved capable-to-promise (CTP) accuracy with plan-specific delay tolerance, keep supply available for last-minute orders, and automatically populate external order information during intercompany trade.
Impact of make-to-order
With MTO, production only starts after a customer places an order for a specific product. The main benefits of MTO are that you can accommodate customer-specific products and you don’t need to keep inventories of finished goods with the related risk of wastage. However, with MTO, your delivery time includes the production lead time and depends on the availability of resources and raw materials. This often leads to the need for CTP, close tracking of resource capacity, and flexibility for last-minute orders.
Until now, supply chain planners had to monitor and adjust supply levels and current demand manually. With the new automation capabilities in Supply Chain Management, planners can automate these tasks. The system takes informed actions based on parameters they set.
Benefits of make-to-order automation
Let’s take a closer look at the benefits of six improvements we’ve made for make-to-order scenarios.
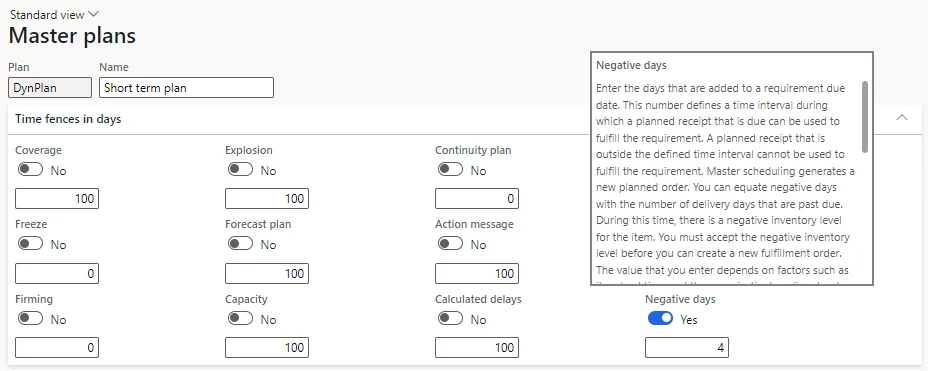
Delay tolerance control
Delay tolerance represents the number of days beyond the lead time that you’re willing to wait before you order new replenishment when existing supply is already planned. It helps you avoid creating new supply orders if the existing supply will be able to cover the demand after a short delay. With the new Negative days option for delay tolerance control, you can determine whether it makes sense to create a new supply order for a given demand. The ability to control delay tolerance at the master plan level gives you more flexibility between the static plan and the dynamic plan used for CTP calculations. Automating the process ensures that CTP calculations don’t allow delays. You can optimize refill orders on the static plan to use existing orders, even it causes a bit of delay.
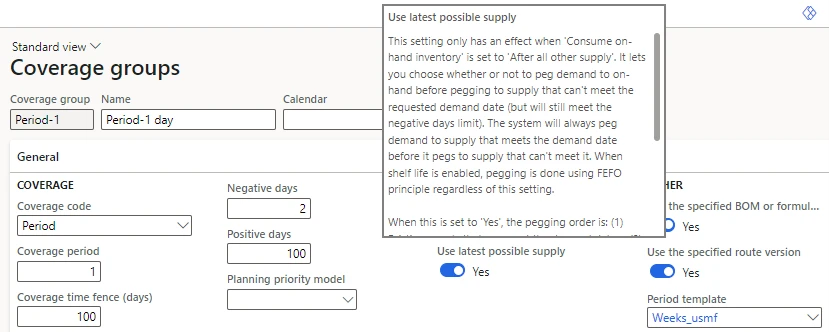
Use latest possible supply
The Use latest possible supply option lets you keep products available for last-minute orders. It optimizes the use of existing supply by pegging the latest possible supply to a demand instead of using the first possible supply.
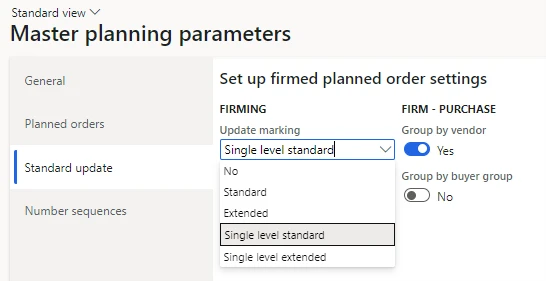
Single-level marking
Marking links supply to demand for the purpose of cost allocation. It resembles pegging, which indicates how master planning expects to cover demand. However, marking is more permanent than pegging because it’s respected by later planning runs. Now you can limit inventory marking to a single level when firming planned orders. That allows you to keep component assignments flexible for production orders after firming.
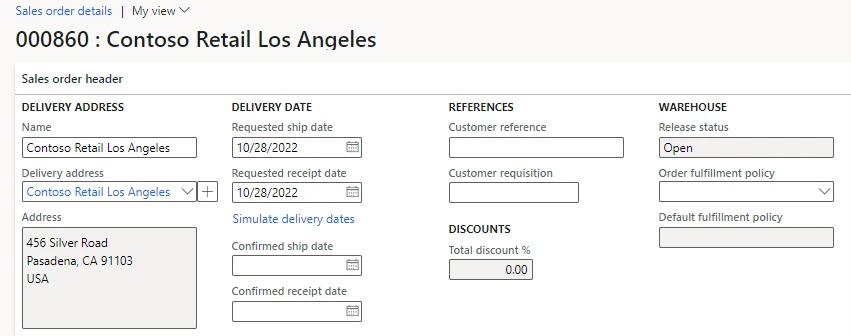
Order-specific fulfillment policy
You can already set a global default fulfillment policy and then override it for specific customers. Now you can view which default policy applies directly on the order and override it for individual orders. Previously, the order taker had to manually change the policy on the sales order. Now this step is automated, giving more control to the order taker and enabling flexible order processing.
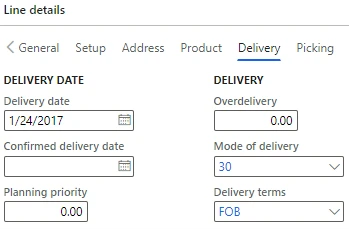
Line-controlled delivery
Delivery terms, mode of delivery, and external item numbers are critical information to track when one company receives a customer sales order, and another company ships the goods to the customer. Now purchase order lines are updated automatically to include this information from the intercompany sales order. This improvement enhances intercompany information exchange. It ensures that detailed demand information flows to the supplying company and that companies meet their customer commitments.
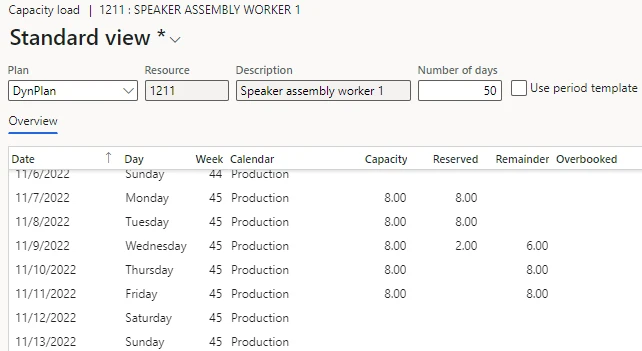
User-defined period on Capacity load page
We’ve added a field to the Capacity load page. The new Number of days field allows you to define a custom period over which to view the capacity load of a resource, enabling long-term evaluation.


Recent Comments