The next frontier of workforce planning: from forecasting to AI usage and Credit Estimation
This article is contributed. See the original author and article here.
AI is becoming part of the operational workforce
Customer service operations are entering a new phase of evolution, where AI is no longer just assisting work but actively performing it. In Dynamics 365 Customer Service and Contact Center, AI agents now drive core service workflows every single day. For example:
- Quality Evaluation Agent autonomously evaluates customer interactions against defined criteria, generating scores, summaries, and actionable insights to improve service quality at scale.
- Case Management Agent automates the case lifecycle by creating, updating, resolving, and closing cases using conversation context, reducing manual effort and improving consistency.
- Customer Intent Agent identifies customer intent from conversations, enabling intelligent self-service, guided interactions, and accurate routing to the right resources.
These agents are no longer peripheral tools; they are executing real workloads and contributing directly to business outcomes. This shift changes how organizations need to think about AI. If these agents are doing meaningful work, they are no longer optional enhancements; they are part of the workforce itself.
The Planning Gap: Demand Forecasting Without AI Cost Visibility
While AI adoption has accelerated, workforce planning practices have not kept pace.
Organizations today are well equipped to forecast demand, predicting case volumes, conversation trends, and channel distribution. However, when it comes to AI, a critical layer is missing. Teams often lack clear visibility into how forecasted demand translates into AI usage and, more importantly, into cost.
The challenge is not forecasting demand, but translating that demand into financial impact. Organizations can estimate how much work is coming, but they struggle to answer a simple question: if this is the expected demand, what will it cost in AI consumption?
Without a clear mapping between forecasted workload and AI credit consumption, planning becomes reactive. Finance teams discover AI costs only after they have occurred. Service leaders lack the data to allocate AI capacity confidently. Even small variations in demand can lead to unexpected changes in consumption, especially as AI handles a growing share of interactions.
Addressing this challenge requires connecting operational forecasting with financial modeling, enabling organizations to plan with both demand and cost in mind.
Introducing AI Credit Estimation in Dynamics 365
AI Credit Estimation in Dynamics 365 Customer Service and Contact Center brings these domains together.
Built on top of the platform’s intelligent forecasting capabilities, it provides a direct and transparent way to translate forecasted demand into expected AI credit consumption. Rather than treating AI cost as something to be reconciled after the fact, AI Credit Estimation makes it a first-class planning input alongside case volumes, staffing ratios, and service level objectives.
This allows organizations to move from abstract assumptions to measurable planning insights.
How it works: A Step-by-Step Walkthrough
Here is how to get from volume demand forecast to credit estimate in three steps:
Step 1: Define and Generate a Forecast Scenario
Start by creating a forecast scenario within the Dynamics 365 Customer Service or Contact Center forecasting experience. Specify the planning horizon and include the channels and queues that are in scope.
The platform’s intelligent forecasting model analyzes historical traffic patterns, including seasonal variation, and trend lines to generate predicted volumes for each queue and channel over your chosen time period. The result is a clear, data-driven view of expected demand.
Step 2: Select the AI Agents to Estimate
With your forecast in place, open the AI Credit Estimator and select the agent whose credit consumption you want to model. All out-of-the-box agents available in Dynamics 365 Customer Service and Contact Center are supported, including:
- Quality Evaluation Agent
- Case Management Agent
- Customer Intent Agent
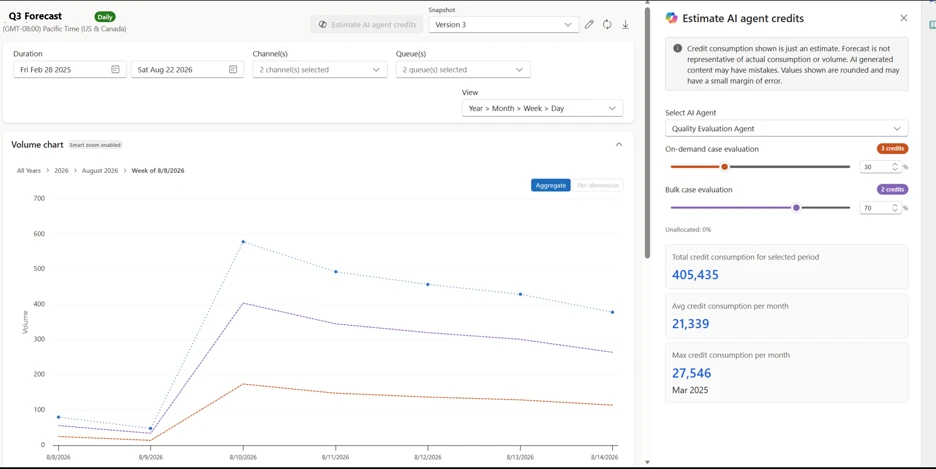
Step 3: Review Your Credit Estimate
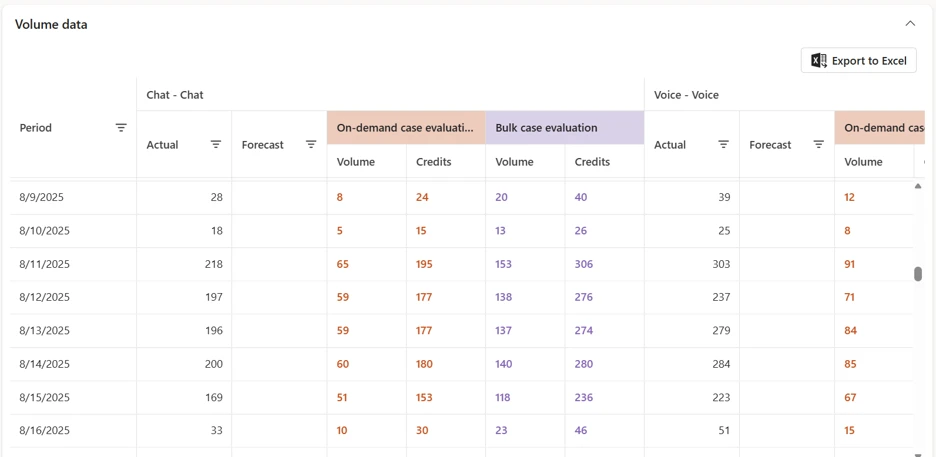
Once agent is selected, the estimation engine maps your forecasted workload to projected AI credit consumption. The output is a clear, readable credit estimate tied to the queues included in your forecast scenario.
This gives your team a single planning view that shows both expected demand and the associated AI credit cost required to service that demand. From here, teams can validate assumptions, adjust scenario parameters, and refine estimates before committing to capacity planning.
The screen below shows the estimator within the forecast scenario.
Shift Toward a unified workforce model
The deeper significance of AI Credit Estimation goes beyond a single feature. It represents a shift in how organizations can think about and manage AI in their service operations.
Until now, AI agents have often been treated as a separate category, evaluated for capability but not managed with the same financial and operational rigor as human staffing. AI Credit Estimation changes that. When you can forecast demand, estimate AI cost, and compare both against service objectives, AI agents become truly plannable workforce components.
This matters for several reasons:
- Finance teams can include AI credit projections in budget cycles and operational reviews, rather than discovering AI costs after they land on an invoice.
- Service operations leaders can balance human and AI capacity proactively, adjusting the mix based on cost, quality, and service level goals.
- IT administrators and solution architects can use credit estimates to validate deployment decisions and right-size AI agent usage before scaling.
As AI continues to take on a larger share of customer interactions the ability to plan human and AI agents within a unified workforce model becomes essential for both operational efficiency and financial transparency.
Learn more about AI credit Estimation To learn more about AI credit estimation in Dynamics 365 Customer Service and Contact Center, read the documentation on Microsoft Learn.
The post The next frontier of workforce planning: from forecasting to AI usage and Credit Estimation appeared first on Microsoft Dynamics 365 Blog.
Brought to you by Dr. Ware, Microsoft Office 365 Silver Partner, Charleston SC.


Recent Comments