Under the Hood: Building an AI-Driven Storefront with Dynamics 365 Commerce
This article is contributed. See the original author and article here.
Retail is constantly evolving, shaped by changing consumer behaviors, new technologies, and unpredictable macroeconomic shifts. While digital channels continue to grow, physical retail remains a cornerstone of the shopping experience. As Gartner® puts it, “Despite the growth in the popularity of digital channels, the physical store remains the most powerful, competitively differentiating touchpoint in unified retail commerce execution.”i
“The retail store is here to stay…”
Despite assumptions that digital-native shoppers would abandon brick-and-mortar stores, reality tells a different story. According to Gartner®, “Sixty-four percent of Gen Z, the first generation of ‘digital natives,’ prefer the physical retail experience versus shopping online, signaling that the retail store is here to stay for the foreseeable future.”i This is not just a generational quirk, it reflects a broader industry reality. The National Retail Federation reports that nearly 70% of total retail sales still happen in brick-and-mortar locationsii. These spaces are far more than transaction points; they are where consumers connect with products, experience brands firsthand, and engage in ways digital channels cannot match.
Retailers looking for growth can’t afford to treat stores as legacy infrastructure. They need to make targeted, future-ready investments that unlock the full potential of in-store experiences. That means going beyond maintaining a physical presence—today consumers expect consistency, convenience, and personalization across every channel. In-store experiences must match the intelligence and adaptability of their digital counterparts. Seamless transitions between online, in-store, and hybrid journeys are now table stakes.
Modernizing Dynamics 365 Commerce Point-of-Sale
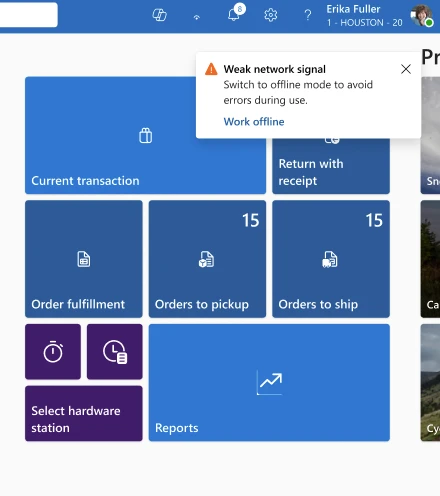
At Microsoft, we’re modernizing Dynamics 365 Commerce to reflect this shift. The Point-of-Sale (POS) is evolving from a checkout tool into an intelligent platform that supports agentic, AI-driven retail experiences. With built-in Copilot capabilities, Dynamics 365 Commerce POS now offers actionable insights that help store associates tailor interactions in real time. From understanding customer preferences and shopping behavior to accessing inventory and pricing insights, store associates can respond faster and more effectively.
The impact of copilot and agentic capabilities goes beyond customer engagement. These AI tools also reduce friction for employees, streamlining decision-making and boosting productivity. As Gartner® notes, “By 2027, over 50% of Tier 1 retailers will pivot from general to role-specific GenAI for store associates or risk increased labor churn.”i Empowering associates with smarter, context-aware tools isn’t optional; it’s a strategic move to retain talent and deliver next-generation service.
Take a look at how AI-driven product discovery in a POS can increase purchase conversion while driving customer satisfaction in this video.
Microsoft Copilot in Dynamics 365 Commerce
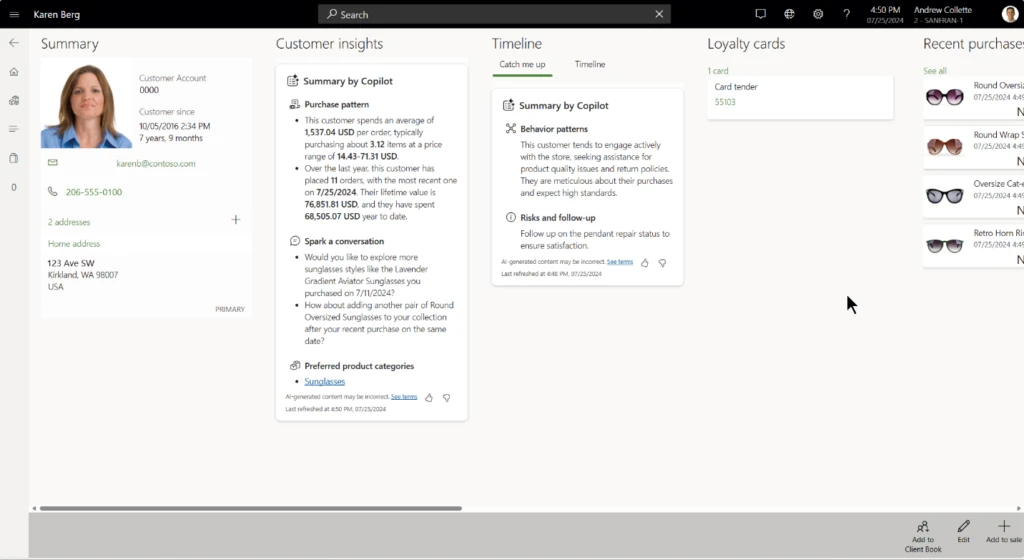
Dynamics 365 Commerce POS offers Copilot driven insights for products and customers that will help a store associate provide a personalized shopping experience tailored to the customer’s needs. These insights surface quick actions to the store associate on customer behavior, preferred price ranges, lifetime value, suitable products, product discounts, inventory levels etc.
In addition, Store report insights by Copilot provide precise and succinct overview of critical metrics such as sales, revenue, profit, margin, and overall store performance—all in a single workspace for optimal visibility. Copilot’s near real-time analysis keeps you ahead, updating summaries as new data arrives, empowering your store associates to communicate effectively, accurately, and instantly.
“Instant value of Copilot experiences in Store commerce app at Vera Bradley which helps as conversation starter for their store employees and helps with upsell and cross-sell” – Aaron Feagler, Director, Vera Bradley
For more information on the Customer insights by Copilot, see here.
Customer insights by Copilot in Dynamics 365 Commerce
Modern foundation for smarter retail experiences
To power the next generation of omnichannel retail, we have modernized the Dynamics 365 Commerce POS with a new framework built on React and Fluent 2 Design. This modern framework goes beyond a visual refresh – it supports agentic experiences, extensibility, and accessibility compliance.
React provides faster load times, smoother screen transitions, and a more responsive interface, especially on mobile and touch devices, making the experience more intuitive for store associates. The React-based framework sets the foundation for mobile experiences, which translates to a faster checkout resulting in sales conversion and better customer satisfaction.
Here are some of the new capabilities this foundation has helped us deliver:
1. Faster checkout with new transaction page workflows
The redesigned transaction page, now built with React-based controls and Fluent 2 Design, brings a faster, cleaner, and more intuitive checkout experience.
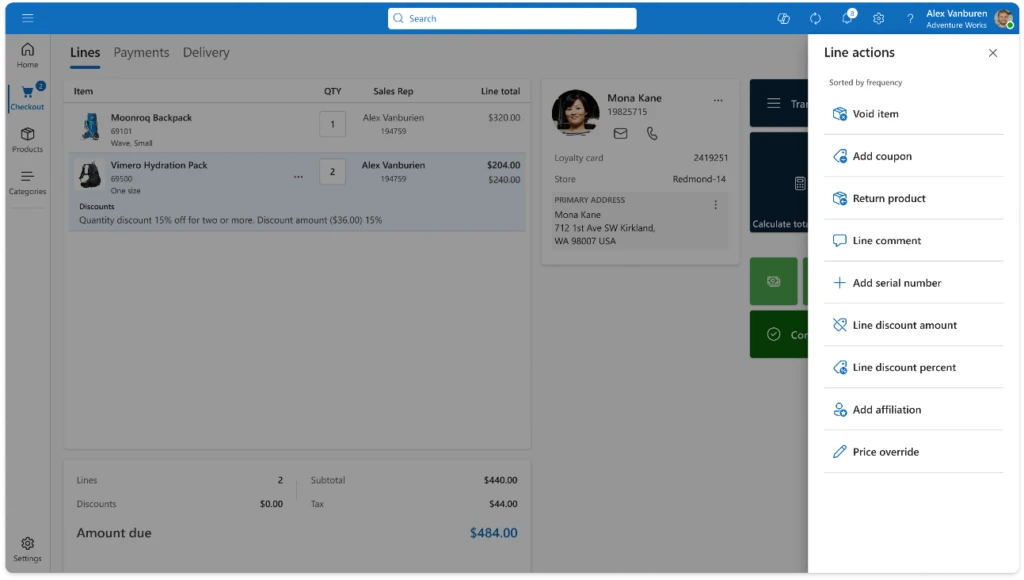
Store Commerce Transaction Page with React-based controls and Fluent 2 Design
With the new inline actions feature, store associates can now perform common actions like voiding a product, applying line discounts, or overriding prices directly within the transaction grid. Inline actions surface the most frequently used operations at the top, so there’s no need to scroll through long lists or dig through nested button grids. On mobile and touch devices, these actions are even easier to access with a simple long press. This makes the experience more intuitive and efficient.
Inline actions in Dynamics 365 Commerce
Updating item quantities is now just one click away. Store associates can tap the quantity directly within the grid. This removes the need to find a separate “Set Quantity” button and reducing steps during checkout.
With these improvements, the transaction page has fewer buttons and clearer calls to action. It fully supports existing extensibility features, so custom columns, fields, and controls will work seamlessly without extra development.
2. Optimized Payment Capture Workflow for Faster, lower friction Transactions
The new payment experience simplifies checkout by consolidating payment actions into a single-pane window, reducing clicks and prompts. This streamlined design speeds up processes for customers and associates, allowing configuration to skip unnecessary screens. Additionally, configuration options allow users to bypass specific screens and proceed directly to the actions required for common scenarios.
For cash transactions, Smart Denominations intelligently suggest the most logical bill and coin combinations based on configured increments. Associates can then quickly provide the correct change. When customers pay the exact amount, the Pay Exact payment method skips the “Enter Amount” screen, applying the full balance due immediately. This completes payment capture with just one click.
“The ability to easily navigate a payment is important, for both our company and the customer. We see a lot of potential in this style of payment flow, streamlining the process and reducing unnecessary button grids” – Chad Davidson, Senior Engineer, Memory Express
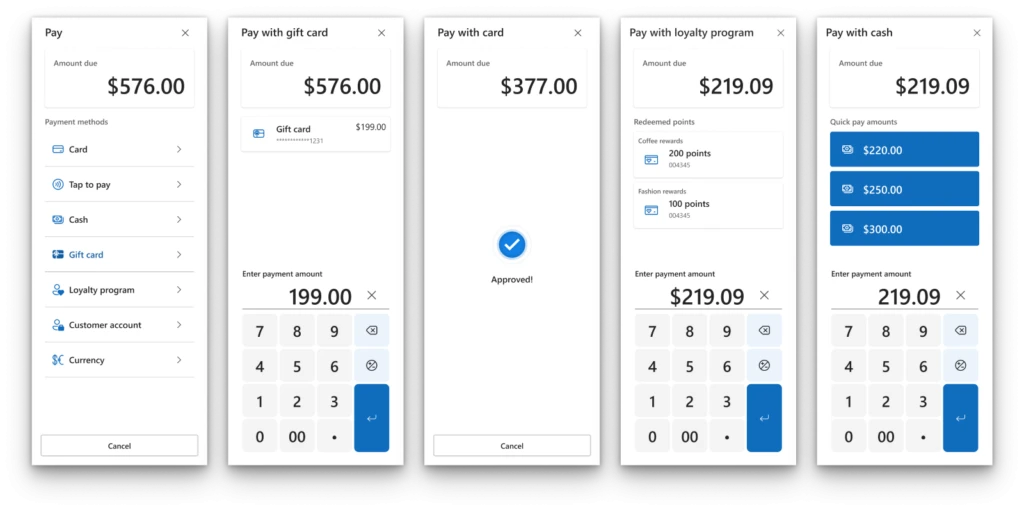
Optimized Payment Capture Workflows in Dynamics 365 Commerce
3. Loyalty Upsell Prompt for higher sales conversion
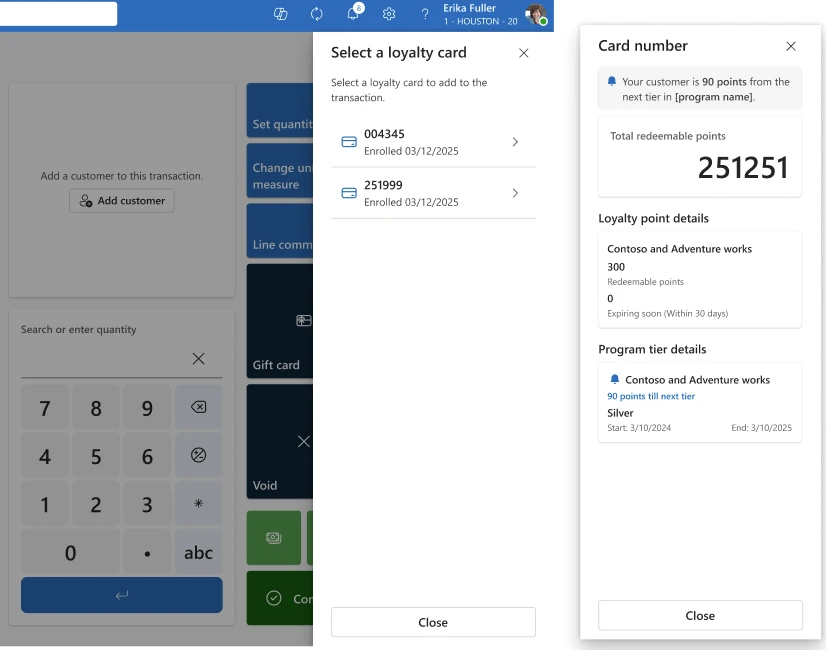
Loyalty Upsell Prompt in Dynamics 365 Commerce
The loyalty upsell prompt helps store associates inform customers about their progress towards the next loyalty tier, timely and accurately. This can nudge continued customer engagement to unlock new benefits leading to increased average order value through strategic upselling.
4. Toast Notification Framework
The new toast notification framework brings flexible, real-time alerts to Store Commerce, helping retailers modernize the POS experience. With full extensibility support, this framework can be extended to build your own store notifications meeting your unique business needs. Use it to share policy updates, flag low-stock items, and alert staff to customer assistance requests.
Toast Notification in Dynamics 365 Commerce
Visit Modern workflows in POS – Commerce | Dynamics 365 | Microsoft Learn for more about these improvements and how to enable them.
Watch this video to see some of these capabilities in-action.
What’s next?
Looking ahead, agentic experiences are poised to play a central role in retail transformation. The modern Point of Sale (POS) is no longer just a transactional endpoint. It now has the potential to serve as a platform for intelligent, AI-supported engagement. It can enhance customer satisfaction and improving sales conversion.
Imagine a retail environment where associates have timely access to real-time data and actionable insights. This enables more personalized and context-aware interactions. Whether guiding a customer toward discovering relevant products or helping bridge online and in-store experiences, these AI-assisted workflows support more cohesive and engaging shopping journeys. Features like personalized follow-ups, product tips, and feedback prompts can help reinforce customer value and ongoing connection. Over time, these interactions may support repeat business and help build long-term customer trust.
Dynamics 365 Commerce is continually evolving to meet the demands of this new landscape. It supports innovation and delivers capabilities that help retailers offer connected, adaptive experiences. Stay up to date on what’s new and what is coming by visiting our release planner.
i Predicts 2025: Transform Retail Stores’ Profitability With Private Label, Role-Specific GenAI and Computer Vision, Gartner®, 4 February 2025
GARTNER® is a registered trademark and service mark of Gartner, Inc. and/or its affiliates in the U.S and internationally and is used herein with permission. All rights reserved.
ii NRF Forecasts 2023 Retail Sales to Grow Between 4% and 6%, NRF
The post Under the Hood: Building an AI-Driven Storefront with Dynamics 365 Commerce appeared first on Microsoft Dynamics 365 Blog.
Brought to you by Dr. Ware, Microsoft Office 365 Silver Partner, Charleston SC.


Recent Comments