by Scott Muniz | Sep 6, 2020 | Azure, Technology, Uncategorized
This article is contributed. See the original author and article here.
Throughout this series, I’m going to discuss how Power Platform is particularly useful for ad-hoc basis jobs like provisioning resources on Azure.
In my previous post, we walked through how to install live-streaming related applications to Azure Windows VM while provisioning it. By the way, this type of VM provisioning is required ad-hoc basis, rather than a regular schedule. We create an ARM template for it, but we never know when it is used. The nature of ad-hoc workflows is like this. We may use it again, but we never know when it will be. We may not be ready to run when it needs to be run.
Power Apps is the right fit to handle this sort of running ad-hoc workflows on mobile devices. This post shows a glimpse of an idea how Power Apps and Power Automate handles Azure resource provisioning so that your IT pros in your organisation can create ad-hoc resources without having to get a DevOps engineer.
One Parameter Rules Power Automate Workflow?
The number of parameters from Power Apps is determined by the Power Apps trigger on Power Automate. If the number of parameters or parameter names used in a Power Automate workflow becomes too many, changes often, or is non-deterministic, this approach would be useful.
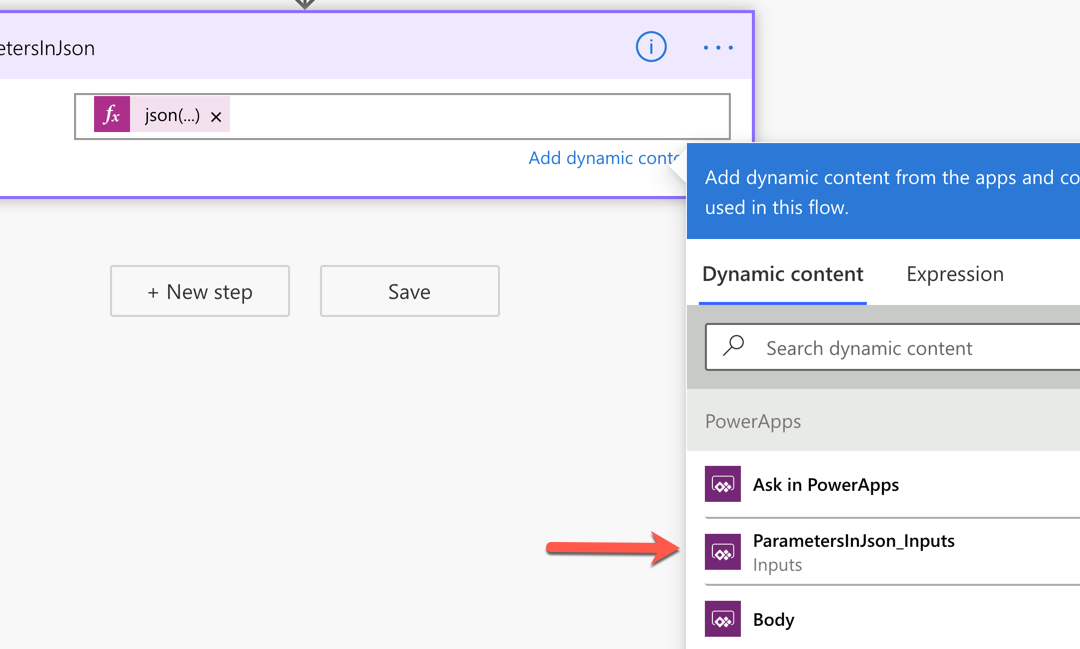
First of all, add a Compose action and change its name to ParametersInJson. Then create a parameter for it, which will be named to ParametersInJson_Inputs.

Add the function expression, json(triggerBody()?['ParametersInJson_Inputs']), to the Inputs field like this:
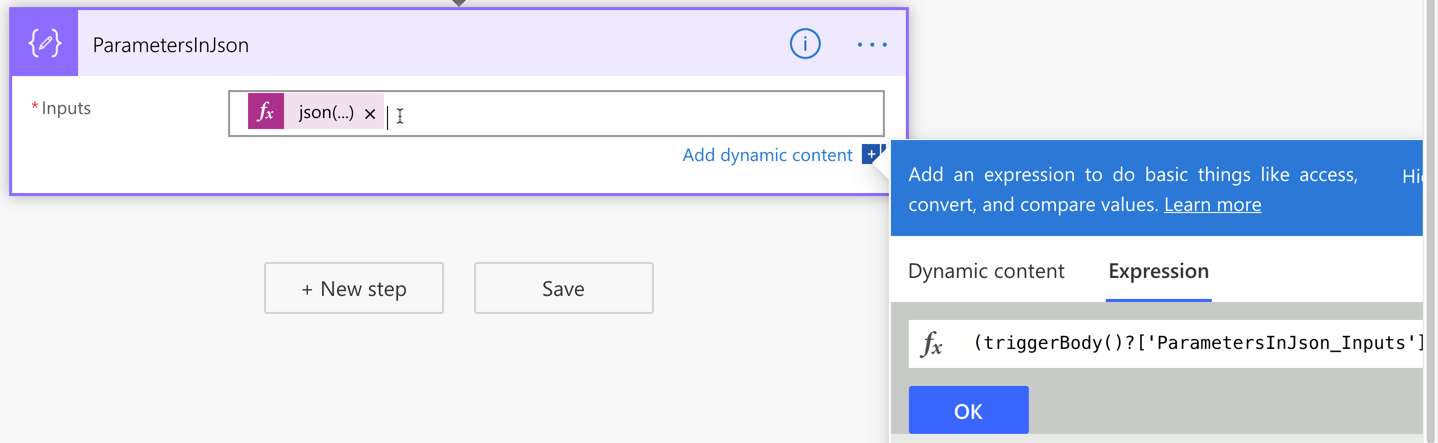
If we handle all the parameters passed from Power Apps in this way, we only have one parameter but take all values passed from Power Apps flexibly. This approach also avoids Power Apps from keeping remove and re-connect Power Automate over and over again whenever the parameters are updated.
Power Automate Workflow – Azure Resource Provisioning
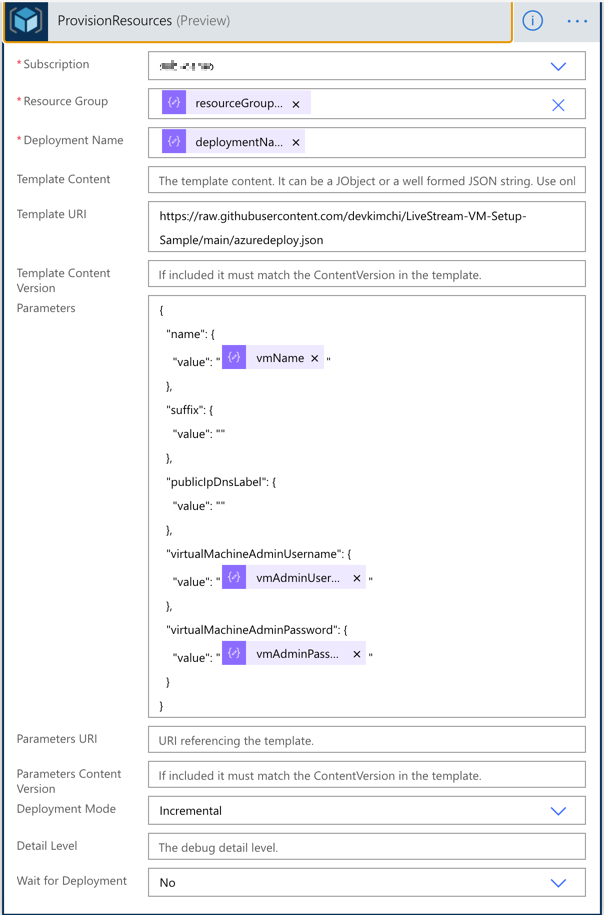
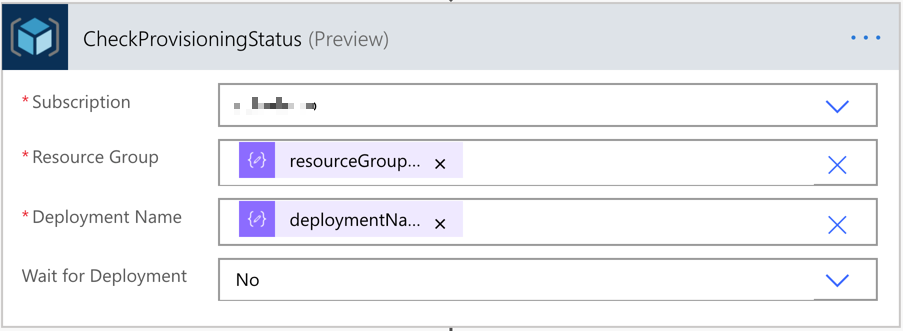
With the flexible parameter passed from Power Apps, run the ARM template deployment using the Azure Resource Manager deployment action. All the parameters used for this action are like:
outputs('ParametersInJson')?['resourceGroupName'],outputs('ParametersInJson')?['deploymentName'],outputs('ParametersInJson')?['vmName'],outputs('ParametersInJson')?['vmAdminUsername'] andoutputs('ParametersInJson')?['vmAdminPassword'].
Also, notice that the Wait for Deployment field value is set to No. I’ll discuss it soon.
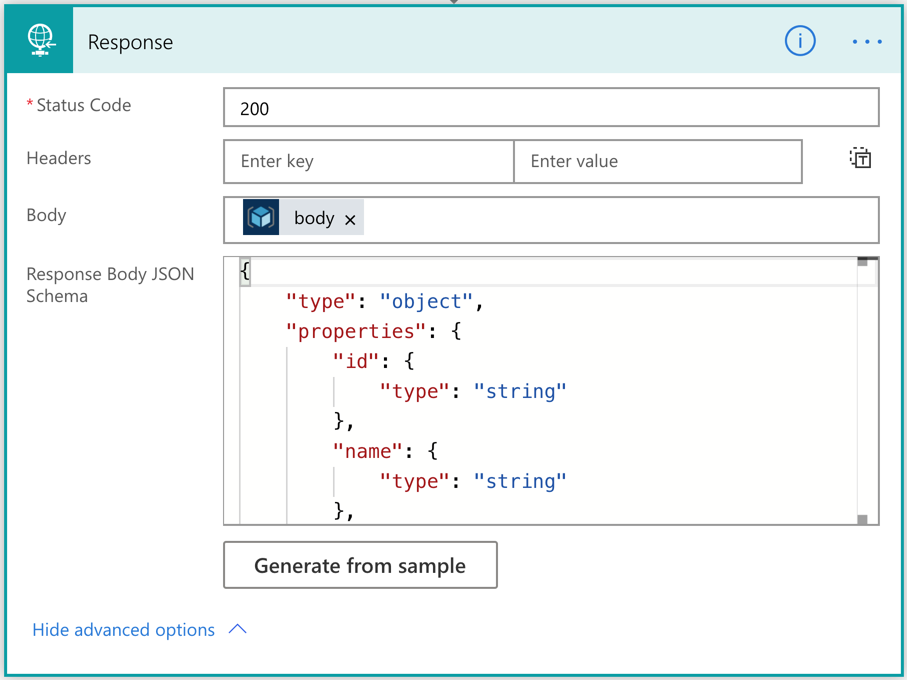
Once this action is run, the result should be returned to Power Apps through the Response action. The following screenshot shows how it uses the output of the ARM deployment action with JSON schema.
Now, we’ve created the workflow for Azure resource provisioning.
By the way, we need to consider the nature of this action. It takes from 30 seconds to 40 minutes or longer that completes the resource provisioning. As Power Apps can’t wait for it, the workflow should be running asynchronously. Did you remember that the Wait for Deployment field has been set to No in the previous action? The actual response has the status code of 201, not 200, because of this option.
How can we check the result of the resource provisioning? Let’s build another workflow for it.
Power Automate Workflow – Azure Resource Provisioning Status Check
This time, let’s build another workflow that checks the resource provisioning status. It only checks the status. We also use the same approach above to take the parameters from the Power App instance.
And let’s use the action to check the provisioning status. All the relevant variables look like:
outputs('ParametersInJson')?['resourceGroupName'] andoutputs('ParametersInJson')?['deploymentName']
The last action is the Response action that sends the action response back to Power Apps.
We’ve now got two workflows for the resource provisioning. Let’s build the Power Apps now.
Power Apps – Ad-hoc Azure Resource Provisioning
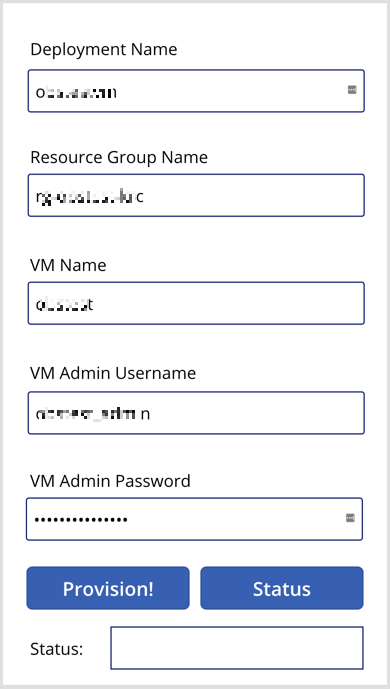
The layout of the app that IT pros in your organisation will use might look like the following. It accepts five parameters from the user, which will be used for both Power Automate workflows. One button starts the resource provisioning, and the other button checks the provisioning status.
Connect the resource provisioning workflow to the Provision! button and define the button action like below.
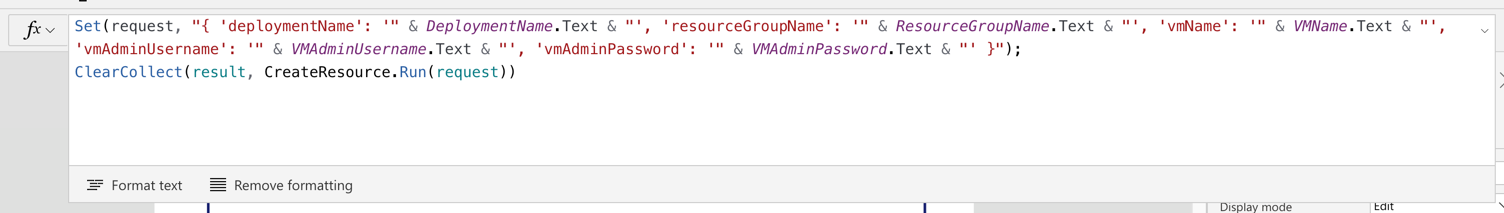
Note that we use the Set() function this time. With this function, we create a temporary variable of request and assign the JSON object as its value. Then, the request value is sent to the Power Automate workflow via the CreateResource() function. The request object will be decomposed to a JSON object in the Power Automate workflow. And the response of this function is stored to the result collection, using the ClearCollect() function.
    Set(request, "{ 'deploymentName': '" & DeploymentName.Text & "', 'resourceGroupName': '" & ResourceGroupName.Text & "', 'vmName': '" & VMName.Text & "', 'vmAdminUsername': '" & VMAdminUsername.Text & "', 'vmAdminPassword': '" & VMAdminPassword.Text & "' }");
    ClearCollect(result, CreateResource.Run(request))
As mentioned above, the resource won’t be instantly provisioned as soon as we tap the Provision! button. Therefore, we should use the Status button to check the provisioning status.
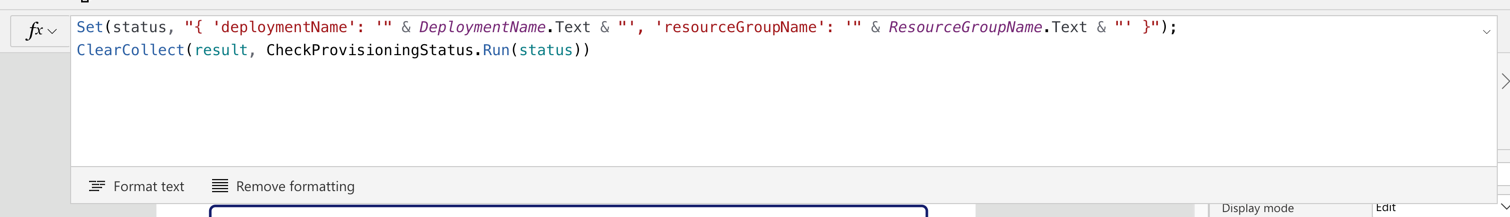
Similar to the approach above, we use the Set() function to initialise the status variable and send it to Power Automate through the CheckProvisioningStatus() function. Then the result will be stored to the result collection.
    Set(status, "{ 'deploymentName': '" & DeploymentName.Text & "', 'resourceGroupName': '" & ResourceGroupName.Text & "' }");
    ClearCollect(result, CheckProvisioningStatus.Run(status))
I use the Status button for simplicity. But you can make use of the Timer control for a more meaningful way, which is beyond the discussion of this article.
Finally set the label control to take the result from the workflow like First(result).properties.provisioningState, using the First() function.

We’ve now got the Power App, too! Let’s run the Power App with the actual value.
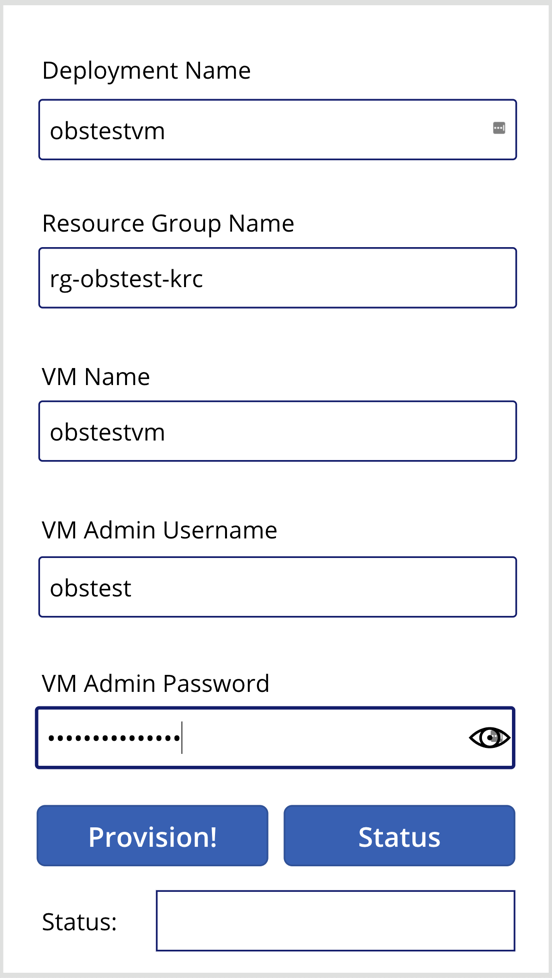
The first response from the provisioning will be like this:

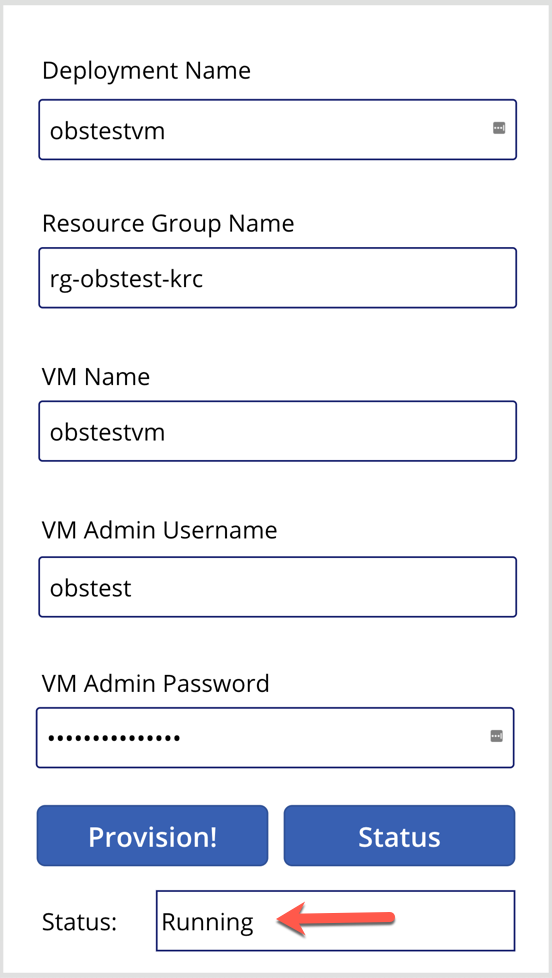
In the middle of the provisioning, the status will look like this:
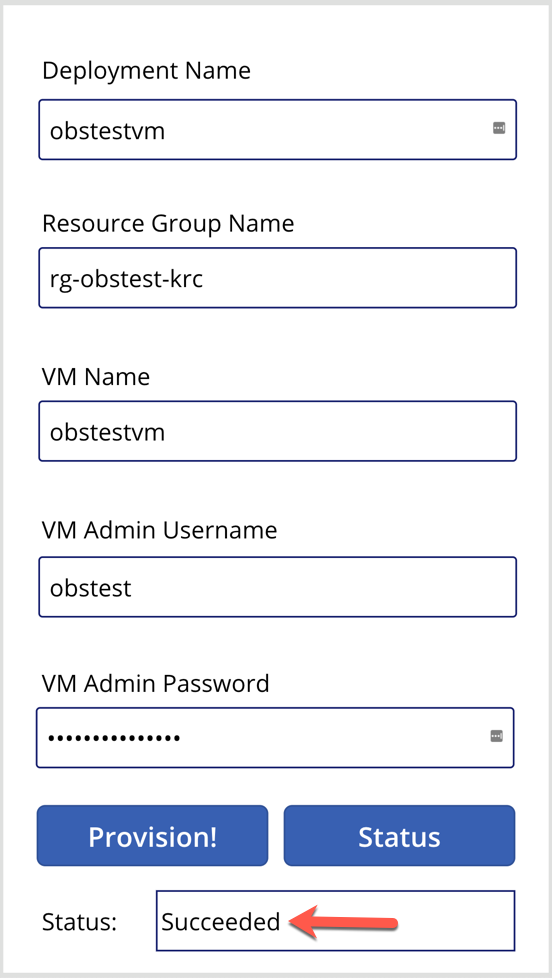
And after the resource provisioning is complete, the status will look like this:
So far, we’ve walked through how we built Power Automate workflows and Power Apps for ad-hoc Azure resource provisioning. We only used one use case here for simplicity, but there are more complex real-world examples with many ad-hoc scenarios in your business domain. If you can materialise those scenarios based on priority and frequency, it will increase productivity for sure.
This article was originally published on Dev Kimchi.
by Scott Muniz | Sep 6, 2020 | Azure, Technology, Uncategorized
This article is contributed. See the original author and article here.
Special thanks to “Yaniv Shasha” and “Ofer Shezaf” that collaborating with me on this blog post and thanks to “Clive Watson” and “Kieran Bhardwaj” for their support.
Introduction
During recent Azure Sentinel workshops some customers have asked for the possibility to ingest Vulnerability data into Azure Sentinel. In this blog, I will explain how to ingest and analyse vulnerability data in Azure Sentinel. I’m using Tenable as an example, but it can be any Threat & Vulnerability Management (TVM) platform.

Before explaining how the Tenable vulnerability management solution integrates with Azure Sentinel, it is very important to understand the use case of each one of those solutions.
First, what is a vulnerability management solution?
A vulnerability management solution enables enterprises to discover and mitigate potential vulnerabilities on their networks.
To do so, vulnerability management solutions provide continuous asset discovery, assessment (vulnerability and compliance), reporting and analysis prioritization capabilities. In other words, vulnerability management solutions scan for potential vulnerabilities, alerts your security team, and help them prioritize the remediations tasks.
Now that we understand what a vulnerability management solution is, why should vulnerability management solutions become a critical part of your SIEM/SOAR platform?
Asset information such as operating system services and vulnerabilities are critical for enriching events. Your SIEM can use Tenable’s data to get asset information. Let me give an example: a SIEM solution can help determine not only whether there is traffic from an identified malicious internet location, but also whether this traffic goes to a vulnerable asset. This can both increase the severity of an incident in the SIEM system and provide feed back to the vulnerability management solution to prioritize vulnerability remediation for the vulnerable machine.
So, let’s move to our main topic: How to automate vulnerability management using Azure Sentinel.
Scenarios
Let’s assume that your security team wants to collect data from Tenable vulnerability management solution to:
- Discover and identify all the assets in their environments attack surface before they can start to adequately protect it.
- Identify vulnerabilities, misconfigurations and other weaknesses.
- Understand vulnerabilities in the context of business risk and use that data to prioritize their efforts.
- Show successful remediation of vulnerabilities and misconfigurations.
- Correlate vulnerabilities with other data stored in Azure Sentinel like (Security Events).
In order to implement this scenario and workflow already described, Azure Logic Apps are your friend. :)
The playbooks (based on a Logic App) described in this post were created to allow Azure Sentinel customers to import Tenable data. These playbooks, however, can easily be modified to point to any other TVM solutions.
Prerequisites
- How to onboard Azure Sentinel: see here
- How to get Tenable.io vulnerability management up and running: see here
- Tenable.io API Key: see here
- Tenable.io API Ref: see here
- Configuring security playbook using Azure Logic Apps: see here
Data Ingestion
Security SaaS vendors like Tenable.io have an API you can authenticate to and query vulnerability results for based on a datetime. You will have to write some code or use a logic app to query the API and send the results to Azure Sentinel’s Data Collector API.
List of assets
This playbook performs the following steps:
- Trigger on a defined schedule.
- Read data from Tenable.io API https://cloud.tenable.com/workbenches/assets
- Retrieve the list of discovered assets with information (OS, ID, IP, FQDN and source of detection).
- Transform the data into the appropriate JSON format.
- Send the result to Azure Sentinel Log Analytics.

Once your data is connected, you can start analysing the data.
The rich query language used by Azure Sentinel called KQL, enables you to create advanced and complex queries in just a few lines. Here the link to KQL documentation – https://docs.microsoft.com/azure/azure-monitor/log-query/query-language
Let’s run a simple query to display the list of assets discovered by Tenable:
Tenable_Assets_Details_CL

| extend IP = extract("[0-9]{1,3}.[0-9]{1,3}.[0-9]{1,3}.[0-9]{1,3}",0, ipv4_s)

| extend Last_seen = last_seen_t

| summarize arg_max(last_seen_t, *) by id_g

| extend Asset_ID = id_g

| where IP != ""

| extend Detection_source = extract(".*: "(.*)",",1, sources_s)

| extend Operating_system = extract(""([a-zA-Z]*)"",1, operating_system_s)

| extend FQDN = extract(""(.*)"",1, fqdn_s)

| project TimeGenerated, Last_seen, Asset_ID, IP, Operating_system, FQDN, Detection_source

List of machines and associated vulnerabilities
This playbook performs the following steps:
- Trigger on a defined schedule.
- Read data from Tenable.io API to get the list of vulnerable assets: https://cloud.tenable.com/workbenches/assets/vulnerabilities
- Transform the data into the appropriate JSON format.
- For each asset ID, use another http action to get the list of vulnerabilities associated. https://cloud.tenable.com/workbenches/assets/asset_id/vulnerabilities
- Send the result to l Log Analytics.
Please see the playbook code in our Github: https://github.com/Azure/Azure-Sentinel/tree/master/Playbooks/Get-TenableVlun

Let’s run a simple query to display the list of assets with associated vulnerabilities:
let Sev = datatable (Severity:int, severity:string)

    ["4", "Critical",

     "3", "High",

     "2", "Medium",

     "1", "Low",

     "0", "Info"] ;

Sev

| join (

    Vulns_AssetID_List

) on Severity

| project TimeGenerated, AssetID_g, VulnID_s, VulnName_s, plugin_family_s, severity

Additional Playbooks can be implemented to collect more data from Tenable, like recommended solutions to remediate vulnerabilities: https://cloud.tenable.com/solutions
Vulnerability management dashboard
Based on data collected using previous steps, I created a dashboard to help security teams determine the risk to their organization.
Analysts now can accurately characterize the risk to the organization from specific vulnerabilities. The data that analysts can rely upon from this dashboard are vulnerabilities that were found across a multitude of vectors from active scanning and from host analysis mined from systems.
Asset management view
Assets within an organization are moving, joining, and leaving a network daily, which can be difficult to manage properly. Organizations that have an accurate asset management system can gain complete visibility on what devices are in use, and what operating system is installed on the network.

List of vulnerabilities with severity and state

Summary chart tracking unmitigated vulnerabilities of low, medium, high, and critical severity

Assets with associated vulnerabilities

Risk management
Tenable calculates a dynamic Asset Exposure Score (AES) for each asset on your network to represent the asset’s relative exposure as an integer between 0 and 1000. A higher AES indicates higher exposure.
Tenable calculates AES based on the current Asset Criticality Rating score (ACR, Tenable-provided or custom) and the severity associated with the asset.

Recommended solutions
Tenable provides recommended solutions for all vulnerabilities on your network.
Information about each solution includes:
- Description of the solution
- Asset affected, and the total number of assets affected by the vulnerabilities included in the solution.
- Common Vulnerabilities and Exposures (CVE ) count, the CVEs included in the solution.
- Common Vulnerability Scoring System (CVSS ), the highest CVSSv2 score (or CVSSv3 score, when available) for the vulnerabilities addressed by the solution.

Detection rule (Brute Force RDP Attack on vulnerable machine)
In this use case, my goal is to identify the machines at risk (with vulnerabilities) on which we saw an RDP brute force attack (based on security events generated from the server).
I installed a virtual machine (‘honeypot’ Windows machine in this example but this could also be Linux for SSH brute force attacks) in Azure IaaS (Infrastructure as a Service). In the Networking configuration, I add an ‘Inbound port rule’ with Destination port 3389 allowed.
I create an inbound rule (any-any) using port 3389 port so that malicious RDP connections will come in. This can be verified in the Windows Event Viewer (Event ID 4625 – An account failed to logon).
Another option to detect Brute Force is to leverage Azure Security Center: https://azure.microsoft.com/en-us/blog/how-azure-security-center-detects-ddos-attack-using-cyber-threat-intelligence/
Then alerts generated by ASC (Azure Security Center) can be sent to Azure Sentinel and correlated with other data like vulnerability.
First, I started with the Brute Force detection rule. Personally, I always create and fine-tune a rule via the Logs section and verify the attributes we want to use for entities. Entities are required for investigation and dashboards. For example:
let threshold = 5;

SecurityEvent

| where EventID == "4625"

| project Computer, Account, IpAddress, TimeGenerated

| summarize PerHourCount = count() by IpAddress, bin(TimeGenerated, 1h), Account, Computer

| where PerHourCount > threshold

| summarize StartTime = min(TimeGenerated), EndTime = max(TimeGenerated), UserList = make-set(Account), Failure = sum(PerHourCount) by RemoteIP = IpAddress, Computer

| project StartTime, EndTime, Computer, RemoteIP, UserList, Failure

| extend IPCustomEntity = IpAddress, AccountCustomEntity = UserList

| extend HostCustomEntity = Computer
Once the rule was created, I waited for the first incident to appear in the Overview or Incidents page

After we receive an incident, we can select the incident to see the incident details. A further option is to select the investigate button to get a graphical overview of the incident for analysis, or to select “View Full Details” to see the raw data.

The next step is to correlate Brute Force detection with vulnerability data to identify machines at risk.
For this use case here what I used as detection rule:
let Severity = datatable (severity_s:string , severity:string)

    ["4", "Critical",

     "3", "High",

     "2", "Medium",

     "1", "Low",

     "0", "Info"] ;

let High_vuls = Severity

| join (

    Vulns_AssetID_List_CL) on severity_s

| summarize arg_max(TimeGenerated, *) by IP_s, VulnID_s

| extend Asset_IP = IP_s

| where severity in ("Critical", "High", "Medium") ;

// Brute force detection

let threshold = 5;

let Brut_force= SecurityEvent

| where EventID == "4625"

| project Computer, Account, IpAddress, TimeGenerated

| summarize PerHourCount = count() by IpAddress, bin(TimeGenerated, 1h), Account, Computer

| where PerHourCount > threshold;

Brut_force

// Joint brute force with vulnerability info

| join kind=inner (High_vuls) on Asset_IP

| summarize StartTime = min(TimeGenerated), EndTime = max(TimeGenerated), UserList = make-set(Account), VulnsIDList = make-set(VulnID_s), VulnsNameList = make-set(VulnName_s) by RemoteIP = IpAddress, Computer

| extend IPCustomEntity = IpAddress, AccountCustomEntity = UserList

| extend HostCustomEntity = Computer
After we receive an incident, we can select the incident to see the incident details.

With the entity Account we know the username used by the attackers to try to logon.

I regrouped all accounts in a list called « UserList »
Mitigation
As you have seen in this blog, we can address real-world use cases by integrating vulnerability data into Azure Sentinel, showing how easy it is to create detection rules and visualizations. Although mitigation can be done using different methods, if you are using Azure Security Center, we recommend implementing the following remediation/preventative steps:
- Password Policy: Attackers usually launch brute-force attacks using widely available tools that utilize wordlists and smart rulesets to intelligently and automatically guess user passwords. So, the first step is to make sure to utilize complex passwords for all virtual machines. A complex password policy that enforces frequent password changes should be in place. Learn more about the best practices for enforcing password policies.
- Endpoints: Endpoints allow communication with your VM from the Internet. When creating a VM in the Azure environment, two endpoints get created by default to help manage the VM, Remote Desktop and PowerShell. It is recommended to remove any endpoints that are not needed and to only add them when required. Should you have an endpoint open, it is recommended to change the public port that is used whenever possible. When creating a new Windows VM, by default the public port for Remote Desktop is set to “Auto” which means a random public port will get automatically generated for you. Get more information on how to set up endpoints on a classic Windows virtual machine in Azure.
- Enable Network Security Group: Azure Security Center recommends that you enable a network security group (NSG) if it’s not already enabled. NSGs contain a list of Access Control List (ACL) rules that allow or deny network traffic to your VM instances in a Virtual Network. An endpoint ACL allows you to control which IP address, or CIDR subnet of addresses, you want to allow access over that management protocol. Learn more about how to filter network traffic with network security groups and enable Network Security Groups in Azure Security Center.
- Using VPN for management: A VPN gateway is a type of virtual network gateway that sends encrypted traffic across a public connection to an on-premises location. You can also use VPN gateways to send encrypted traffic between Azure virtual networks over the Microsoft network. To send encrypted network traffic between your Azure virtual network and on-premises site, you must create a VPN gateway for your virtual network. Both Site to Site and Point to Site gateway connections allow us to completely remove public endpoints and connect directly to the Virtual Machine over secure VPN connection.
Summary
We just walked through the process of standing up Azure Sentinel Side-by-Side with Tenable. Stay tuned for more Side-by-Side details in our blog channel.
by Scott Muniz | Sep 6, 2020 | Azure, Technology, Uncategorized
This article is contributed. See the original author and article here.
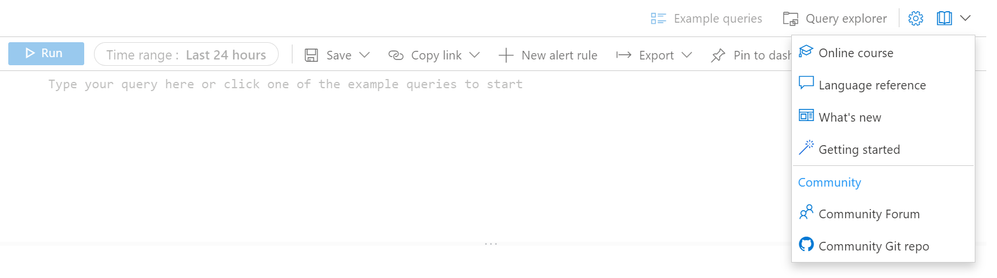
Writing queries can be challenging, and there’s really no need to start from scratch. The Azure Monitor Logs page has now links to the community’s GitHub repo in addition to the forum, so you can easily explore hundreds of working examples or consult on how to write your query.
In the Logs page, the Help menu now has a Community section:

The Example queries page also links to the GitHub repo, with many more examples you can use:

Are there additional community resources you find useful?
We invite you to comment on this blog post and let us know what you think.
Thank you,
The Log Analytics team
![[Guest Blog] HBCU Student Ambassador Voices: My Journey in Trusting the Process](https://www.drware.com/wp-content/uploads/2020/09/medium-37)
by Scott Muniz | Sep 4, 2020 | Uncategorized
This article is contributed. See the original author and article here.
This article was written by Microsoft Ignite 2020 Humans of IT student ambassador Trent Dalcourt, a Computer Science junior from Dillard University. This is the fourth article in a series featuring this year’s student ambassadors. To learn more about our student ambassadors hailing from five Historically Black Colleges and Universities (HBCUs) this year, click here. In this article, Trent shares about his personal experiences, inspiration drivers, and journey as a computer science major and #FutureTechnologist.
If I could leave ONE quote behind as a lesson for someone else reading this, it would be: “You have to learn to crawl before you learn to walk”. As simple as it sounds, this quote can be applied figuratively to several situations in life. It enables one to be conscious of the progress towards success while learning humility. It also allows you to learn from yourself while knowing that everything happens for a reason. In fact, this quote has instilled hope and motivation, leading me to strive to be the first in my family to successfully attain a college degree.

For as long as I can remember, I have been on the stride towards success. In my household of 7, my parents have always emphasized the value in education. Thanks to them, I’ve followed that path over the years. My mother was a program coordinator for a nonprofit organization called “Save The Children”. This same program became an extremely beneficial after-school program at my own school – it made me hone my reading and writing skills. It also encouraged students to develop skills in all areas of STEM. In addition to my interest in video games, going to this program for several school years sparked my interest and passion for technology, which, in turn, led to me dreaming of one day going to college and graduating as a first-generation college student.
Before being accepted into one of the first HBCUs in Louisiana, Dillard University, I had a hard time choosing what exactly I wanted to major in. No one in my family had graduated from college, and I was reluctant to just choose something that I would not be interested in. Also knowing that knowledge is power, I wanted to major in something that I knew would pay the bills and could eventually help me support myself and my family. This led me to major in computer science, with aspirations of one day becoming an IT professional.
In my first year of college, I got to attend my first hackathon and learn new programming languages. I also joined IT-related organizations on campus and made some new friends. My second year consisted of me working towards my goal of becoming a better student, and leader. I improved my grade point average which earned me a spot on the Dean’s List, and I got my first internship by the end of the year. I even traveled to New York for the very first time to attend a conference hosted for tech students! My third year, although I’m only just starting, is already off to a great start. College has given me such a genuinely rich experience that I will be forever grateful for.

I have taken many classes that have helped shape my perspective and knowledge as a student and young adult. I am definitely relishing where I am now in life, and appreciate working hard while letting my work ethic speak for itself. While my undergraduate career has not been easy in the slightest, having a growth mindset helps in knowing that you have to remain consistently resilient and not give up, or else all of the hard work you put in goes to waste. This brings me back to the quote mentioned earlier, about learning to crawl before you walk.
As a Microsoft Human of IT student ambassador, I am super excited to see where I go next in my path towards becoming an IT Professional. In this blog post, I could have listed more failures or doubts of mine. I could have even listed all of the times that I considered given up on my own future. However, I want to make it clear that it is important to know that everything you say about your destiny, your legacy, has meaning and power behind it. If I were to focus on all the shortcomings I had, I would certainly not be where I am now.

Just imagine the people that are looking up to you as a role model, and how much impact you could have in inspiring them to keep pushing on. No matter who you are, where you are from or how tough the journey is – keep taking it step by step, and day by day. Keep working towards your goals, chipping away at it diligently and who knows, maybe one day it will all be worth it.
I know that I have a long way to go, but I also know that I WILL make it. To all of you out there reading this, remember to trust the process. You’ve got this.
#HumansofIT
#StudentAmbassadors
by Scott Muniz | Sep 4, 2020 | Uncategorized
This article is contributed. See the original author and article here.
I am excited to share some information about a new resource coming to the Microsoft Tech Community. We have been working to create a home for new videos and interactive guides to help you work effectively with our products, and I am pleased to announce that this new resource is almost ready!
On Sept, 22nd we will launch the Microsoft Tech Community Video Hub, initially with content to support Microsoft Ignite, but it will be the future home for Tech Community videos to help you learn everything you need to know about our major products.
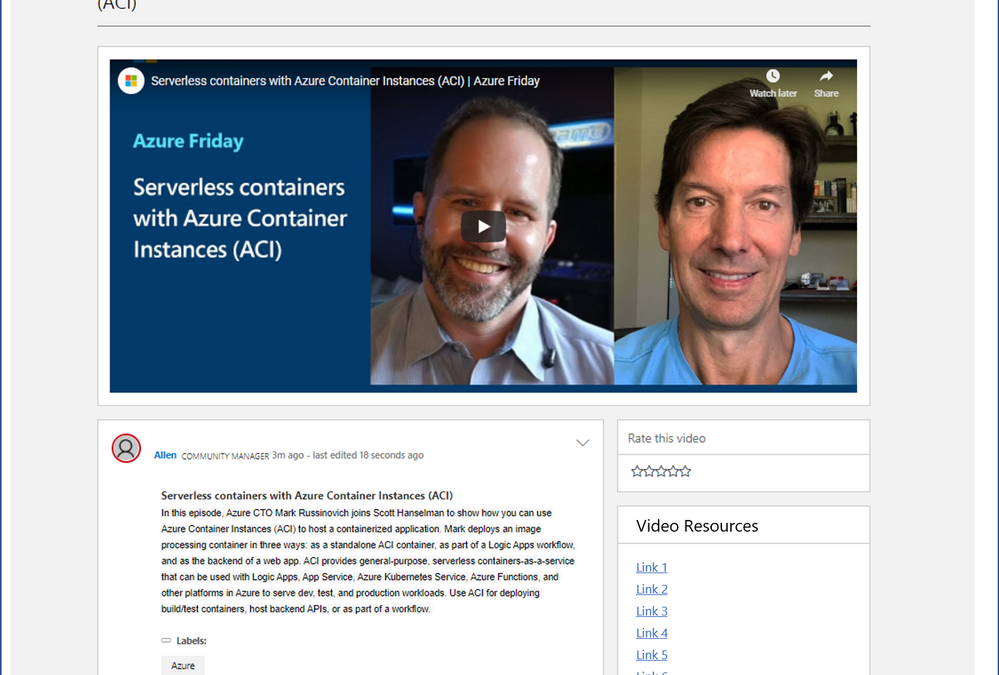
 Mock up of the New Video Hub
The new Video Hub will be the place to view videos, click through our interactive guides (a click-through demo experience) and join conversation about this content with fellow community members. We will also show, where available, who the subject matter experts are and, if this video is one of a series, we will provide a link to the next video in that series.
We would love for you to tell us how much you enjoyed the video using the ‘rate this video’ function on the right hand side. We will also work with our teams to show a list of video resources which connect you to other places to continue your learning or just next steps.
When the Video Hub goes live, on Sept 22nd, you will be able to access it here: https://aka.ms/VideoHub.
by Scott Muniz | Sep 4, 2020 | Azure, Technology, Uncategorized
This article is contributed. See the original author and article here.
Azure Data Explorer has a mature, open source Kafka Connect sink connector that is in use in production by multiple customers. The connector was *gold* certified in September 2020 by Confluent and is now listed in Confluent Connector Hub. The certification involved stringent testing by Confluent for quality, standards, best practices, feature completeness, delivery guarantees and performance. To meet the certification requirements, we added a number of new features to our connector, renamed some, and removed support for some with version 1.x. This article details the same.
For comprehensive information about our connector, visit our Git repo.
Improved delivery guarantees
Our connector now offers “At least once” delivery guarantees (no data loss).
What’s new
1. Comprehensive upfront validation
The connector validates for all required and dependent sink properties, access and grants and shuts down upfront with appropriate error messages.
2. Configurable behavior on error
A new sink property with possible values of fail (shut down connector task), ignore (ignore and continue processing), and log (log errors and continue processing).
behavior.on.error
3. *New* configurable retries
A set of new sink properties-
errors.retry.max.time.ms
errors.retry.backoff.time.ms
errors.retry.max.time.ms: Period of time in milliseconds to retry for transient errors
errors.retry.backoff.time.ms: Period of time in milliseconds to backoff before retry for transient errors
4. Additional converters supported
We have added support for the following converters-
org.apache.kafka.connect.json.JsonConverter
io.confluent.connect.avro.AvroConverter
io.confluent.connect.json.JsonSchemaConverter
JsonSchemaConverter is for Json with schema.
4. Schema registry support
The connector now supports schema registry with the property-
value.converter.schema.registry.url
We support schema registry for avro and json, protobuf is on the roadmap.
5. Schema with message
The connector now supports messages with schema with the following sink property that accepts a boolean-
value.converter.schemas.enable
6. Kafka Connect deadletterqueue
The optional sink properties below can be provided for Kafka Connect to redirect messages that failed deserialization-
errors.deadletterqueue.bootstrap.servers
errors.deadletterqueue.topic.name
errors.deadletterqueue.security.protocol
errors.deadletterqueue.sasl.mechanism
errors.deadletterqueue.sasl.jaas.config
errors.deadletterqueue.sasl.kerberos.service.name
The last 4 sink properties are required for secure clusters and*kerberos* property is specific to kerberized Kafka clusters.
7. Miscellaneous deadletterqueue
The optional sink properties below can be provided for the connector to redirect messages that failed besides deserialization, e.g. transient failures beyond retry period –
misc.deadletterqueue.bootstrap.servers
misc.deadletterqueue.topic.name
misc.deadletterqueue.security.protocol
misc.deadletterqueue.sasl.mechanism
misc.deadletterqueue.sasl.jaas.config
misc.deadletterqueue.sasl.kerberos.service.name
The last 4 sink properties are required for secure clusters and*kerberos* property is specific to kerberized Kafka clusters.
What’s renamed
For the purpose of standardization and consistency, we have renamed some properties-
| Previous name |
New name |
| kusto.auth.authority |
aad.auth.authority |
| kusto.auth.appid |
aad.auth.appid |
| kusto.auth.appkey |
aad.auth.appkey |
| kusto.tables.topics_mapping |
kusto.tables.topics.mapping |
| kusto.sink.tempdir |
tempdir.path |
| kusto.sink.flush_interval_ms |
flush.interval.ms |
kusto.sink.flush_size
|
flush.size.bytes |
What’s removed
The following properties are no longer supported with version 1.x-
| Property name |
Rationale |
| kusto.auth.username |
Customers typically only use application IDs/service principals; We therefore removed support for user principals |
| kusto.auth.password |
Customers typically only use application IDs/service principals; We therefore removed support for user principals |
| eventDataCompression |
We now compress all data shipped to Azure Data Explorer, to improve performance |
Connector documentation
Visit out Git repo
Connector download
Visit out Git repo release page
Confluent Connector Hub
https://www.confluent.io/hub/microsoftcorporation/kafka-sink-azure-kusto
Need support?
Ran into a bug? Need hep getting started? Have a feature request? Open an issue.
Want to contribute?
Read our guidelines and get involved. We welcome community contribution.
by Scott Muniz | Sep 4, 2020 | Uncategorized
This article is contributed. See the original author and article here.
Hi Guys, welcome to SQL Server Allocation Series, hope you enjoy the post1 and post2.
Today, I’m going to show you the detail of IAM page.
An Index Allocation Map (IAM) page maps the extents in a 4-GB part of a database file used by an allocation unit. An allocation unit is one of three types:
- IN_ROW_DATA
Holds a partition of a heap or index.
- LOB_DATA
Holds large object (LOB) data types, such as XML, VARBINARY(max), and VARCHAR(max).
- ROW_OVERFLOW_DATA
Holds variable length data stored in VARCHAR, NVARCHAR, VARBINARY, or SQL_VARIANT columns that exceed the 8,060 byte row size limit.
Each partition of a heap or index contains at least an IN_ROW_DATA allocation unit. It may also contain a LOB_DATA or ROW_OVERFLOW_DATA allocation unit, depending on the heap or index schema.
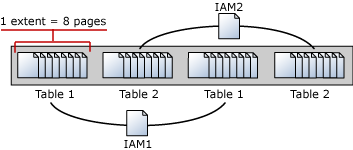
An IAM page covers a 4-GB range in a file and is the same coverage as a GAM or SGAM page. If the allocation unit contains extents from more than one file, or more than one 4-GB range of a file, there will be multiple IAM pages linked in an IAM chain. Therefore, each allocation unit has at least one IAM page for each file on which it has extents. There may also be more than one IAM page on a file, if the range of the extents on the file allocated to the allocation unit exceeds the range that a single IAM page can record.


IAM pages linked in a chain per allocation unit An IAM page has a header that indicates the starting extent of the range of extents mapped by the IAM page. The IAM page also has a large bitmap in which each bit represents one extent. The first bit in the map represents the first extent in the range, the second bit represents the second extent, and so on. If a bit is 0, the extent it represents is not allocated to the allocation unit owning the IAM. If the bit is 1, the extent it represents is allocated to the allocation unit owning the IAM page.
When the SQL Server Database Engine has to insert a new row and no space is available in the current page, it uses the IAM and PFS pages to find a page to allocate, or, for a heap or a Text/Image page, a page with sufficient space to hold the row. The SQL Server Database Engine uses the IAM pages to find the extents allocated to the allocation unit. For each extent, the SQL Server Database Engine searches the PFS pages to see if there is a page that can be used. Each IAM and PFS page covers lots of data pages, so there are few IAM and PFS pages in a database. This means that the IAM and PFS pages are generally in memory in the SQL Server buffer pool, so they can be searched quickly. For indexes, the insertion point of a new row is set by the index key, but when a new page is needed, the previously described process occurs.
In post 1, I created a table with 8 pages, all these 8 pages are in mixed extent. I’m going to insert more rows into the table to increase the pages. As you expected, these new rows/pages will be allocated to uniform extents.
I’m going to walk you through how SQL Server save the info in IAM pages.
Data manipulation:
T-SQL:
insert heaptable1 values(15,REPLICATE(‘o’,8000)) –page 9
insert heaptable1 values(16,REPLICATE(‘p’,8000)) –page 10
insert heaptable1 values(17,REPLICATE(‘q’,8000)) –page 11
insert heaptable1 values(18,REPLICATE(‘r’,8000)) –page 12
insert heaptable1 values(19,REPLICATE(‘s’,8000)) –page 13
insert heaptable1 values(20,REPLICATE(‘t’,8000)) –page 14
insert heaptable1 values(21,REPLICATE(‘u’,8000)) –page 15
insert heaptable1 values(22,REPLICATE(‘v’,8000)) –page 16
insert heaptable1 values(23,REPLICATE(‘w’,8000)) –page 17
The table heaptable1 has 17 pages in four extents, two mixed extents and two uniform extents.
select allocated_page_file_id as [FileID],allocated_page_page_id as [PageID],page_type_desc,extent_page_id/8 as ExtentID,
is_mixed_page_allocation,extent_page_id as [First Page in Extent],extent_page_id+7 as [LastPage in Extent],is_allocated From
sys.dm_db_database_page_allocations(db_id(),object_id(‘dbo.heaptable1′),null,null,’detailed’) order by allocated_page_page_id

Page 246 is the IAM page.
Page 245,247,328,329,330,331,332 and 333 are in mixed extent.
Starting from page (1:352), all the pages are allocated in uniform extent.
Page(1:352)~(1:359) are in extent 44,
Page(1:360)~(1:367) are in extent 45.
Let me run DBCC PAGE of IAM page to show you how the info recorded.

The first 8 pages are listed under ‘Single page allocations’, which means they are in mixed extent.
(1:352)~(1:360) are in uniform extent, the result matches the DMF sys.dm_db_database_page_allocations
(1:352) is the first page of extent 44
(1:360) is the first page of extent 45
Let’s dive into the IAM page with parameter 1:

1.There are two slots in IAM page,
- The first slot(slot 0) are for pages in Mixed extent.
- The second slot(slot 1) are for pages in Uniform extent.
2.Let me interpret the slot 0.
1)Each string in rectangle stands for one page, the format is PageId:FileId.
2)The first 8 characters are page id, the last four part is for Fileid.
Here is the interpretation table:
|
Original string->
|
PId:FileId->
|
FId:PId->
|
FId:PId->
|
FId:PId(Decimal)
|
|
f50000000100
|
f5000000:0100
|
0100: f5000000
|
0001:000000f5
|
1:245
|
|
f70000000100
|
f7000000:0100
|
0100:f7000000
|
0001:000000f7
|
1:247
|
|
480100000100
|
48010000:0100
|
0100:48010000
|
0001:00000148
|
1:328
|
|
490100000100
|
49010000:0100
|
0100:49010000
|
0001:00000149
|
1:329
|
|
4a0100000100
|
4a010000:0100
|
0100:4a010000
|
0001:0000014a
|
1:330
|
|
4b0100000100
|
4b010000:0100
|
0100:4b010000
|
0001:0000014b
|
1:331
|
|
4c0100000100
|
4c010000:0100
|
0100:4c010000
|
0001:0000014c
|
1:332
|
|
4d0100000100
|
4d010000:0100
|
0100:4d010000
|
0001:0000014d
|
1:333
|
3.I have demonstrate how the IAM page stores the first 8 pages in mixed extent, now let’s move on to the uniform extent.
4.The uniform extents info is stored in the second slot(slot 1).

1)’0000381f’ is reserved, we don’t need to worry about it.
2)The string I cared about is ‘00000000 0030’
Following table interprets the string.

3)Each bit in the table stands for one extent.
4)0 means the extent is not occupied/allocated by this table of the IAM.
5)1 means the extent is occupied/allocated by this table of IAM, and it’s uniform extent.
6)Here is more detail

Which exactly as same as the result we got from DBCC Page with parameter 3 before.

You may download the dbtest20200904.zip and give it a try.
by Scott Muniz | Sep 4, 2020 | Uncategorized
This article is contributed. See the original author and article here.
Hello everyone, here is part 17 of a series focusing on Application Deployment in Configuration Manager. This series is recorded by @Steve Rachui, a Microsoft principal premier field engineer.
This session focuses on the Install Application option for rapidly deploying applications to device(s). The tutorial walks through what this component is, how to configure it and demonstrates its use.
Posts in the series
Go straight to the playlist
by Scott Muniz | Sep 4, 2020 | Uncategorized
This article is contributed. See the original author and article here.
This week, we bring you recent articles by Excel MVPs Mourad Louha, Ismael Romero, and Frederic Le Guen.
Datentypen aus Power BI in Excel abrufen (Get data types from Power BI in Excel)
Excel MVP Mourad Louha describes his first experience with Power BI datatypes in Excel and how easy it is to get custom datatypes into Excel – starting with an introduction to the geography datatype and then the steps to create custom datatype from an existing Power BI dataset.
Power Query: Repetir y numerar filas como n de N (Power Query: Repeat and number rows as n of N)
Excel MVP Ismael Romero describes using Power Query to obtain an enumerated list in ‘n of N’ form for each original record.
Le secret du raccourci Ctrl + D (The Secret of Ctrl-D)
Excel MVP Frederic Le Guen reveals the secret of Ctrl-D when working with graphics objects in Excel.
Find this useful or want to know more about a specific Excel topic? Leave a comment below.
by Scott Muniz | Sep 4, 2020 | Azure, Technology, Uncategorized
This article is contributed. See the original author and article here.
JUST ENOUGH AZURE DATA EXPLORER FOR CLOUD ARCHITECTS
This article provides a high-level overview of all the key capabilities in Azure Data Explorer, positioning, and resources, and is intended to demystify Azure Data Explorer for cloud architects.
WHAT IS AN ANALYTICAL DATABASE?
Analytical databases are purpose-built and optimized to query and run advanced analytics on large volumes of data with extremely low response times. Modern analytical databases are generally distributed, scalable, fault-tolerant, and feature columnar, compressed formats, and intelligently use in-memory and disk caching technologies. In contrast, transactional databases are optimized for single digit millisecond point reads by key or intra-partition range query, support random CRUD and ACID semantics, and more.
WHAT IS AZURE DATA EXPLORER?
Azure Data Explorer, code name, Kusto, is a low latency, big data, Microsoft proprietary, append-only analytical database. It is feature and functionality rich as a platform – with durable storage, query engine, search engine, proprietary Kusto Query Language, support for ingestion of data in disparate formats from disparate sources, in batch and streaming, with advanced analytics/data science and geospatial analytical capabilities out of the box, server side programmability and support for visualization, scheduling, orchestration and automation.
Azure Data Explorer is mature and heavily used internally at Microsoft and powers many core Azure offerings such as Azure Monitor, Azure Sentinel, Azure Time Series Insights and more. It is fully managed, scalable, secure, robust, and enterprise ready and is a popular platform for log analytics, time series analytics, IoT, and general-purpose exploratory analytics. In a subsequent section, we cover, what Azure Data Explorer is not.
USE CASES FOR AZURE DATA EXPLORER
- Azure Data Explorer is a big data solution, ideal for-
- Analytics on IoT telemetry
- Analytics on all manners of time series data
- Analytics on all manners of logs
- Analytics on clickstream and any other form of live sources
- Text search
- Geo-spatial analytics
- Advanced analytics
- Exploratory environment for data scientists and business/data analysts
Reference architecture is covered further in this article, after the value proposition.
VALUE PROPOSITION AND SALIENT FEATURES
1. LOW LATENCY QUERY ENGINE
Azure Data Explorer leverages innovative, and contemporary compressed columnar and row stores along with a hierarchical cache paradigm, featuring configurable hot and cold caches backed by memory and local disk, with data persistency on Azure Storage. With this architecture, terabytes and petabytes of data can be queried, and results returned within milliseconds to seconds. Refer the white paper for more implementation details.
For applications where performance of analytical queries is critical, Azure Data Explorer is a great fit as a backend analytical database.
2. DISTRIBUTED BY DESIGN
Azure Data Explorer is a big data, cluster computing system comprised of engine nodes that serve out queries and data management service nodes that perform/orchestrate a variety of data related activities including ingestion and shard management. A few key capabilities of distributed systems are partitioning, consistency, replication, scalability and fault tolerance.
- Data persisted in Azure Data Explorer is durably backed by Azure Storage that offers replication out of the box, locally within an Azure Data Center, zonally within an Azure Region.
- An Azure Data Explorer cluster can be scaled up vertically or down as workload resource requirements change. Azure Data Explorer clusters can be scaled out horizontally and scaled in, manually, or with auto-scale.
- From a partitioning perspective, Azure Data Explorer natively partitions by ingestion time with a proprietary formula to prevent hot spotting, but also offers a user configurable partitioning based on data attributes/columns. Out of the box, the service offers options of strong and weak consistency, with strong consistency as the default. All data ingested into Azure Data Explorer is automatically indexed, allowing fast lookup queries.
For analytical applications where scale and reliability are a must, Azure Data Explorer is a great fit.
3. RICH INTEGRATION AND CONNECTOR ECOSYSTEM
Azure Data Explorer has a rich connector eco-system for batch and near real-time ingestion, with Microsoft first party services as well as open source distributed systems.
It supports open source integration systems and aggregator, connector frameworks, like Apache Kafka’s Kafka Connect and ELK stack’s Logstash. It supports Apache Spark for both read and persist, opening up numerous integration possibilities with open source big data systems, whether transactional or analytical.
From a streaming perspective, Azure Data Explorer supports Azure IoT, Azure Event Hub and Apache Kafka. For bulk ingestion or event-driven ingestion, Azure Data Explorer integrates with Azure Storage, with a queued ingestion functionality, and with Azure Event Grid for configurable event driven ingestion.
From an ingestion format perspective, Azure Data Explorer supports a number of formats from CSV and JSON to binary formats like Avro, Parquet and ORC, with support for multiple compression codecs.
It is a common pattern today to curate all enterprise information assets in a data lake. Azure Data Explorer supports the external table paradigm with an integration with Azure Data Lake Store. It also features continuous ingest and continuous export capabilities to Azure Data Lake Store.
Collectively, with the connector eco-system, support for disparate ingestion formats and compression, whether in batch or streaming modes, with support for business workflows, scheduling, and orchestration, Azure Data Explorer is enterprise-ready from an integration perspective.
4. QUERY LANGUAGE AND SERVER-SIDE PROGRAMMABILITY
Azure Data Explorer features a proprietary Kusto Query Language (KQL), that is expressive, and intuitive. KQL supports querying structured, semi-structured, and unstructured(text search) data, all the typical operators of a database query language, typical aggregation and sorting capability, relational query grammar with joins, and hints and more, cross-cluster and cross database queries, and is feature rich from a parsing (json, XML etc) perspective. It supports geospatial analytics and advanced analytics as well.
Azure Data Explorer supports server-side stored functions, continuous ingest and continuous export to Azure Data Lake store. It also supports ingestion time transformations on the server side with update policies, and precomputed scheduled aggregates with materialized views (preview).
Azure Data Explorer with Kusto Query Language capabilities, and its support for ingesting disparate formats, in batch or near real time, allows enterprises to gain insights instantly from data, in its raw form, in previously unthought of ways and proactively, reactively respond. With the server-side capabilities detailed above, Azure Data Explorer supports building common automated analytical application features.
5. ADVANCED ANALYTICS
Azure Data Explorer offers time series capabilities, including a large set of functions from basic element-wise operation (adding, subtracting time series) via filtering, regression, seasonality detection up to anomaly detection and forecasting. Time series functions are optimized for processing thousands of time series in seconds. Azure Data Explorer also offers clustering plugins for pattern detection that are very powerful for diagnosis of anomalies, and root cause analysis. You can extend Azure Data Explorer capabilities by embedding python code in KQL query, leveraging Python open source eco-system for ML, statistics, signal processing and a lot more. Using inline Python you can do in-place machine learning model training, leveraging Azure Data Explorer compute, against data stored within ADX, or train your model anywhere, export it to ADX and use ADX solely for scoring. You can also query ADX from Jupyter/Azure notebooks by using KqlMagic extension from within the notebook. To note, ADX supports ONNX models.
With its support for data science languages and libraries, training and scoring, both in batch and near real time, Azure Data Explorer makes a compelling modern advanced analytics platform.
6. VISUALIZATION
Azure Data Explorer offers visualization out of the box with its Web/Desktop based integrated development environment. It also offers native dashboarding out of the box, with support for a variety of charts, and direct query support. Further, it has native integration with Power BI with support for predicate and projection pushdown and native connectors for Grafana, Kibana and Redash (now Databricks), and ODBC support for Tableau, Sisense, Qlik and more. With KQL used in Jupyter notebooks along with Python, Python visualization libraries can be leveraged as well.
An analytical database platform is incomplete without a complementary and strong visualization story. With its own native dashboarding, charting, and support for popular BI/dashboarding ISV solutions, Azure Data Explorer makes it possible to build visualization rich analytical solutions.
7. AUTOMATED INFORMATION LIFECYCLE MANAGEMENT
Azure Data Explorer offers configurable time duration based hot cache policy with automated eviction upon expiration. It offers configurable time to live/retention policy with automated removal of data upon expiration.
Historical data can be persisted in Azure Data Lake Store, with the “External Table” feature to query via KQL. Azure Data Lake Store offers its own information lifecycle management with tiers, automated retention and archival.
8. SECURITY
Azure Data Explorer offers enterprise grade security and has adoption in security critical industry domains such as healthcare and finance, and governments.
PERIMETER PROTECTION
Azure Data Explorer is a Vnet injectable service and offers a perimeter protection solution with network isolation, with network security group rules and firewall for inbound and outbound access control respectively. It also supports service endpoint to storage to bypass the public internet and optimally route over the Azure backbone.
AUTHENTICATION
Azure Data Explorer supports Azure Active Directory (AAD) authentication out of the box.
AUTHORIZATION
Azure Data Explorer supports access control based on AAD security groups, with Role Based Access Control at a cluster, database, and table row level granularity.
DATA MASKING
Azure Data Explorer supports configurable data masking.
ENCRYPTION
Azure Data Explorer supports it supports encryption over the wire with TLS 1.2 by default, and AES256 bit “at rest” encryption with Microsoft Managed keys (default) or “Bring Your Own Keys” at its durable storage layer (cold cache), with user configurable “at rest” encryption for its hot cache (disks). Intra–cluster shuffle is encrypted with IPSec.
AUDITING
All operations are audited and persisted.
COMPLIANCE CERTIFICATIONS & GDPR
It is rich from a compliance certification perspective and has delete support for GDPR. Information in Azure Data Explorer can be catalogued in Azure Data Catalog to fulfill governance requirements. Azure Data Explorer audit/monitoring data can be ingested into Azure Sentinel or any other SIEM of choice.
9. WORKLOAD ISOLATION AND COST CENTER CHARGEABILITY
Azure Data Explorer supports centralizing ingestion and data engineering in a (leader) cluster and in-place querying federated to follower clusters made possible by Azure Data Share. This simplifies cost center chargeability, and sizing query clusters, preventing resource contention between data engineering and querying workloads with the separate cluster per workload model.
10. DEVELOPER AND OPERATIONS FRIENDLY
Azure Data Explorer has SDKs in C#, Java, Python, Node, R and Go, and a REST interface for management and data operations. From an IDE perspective it offers a Web user interface and a Desktop IDE with built-in powerful intellisense, visualization and query-sharing/collaboration.
Azure Data Explorer offers logging, monitoring, diagnostics and alerting with its Azure Monitor integration. Patching of infrastructure, health monitoring etc are fully managed by the service. Provisioning and deployment automation is simplified through support for Azure DevOps. Due to its managed nature, it does not require a database administrator.
The capabilities detailed above make the service both developer and operations friendly.
11. COST OPTIMIZATION
Azure Data Explorer offers reserved instance pricing, which is cost optimization with a term commitment model. It offers information lifecycle management by automatically evicting expired data from hot cache, and deleting expired data in cold cache as a cost optimization. It offers configurable auto-scale out and scale-in capability to right-size a cluster based on workload in execution. Azure Advisor recommendations are available for optimization of the cluster, including rightsizing. Azure Data Explorer offers a developer SKU and the ability to pause clusters when not in use as further cost optimizations. Review our
12. AVAILABILITY AND DISASTER RECOVERY
Azure Data Explorer is built natively highly available from the ground up, leverages the natively resilient Azure storage for data durability, supports zonal redundancy, and offers an SLA of 99.9% with configurable options for disaster recovery. Azure Data Explorer’s underlying services are provisioned highly available across compute nodes, load balanced as required and are self-healing.
Azure Data Explorer is available in all Azure regions and is one of the foundational services deployed after infrastructure and identity in a region.
For analytical applications that need to be resilient to all manners of failures, Azure Data Explorer is a great fit. Learn more about high availability and disaster recovery in Azure Data Explorer here.
13. AUTOMATION, SCHEDULING & ORCHESTRATION
Azure Data Explorer supports Azure Data Factory, Azure Logic Apps, and Power Automate (previously Microsoft Flow) for data movement/composing business workflows, for scheduling and orchestration.
REFERENCE ARCHITECTURE
RESOURCES

Recent Comments