by Contributed | Jan 20, 2021 | Technology
This article is contributed. See the original author and article here.
There is a growing need for virtual meetings, consults, and appointments but also an increase in the amount of time people are dedicating to try to schedule those appointments. Back and forth phone calls, emails, text messages. Bookings can make it easier, so you can spend more time talking to customers rather than trying to schedule them, and it does it in a secure and integrated way with Microsoft 365.
Microsoft Bookings helps making scheduling and managing appointments easy and seamless. It does this through a web-based booking tool where people have the flexibility to see and book services when it’s convenient for them, it makes it easier to manage staff’s time by integrating with Outlook’s calendar and keeps everyone updated with timely and automatic email confirmations and reminders to reduce no-shows, all these also helps organizations reduce repetitive scheduling tasks.
Bookings is flexible, customizable, secure as it uses a mailbox in Exchange Online, and can be designed to fit scenarios and needs of different parts of an organization.
We have worked with various industries to enable different scenarios. Tele-Health by virtual consultations with doctors through Microsoft Teams, educational classrooms, financial consulting, organizations internal services like legal/IT/HR provided to their employees, candidate interviews, assisted shopping in retail, and government services. To read more on how customers are using Bookings for these scenarios, please click here.
These scenarios demand high scale, to help make sure Bookings works well for you and scale to your needs, we have prepared these best practices.
1. Planning for scale
Each Bookings calendar is currently designed to handle a maximum of 2,500 bookings across all services in that calendar per day, along with a creation limit of 10 booking requests per second, this will work for common scenarios.
If your requirements exceed this, you should plan to distribute the load using the steps below.
- Create a Bookings calendar with just one service.
- Clone this calendar to multiple calendars.
- You can opt-in to the Bookings preview to use a clone option and optout of the preview anytime you want to.
- Limit each calendar for specific audiences, like:
By buildings or operating group
By booking period (mornings only vs afternoons)
- Dividing the load across different Bookings calendars will help ensure none of them will reach the 2,500 limit.
2. Set how far in advance your customers can book an appointment
Finding the optimal value for the maximum advance appointment time your customers can book can help prioritize the daily limits for appointments that are closer to “today”. We have attached a simple Excel spreadsheet where you can enter the values to help you estimate the number of appointments and forward-looking time you can have in your Bookings calendar.
Follow the instructions below to use the attached spreadsheet.
- Calculating the maximum advance appointment time in which those 2,500 appointments could be achieved.
- Open the booking availability timeframe only for that period of time.
- Keep updating the timeframe once the slots are full or a day has passed, so people will always have the option to book up to the same timeframe in advance.
If you got confused (don’t worry, we did too), below is an example. This example is calculated at the calendar level, not at the service level.
- If the appointment duration is 10 minutes, and the maximum number of working hours are 8, then the possible number of appointments/day will be 8*60/10. This means up to 48 appointments per staff member, assuming you don’t need buffer time between appointments.
- If we consider 5 staff members per booking calendar, the max number of appointments you can have in a workday will be 240.
- Considering that opening more than 2,500 slots will throttle the system, then the ability to book a service shouldn’t be opened for more than 2500/240 = ~10.5 days
- Assuming a 5-day week, do not let your customers book appointments 2 weeks before the current date (I.e. today). This will ensure that your customers can always book an appointment
- You can choose to move the booking timeframe every day to always have a 2 week pre-booking time or do it when your bookings are filling up.
We are actively working to increase the scaling limits as you read this and we will post a new communication as soon as our systems are updated.
As always, please let us know if you have any feedback in our UserVoice channel.
Thank you!
Gabriel on behalf of the Bookings team
by Contributed | Jan 20, 2021 | Technology
This article is contributed. See the original author and article here.
Built-In Service Bus Trigger: batched message processing and session handling
Logic App Refresh preview provides us with the option to create a built-in S trigger to receive messages from Service Bus topic or queue.
In this blog post two advanced Service Bus message processing are discussed:
- Azure Service Bus batch processing and how to configure the max batch count of messages.
- Messages processing in Logic App for the session-aware Service Bus queues or subscriptions.
Service Bus queue batch processing:
To improve the message retrieval performance for Service Bus queue, it is highly recommended to receive the messages in batch. The Logic App Service Bus trigger for queue by default supports array of Service Bus messages as output.
The prefetchCount is used to specify how many messages should be retrieved in a “batch” to save the roundtrips from Logic Apps back to the Azure Service Bus. Prefetching messages increases the overall throughput for a queue by reducing the overall number of message operations, or round trips.
The prefetchCount can be configured in the global configuration settings in host.json, the Azure function trigger requests these many messages for the Azure Function.
{
    "version": "2.0",
    "extensions": {
        "serviceBus": {
            "prefetchCount": 20,
            "messageHandlerOptions": {
                "autoComplete": true,
                "maxConcurrentCalls": 32,
                "maxAutoRenewDuration": "00:05:00"
            }
The host.json can be edited using Kudu Advance tool (in case the Logic App is created in Azure Portal).

Message processing for session-aware service bus queue/subscriptions:
You can enable the session by selecting the Enable sessions checkbox while creating the Service Bus queue in UI :

In the session-aware Service Bus queue the built-in Service Bus trigger cannot receive the message by default. The sessions are not enabled for Service Bus trigger by default.
The Azure Service Bus trigger is based upon Azure Function ServiceBusTrigger binding configuration of Azure function, the isSessionsEnabled configuration needs to set for it to enable the session processing. This option can be handled in the logic app code definition as given below:
        "triggers": {
            "When_messages_are_available_in_Service_Bus_queue": {
                "inputs": {
                    "parameters": {
                        "isSessionsEnabled": true,
                        "queueName": "psrivassbq5"
                    }
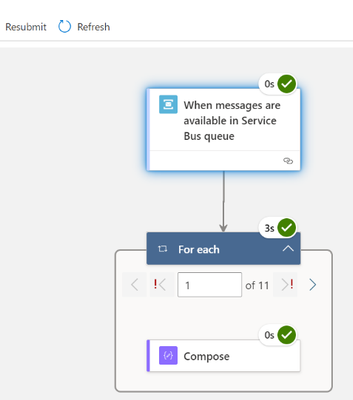
Once you update the Logic App definition you can view this in the designer as shown below. However, the isSessionsEnabled trigger input option cannot be configured on the designer surface. The input option IsSessionEnabled in UI will be provided in the Logic App Refresh future release.

When the messages are queued in Service Bus session queue, it will trigger the Service Bus trigger based upon sessions in Service Bus queue. You can use the SessionId property from Service Bus trigger output.

by Contributed | Jan 20, 2021 | Technology
This article is contributed. See the original author and article here.
Today, we received a new service request that our customer wants to connect from Oracle to Azure SQL Managed Instance or Azure SQL Database using Oracle Database Gateway for ODBC using a Windows Operating system.
Following, I would like to share with you the steps that we’ve done:
First Step: Installation and Configuration of the different components:
1) Oracle Database Gateway for ODBC
- Install it defining a new listener using the port, for example, 1528.
- I modified the listerner.ora adding the following text:
SID_LIST_LISTENER_ODBC =
  (SID_LIST =
    (SID_DESC=
       (SID_NAME=dg4odbc)
       (ORACLE_HOME=C:apptgusernameproduct19.0.0tghome_2)
       (PROGRAM=dg4odbc)
    )
  )
- The final result of listener.ora file looks like:
# listener.ora Network Configuration File: C:apptgusernameproduct19.0.0tghome_2NETWORKADMINlistener.ora
# Generated by Oracle configuration tools.

LISTENER_ODBC =
  (DESCRIPTION_LIST =
    (DESCRIPTION =
      (ADDRESS = (PROTOCOL = TCP)(HOST = localhost)(PORT = 1528))
      (ADDRESS = (PROTOCOL = IPC)(KEY = EXTPROC1528))
    )
  )

SID_LIST_LISTENER_ODBC =
  (SID_LIST =
    (SID_DESC=
       (SID_NAME=dg4odbc)
       (ORACLE_HOME=C:apptgusernameproduct19.0.0tghome_2)
       (PROGRAM=dg4odbc)
    )
  )
- I restarted the listener for this specific Oracle Instance.
2) I modified the tnsnames.ora adding the following text:
dg4odbc =
  (DESCRIPTION=
    (ADDRESS=(PROTOCOL=tcp)(HOST=localhost)(PORT=1528))
    (CONNECT_DATA=(SID=dg4odbc))
    (HS=OK)
  )
3) I re-started the listener.
4) I modified the file placed on <oracle_home_folder>admin subfolder on your Oracle Home Installation with the following parameters:
# This is a sample agent init file that contains the HS parameters that are
# needed for the Database Gateway for ODBC

#
# HS init parameters
#
HS_FDS_CONNECT_INFO = dg4odbc
HS_FDS_TRACE_LEVEL = OFF


#
# Environment variables required for the non-Oracle system
#
#set <envvar>=<value>
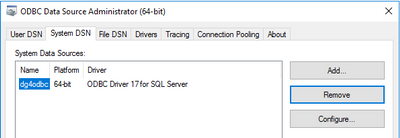
5) The parameter of the previous file HS_FDS_CONNECT_INFO contains the name of the Data Source Name that we are going to use to connect. So, in this situation, using ODBC Data Source Administrator (64-Bit) I defined the following data source parameters:
- Name: dg4odbc
- Server: The name of my public instance name

- SQL Server Authentication.

- Database Name that I want to connect.

Second Step: Test the connectivity and run a sample query.
- Open a new Windows Command Prompt, I run sqlplus to connect to any instance of Oracle that I have: sqlplus system/MyPassword!@OracleInstance as sysdba
- I created a database link to connect using ODBC to my Azure SQL Managed Instance
create database link my4 connect to "myuserName" identified by "MyPassword!" using 'dg4odbc';
- Finally, I executed the following query to obtain data from the table customers making a reference of this database link:
select * from customers@my4;
As I mentioned before this configuration process works, also, connecting to Azure SQL Database.
Enjoy!
by Contributed | Jan 20, 2021 | Technology
This article is contributed. See the original author and article here.
As part of our recent Azure Security Center (ASC) Blog Series, we are diving into the different controls within ASC’s Secure Score. In this post we will be discussing the control of Enable audit and logging.
Log collection is a relevant input when analyzing a security incident, business concern or even a suspicious security event. It can be helpful to create baselines and to better understand behaviors, tendencies, and more.
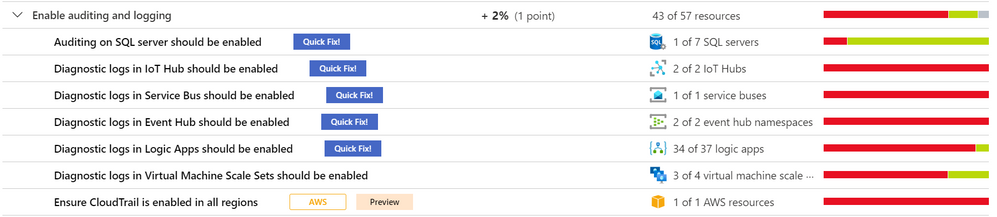
The security control enable auditing and logging, contains recommendations that will remind you to enable logging for all Azure services supported by Azure Security Center and resources in other cloud providers, such as AWS and GCP (currently in preview). Upon the remediation of all these recommendations, you will gain a 1% increase in your Secure Score.
Recommendations
The number of recommendations will vary according to the available resources in your subscription. This blog post will focus on some recommendations for SQL Server, IoT Hub, Service Bus, Event Hub, Logic App, VM Scale Set, Key Vault, AWS and GCP.
Auditing on SQL Server should be enabled
Enable auditing is suggested to track database activities. To remediate, ASC has a Quick Fix button that will change the Microsoft.Sql/servers/auditingSettings property state to Enabled. The logic app will request the retention days and the storage account where the audit will be saved. The storage account can be created during that process, the template is in this article. Nonetheless, there is also a manual remediation described in the Remediation Steps. The recommendation can be Enforced, so that Azure policy’s DeployIfNotExist automatically remediates non-compliant resources upon creation. More information about Enforce/Deny can be found here. To learn more about auditing capabilities in SQL, read this article.

Diagnostic logs in IoT Hub should be enabled
This enables you to recreate activity trails for investigation purposes when a security incident occurs or your IOT Hub is compromised. The recommendation can be Enforced and it also comes with a Quick Fix where a Logic App modifies the Microsoft.Devices/IotHubs/providers/diagnosticSettings Metrics AllMetrics and the Logs Connections, DeviceTelemetry, C2DCommands, DeviceIdentityOperations, FileUploadOperations, Routes, D2CTwinOperations, C2DTwinOperations, TwinQueries, JobsOperations, DirectMethods, DistributedTracing, Configurations, DeviceStreams to “enabled”: true. To learn more about Monitoring Azure IoT Hub visit this article.
Diagnostic logs in Service Bus should be enabled
This recommendation can be Enforced, and it has a Quick Fix that will remediate the selected resources by modifying Microsoft.ServiceBus/namespaces/providers/diagnosticSettings “All Metrics” and “OperationalLogs” to “enabled”: true. It is necessary to put the retention days to deploy the Logic App. To manually remediate it, follow this article. To learn more about the Service Bus security baseline, read this article.
Diagnostic logs in Event Hub should be enabled
The Quick Fix has a Logic App that will modify for selected resources the Microsoft.EventHub/namespaces/providers/diagnosticSettings metrics AllMetrics and the logs ArchiveLogs, OperationalLogs, AutoScaleLogs to “enabled”: true, with the retention days input. This recommendation can be Enforced. For manual remediation steps, visit this article. To learn more about the Event Hub security baseline, read this article.
Diagnostic logs in Logic Apps should be enabled
The recommendation can be Enforced and it comes with a Quick Fix where a Logic App modifies the Microsoft.Logic/workflows/providers/diagnosticSettings metrics “AllMetrics” and logs “WorkflowRuntime” to “enabled”: true. The retention days field has to be input at the beginning of the remediation. For manual remediation steps, visit this article. To learn more about Logic Apps monitoring in ASC, read this article.
Diagnostic logs in Virtual Machine Scale Sets should be enabled
This specific recommendation does not come with the Enforce feature nor a Quick Fix. To configure the Azure Virtual Machine Scale Set diagnostics extension follow this document. The command az vmss diagnostics set will enable diagnostics on a VMSS. To learn more about the Azure security baseline for Virtual Machine Scale Sets, read this article.
Diagnostic logs in Key Vault should be enabled
The recommendation can be Enforced and it also comes with a Quick Fix where the Logic App goes to the resource Microsoft.KeyVault/vaults/providers/diagnosticSettings and sets the metrics AllMetrics and logs AuditEvent to “enabled”: true including the retention days input. For manual remediation steps, read this article. To learn more about monitoring and alerting in Azure Key Vault, visit this article.
Ensure a log metric filter and alarm exist for security group changes – AWS Preview
By directing CloudTrail Logs to CloudWatch Logs real-time monitoring of API calls can be achieved. Metric filter and alarm should be established for changes to Security Groups. Recommendations for AWS resources do not have the Enforce feature, Quick Fix button, Trigger Logic App. To remediate them, follow the AWS Security Hub documentation.

Ensure that Cloud Audit Logging is configured properly across all services and all users from a project – GCP Preview
Ensure that Cloud Audit Logging is configured to track read and write activities across all supported services and for all users. Configured this way, all administrative activities, or attempts to access user data, will be tracked. Recommendations for GCP resources do not have the Enforce feature, Quick Fix button, Trigger Logic App. To remediate them, follow the Manual Remediation Steps. For more information, visit the GCP documentation.

Reviewer
Yuri Diogenes, Principal Program Manager (@Yuri Diogenes)
by Contributed | Jan 20, 2021 | Technology
This article is contributed. See the original author and article here.
One of the biggest challenges to IO demands on an Oracle on Azure VM is when customers continue to utilize streaming backup technology like RMAN or import/exports via DataPump in the cloud. Although it shouldn’t come as a surprise, these two technologies can often be the biggest consumers of IO- more than overall batch or transactional processing.
One of the reasons customers migrate to the cloud is the benefit to share infrastructure resources and features at a lower cost, but with sharing those resources, no one wants to be the noisy neighbor. Azure, as with other cloud providers, ensures that a VM can’t be the noisy neighbor by spreading workloads for a VM across hardware and setting limits per VM series and size.
Heavy Cost of Archaic Backups
With this understanding, it is important to know that backups, both physical and logical, can be the main contributor to IO throttling on a VM. When this occurs, the workload has hit the threshold for how much IO is allowed, either for storage or network and latency occurs. One of the best ways to avoid this is to rethink how we backup up Oracle VMs in the cloud.
Snapshots can be a powerful tool and many organizations have already embraced this technology, but if you have not, there are definite benefits:
- Extensively less IO requirements to take a storage level snapshot.
- Faster Recovery times.
- Simpler cloning process for databases and multi-tier environments.
- A cost-effective backup solution since storage snapshots are inherently incremental.
Azure Backup Snapshots for Oracle
This brings me to Azure Backups private preview for Oracle snapshots. For those customers who want a single pane of glass for their backups, you can now use the same Azure backup for your Oracle databases running on IaaS VMs just as you do for other Azure cloud services.
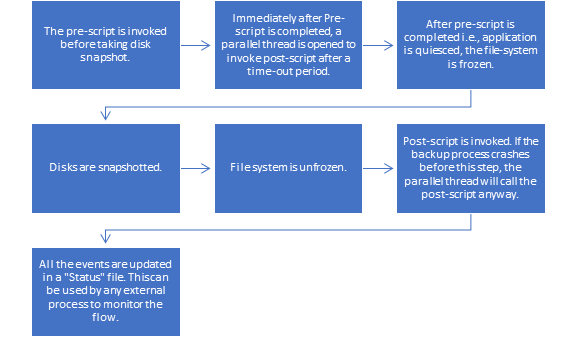
Azure Backup for Oracle works with Oracle, setting the environment, quiescing the database, taking a snapshot and then releasing the database, to then complete the rest of its work behind the scenes. The workflow for the backup pre-script/snapshot/post-script is as follows:
Snapshots can be configured on a daily basis or more often, but recognize that while the volume is restored to the time of the snapshot, the database remains in a recovery state and can be rolled forward using the RECOVER AUTOMATIC DATABASE with archive logs to any point in time to eliminate data loss. If just using the snapshot to refresh a development or test environment, a snapshot recovery can be done in a matter of minutes to the time of the snapshot, refreshing data without the extensive time or work that is required with more traditional methods of cloning.
Of course, this will require archive logs be copied with a custom solution to be used to recover if a Point in Time, (PiT) recovery is desired. I haven’t met a DBA yet who doesn’t have a shell script or other process to copy their archive logs to secondary storage to protect these valuable assets and with Azure snapshots for Oracle, this should be an additional step for anyone wanting to do more than just recover from a snapshot of a volume. Most customers, depending on the amount and size of archive logs, choose to copy to blob, NFS or AFS. Without this secondary step, only the archive logs that existed at the time of the snapshot locally will exist for recovery purposes.
Options for Data Refreshes
For customers that have used Oracle Datapump for data refreshes, this often required a full export of the database performed on a regular basis, consuming significant resources on a cloud VM. With an Azure backup snapshot of the storage, a clone can be created and using this clone, an object copy can be performed instead of standard datapump export/import. This can also be used to perform a transportable tablespace import without the resource demands to preemptively export data every night from the database, freeing up resources for batch and transaction processing.
With this shift, there is less worry about having to scale up a VM unless its for right reasons- like due to data acquisition or business and revenue increase. Costs are decreased on the storage side that were once used by physical datafile copies in exchange for snapshots, which on average use considerably less storage space. When focusing on Oracle, backup storage can be important as these databases are often some of the largest in the relational database world.
If you’d like to learn more about using Azure Backup to take snapshots of Oracle workloads on Azure, check out the following link.
by Contributed | Jan 20, 2021 | Technology
This article is contributed. See the original author and article here.
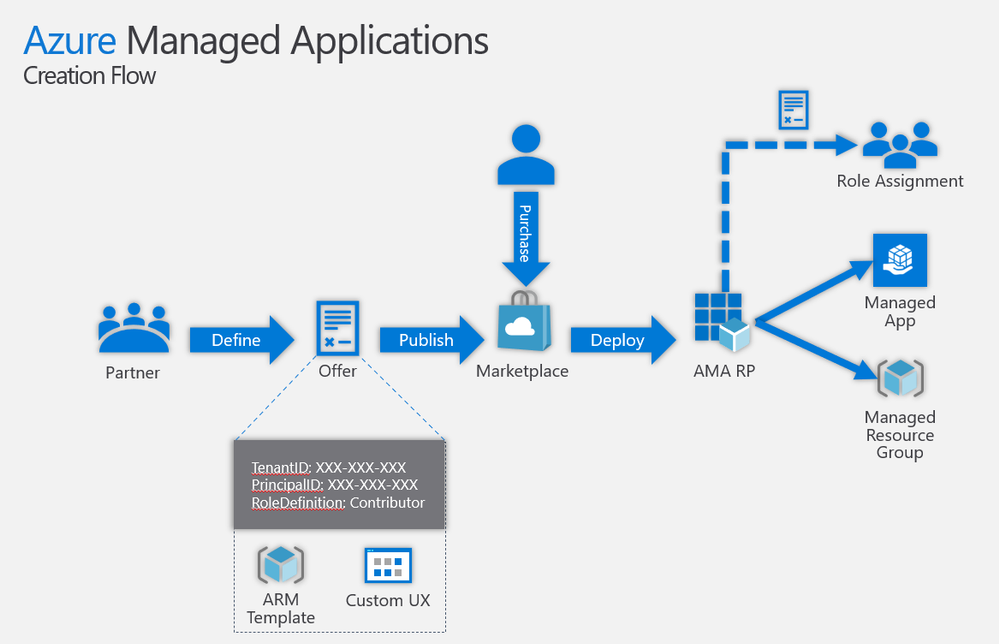
In the following two videos, we look at how to create and test a simple “Hello World”-style Azure Managed Application in the developer’s Azure subscription, and how to publish the same application in the Partner Center and deploy its “preview” in an end-customer Azure subscription under a different Azure Active Directory tenant.
In subsequent videos, we may go deeper and look at Azure Managed Application that includes an AKS resource, managed identities, deployment-time role assignments, etc.
You can see the sample code used in the videos below here.
Important: When building your Azure Application ARM templates for submission to Azure Marketplace, please make sure to carefully follow all of the guidelines and best practices described here and be ready to make fixes and changes based on manual review feedback.
Video #1: Creating and testing a simple Azure Managed Application in the developer’s Azure subscription
Tip: Play the video full screen to see all of the details.
Video #2: Publishing Azure Managed App in Partner Center and testing in end-customer’s Azure subscription
Tip: Play the video full screen to see all of the details.
Dive Deeper
If you want to dive deeper into an experimental scenario, see related article “Azure Managed Application with AKS and deployment-time or cross-tenant role assignments to VM and Pod Managed Identities”.
Originally published at https://arsenvlad.medium.com/simple-azure-managed-application-creating-testing-and-publishing-in-partner-center-d2cb3b98bed2 on September 15, 2020.
by Contributed | Jan 20, 2021 | Technology
This article is contributed. See the original author and article here.
Introduction
Do you have a large performance-sensitive SAP HANA footprint in Microsoft Azure? Are you looking to leverage SAP’s native resilience solution? Is operational flexibility at the top of your mind? If so, then look no further. This blog covers and answers the above-mentioned questions with Microsoft’s newer (since May 2019) PaaS storage service in partnership with NetApp, called Azure NetApp Files (ANF). While providing bare-metal performance with sub-millisecond latency and unparallel operational flexibility, the service also opens the door for its customers to leverage the SAP HANA’s native high-availability feature for N+M scale-out architecture, called ‘host auto-failover’, thanks to NFS v4.1 support on ANF.
In this blog series, I will focus on the technical execution aspects of running SAP HANA scale-out N+M on Azure NetApp Files from a Solution Architect’s point-of-view. More specifically, I will focus on how a solution architect would design, build, and operate the infrastructure, backup/recovery, and HA/DR components for a 2+1 scale-out scenario running on RHEL OS. I will not focus on the application tier, neither will I focus on other cloud foundational elements. This blog series would also pique interests of Operations Architects, Database Administrators, and the likes. This series is broken up into multiple publications to cover the journey step by step. This part, Part 1, covers the overall solution overview and the base infrastructure design and build. Part 2 will cover the backup/recover, and Part 3 will cover the HA/DR component. Let’s get to it.
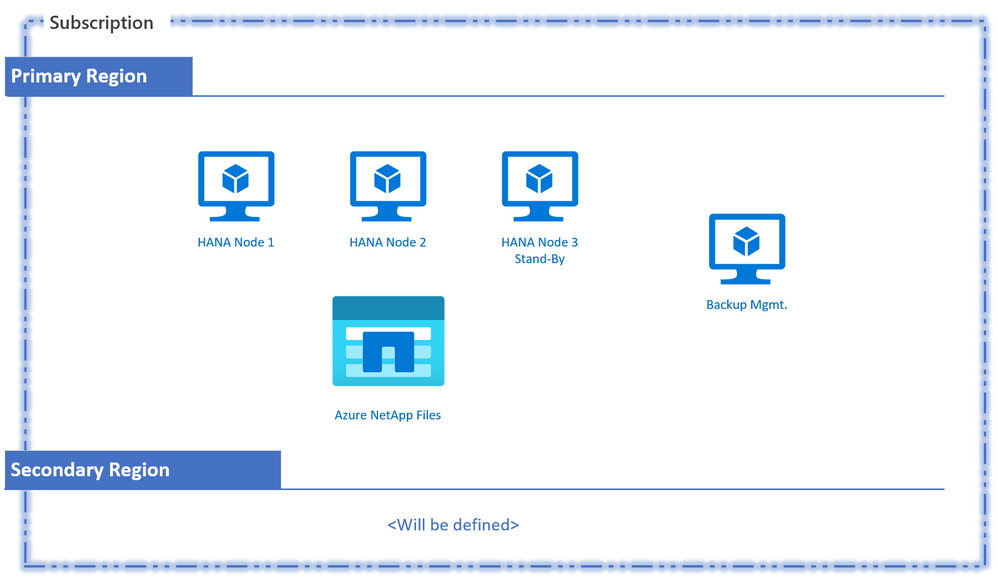
Solution Overview
The key architectural components of this scenario include multiple SAP HANA nodes that are set up as one scale-out system. The required shared storage for this setup would come from Azure NetApp Files, with NFS v4.1 selected as the protocol of choice. There will be an additional virtual machine to provide a centralized automatic backup management capability utilizing a new-to-ANF tool called “azacsnap” (in preview). A pseudo diagram to capture this high-level solution would look something like this:
Pseudo Design Diagram
We will now take this initial diagram and transform it through the three phases of solution designing and building across the solution components (base infrastructure, backup and HA/DR). These phases of solution designing are:
- Assess/Plan
- Design
- Build/Operate
Note: The intention throughout the blog is to cover a solution architect view to designing and building the solution in a more thought-provoking manner, and to compliment already available well-crafted MS Docs and NetApp documentation on this topic. I will cover key highlights from these documentations, and where necessary, will also augment additional detail in this blog to cover more surface area.
Assess/Plan – Infrastructure, Backup/Recovery and HA/DR
The criticality of assessing and planning for a major technical solution cannot be overstated. While the Cloud is synonymous with flexibility, the price of remediating certain elements of the architecture, to accommodate for the requirements that fell through the crack during discovery, could be costly. Therefore, take your time in making decisions around foundational elements of SAP landing zone such as subscription design, network design, HANA scaling architecture etc. It is much harder to retrofit them especially when you have an active infrastructure. Taking time in planning and assessing goes a long way. This solution is no exception. Let’s look at some of the key points of planning:
- SAP landing zone/cloud foundation planning: The planning for the cloud foundational elements is not in scope for this blog. Let’s assume standard SAP landing zone components are already in place.
- SAP HANA architecture planning: The architecture planning for SAP HANA is also assumed to have been completed, alongside the decision to select ANF as the shared storage choice for the architecture.
- Single versus multiple subscriptions: It is important to know the high-level Disaster Recovery (DR) solution for this setup could drive the subscription requirement for the SAP landing zone planning. As of now, the ANF Cross Region Replication (CRR) only supports replication within the same subscription. If you intend to use CRR as the DR solution over SAP HANA System Replication, then you must use one subscription. ANF team brings expansion to existing features set and relaxation to existing limitations on a regular basis, so be sure to validate this at the time of planning.
- Region selection: ANF service availability, ANF CRR region pairing and SAP HANA VM SKU selection are among the key factors in deciding the regions of choice for primary operations and disaster recovery.
- Number of ANF accounts: An ANF account is an administrative layer with a regional scope that holds one or more storage pools. Creating an account per region will give you the most flexibility from system restore and environment refresh purposes. You will not be able to create a copy of an ANF volume outside its associated storage pool.
- Networking: ANF requires a delegated subnet per VNET. A /28 with 11 usable IP addresses is sufficient. Also, you cannot apply NSGs or UDRs on this subnet.
- High-Availability: The ANF service is a PaaS service and the resilience is already baked in. However, we will need high-availability for SAP HANA DB. Since we are covering the N+M scenario, the high-availability is provided by the native HA feature called Host Auto-failover. This means an additional same size HANA VM is needed as a stand-by and a distinct storage configuration to support this scenario. Also, plan on placing them in an availability set (AS) associated with a proximity placement group (PPG). Why? See the next point:
- Minimizing latency: In addition to leveraging PPG/AS to bring App and DB closer, we will also use PPG/AS to manually pin the ANF resources closer to HANA Databases. This is a manual backend process and needs to be coordinated with Microsoft support team.
- Backup Offloading: Will you be using ANF snapshots for HANA backups? If so, do you have a requirement to provide additional redundancy and protection to ANF snapshots? This is surely not a must due to already available redundancy in ANF and the security layers you could leverage at VNET, AAD/RBAC and OS levels etc. However, should you have such a requirement, you will need to invest in a secure storage account for offloading backups and for keeping redundant full copies.
- Security: For this scenario, the recommendation is to use NFS v4.1 as the protocol for all SAP HANA volumes. Besides the restriction on the delegated subnet, your VNET overall can have the desired enterprise-scale security protocols. You can also apply all the recommended OS-level security for Linux as well as application-level security for the HANA DB. You can control the access to the ANF PaaS service via RBAC. Keep in mind that if you are planning to automate scheduling of the database snapshots, we will need to allow outbound access to publicly available Azure APIs. This is needed for the automation and orchestration software, azacsnap, to be able to access Azure AD via a service principal to interact with the ANF service.
- ANF Storage Capacity Planning: We will need the sizing estimate for SAP HANA DB. In addition, a high-level backup policy (backup scope, frequency, retention) and offloading/offsite requirements is also required. Finally, we will need to leverage the different performance tiers – ultra, premium, and standard to balance the cost and performance need for each of the volumes.
- Available ANF Features: ANF product team has a great customer feedback cycle, and as a result, the ANF service is refreshed regularly with feedback-resulted features. Be sure to check what’s new in ANF world and assess whether you would like to add any of the latest and greatest feature to your design.
Next, we will take this assessment and the key findings into the design phase. We will design the base infrastructure first, and then will design the backup/restore and HA/DR components on top of it.
Design – Base Infrastructure

Network
- This design includes a single VNET for both Prod and Non-Prod. However, the other options include:
- You could have created two or more VNETs for segregation with each VNET to have volumes associated with a separate ANF account, but that would restrict the environment refresh across VNETs.
- Another option would be to place ANF volumes in one VNET and provision them to clients in all the peered VNETs. Account for minor to negligible latency here due to peering. Also keep in mind the transit routing restriction with the VNET peering.
- A slight variation to the above, you could create an ANF delegated subnet per VNET, create volumes in each of the subnets and provision the volumes to the clients in the respective VNETs. It is still all under the same ANF account.
- Each VNET receiving the ANF volumes must have one and only one delegated subnet dedicated for ANF. If you try to deploy to another delegated ANF subnet within the same VNET, you will get an error like this:

- A delegated subnet /28 delegated is sufficient for most cases. For a very large deployment, say 12+ scale-out nodes running on very large Mv2s, you may need a bigger subnet to maximize performance with concurrent unique network paths to ANF.
- The management VM will need an SPN authentication using Azure public APIs. You will need an outbound access to azure APIs as stated.
- Attach three NICs per HANA node for segregating the client, inter-node and ANF storage communications. This will not triple the network performance on the VM.
Compute
- Two HANA Scale-out nodes plus the stand-by node in the DB or equivalent subnet. You can increase the count per your requirement. The VM SKUs, chosen to meet the HANA sizing requirement, must be supported by SAP. Check out the SAP Note 1928533 for more information.
- Associate HANA DB VMs with an availability set tied to a PPG.
- A Backup Management VM in a separate subnet for isolation. A D2s/D4s would do just fine. Also, we don’t need a data disk on this VM for this scenario.
Storage – Azure NetApp Files
- An ANF Account per region: A single account in the region will streamline the environment refresh for lower environments in the region.
- An Ultra storage pool and a premium storage pool: The Ultra pool would hold hana data and log volumes, while the premium would hold the rest. If you are concerned about reaching the 500TB maximum size limit of the pool, then create a pair of Ultra and Premium pools for each of the SAP landscapes. For example:
BW: Pool 1: Ultra Pool , Pool 2: Premium Pool
CAR: Pool 3: Ultra Pool, Pool 4: Premium Pool
And so on
This setup would enable both the needed scalability and the ability to perform lower environment system refreshes.
- Volume size as a function of HANA memory: Follow the typical sizing approach for SAP HANA but stay above the minimum size as mentioned below to stay to meet the minimum performance guidelines. The details are in MS Docs – HANA storage configurations with ANF
Volume
|
Est. Sizing
|
Storage Pool Service Level
|
Min. throughput requirement from SAP
|
NFS protocol
|
/hana/data
|
1.2 x Net Disk Space
AND
>3.2TB Ultra
OR
>6.3TB Premium
|
Ultra/
Premium
|
Read activity of at least 400 MB/s for /hana/data for 16-MB and 64-MB I/O sizes.
Write activity of at least 250 MB/s for /hana/data with 16-MB and 64-MB I/O sizes.
|
v4.1
|
/hana/log
|
1 x Memory
AND
>2TB Ultra
OR
>4TB Premium
|
Ultra/
Premium
|
Read-write on /hana/log of 250 megabytes per second (MB/s) with 1-MB I/O sizes.
|
v4.1
|
/hana/shared
|
1 x Memory every 4 nodes
|
Premium
|
|
v4.1 (or v3)
|
/usr/sap
|
50 GB
|
Premium
|
|
v4.1 (or v3)
|
/backup/log
|
For log backups (change default location)
|
Premium
|
|
v4.1 (or v3)
|
/backup/data
|
Optional for file-level native backups
|
Premium
|
|
v4.1 (or v3)
|
As an example, the volume sizes for 2+1 M128s (2TB) would look like this:
Volume
|
Est. Sizing
|
Service Level
|
NFS protocol
|
/hana/data/<SID>/mnt00001
|
3.2 TB
|
Ultra
|
v4.1
|
/hana/data/<SID>/mnt00002
|
3.2 TB
|
Ultra
|
v4.1
|
/hana/log/<SID>/mnt00001
|
2 TB
|
Ultra
|
v4.1
|
/hana/log/<SID>/mnt00002
|
2 TB
|
Ultra
|
v4.1
|
/hana/shared
/usr/sap for Node 1
/usr/sap for Node 2
/usr/sap for Node 3
|
2 TB
50 GB
50 GB
50 GB
|
Premium
|
v4.1
|
/backup/log
|
2 TB (varies per log retention and performance requirements)
|
Premium/
Standard*
|
v4.1
|
/backup/data
|
6 TB (varies per backup size and performance requirements)
|
Premium/
Standard*
|
v4.1
|
*Note:
- I encourage to perform benchmark tests to validate the experienced throughput at the OS layer and adjust the volume throughput accordingly per the application’s requirement.
- Due to the throughput restriction of 1.2 – 1.4 GB/s for a LIF in a single TCP session, the throughput experienced at the OS layer hits the ceiling around 15 TB for a Ultra SKU volume and 40 TB for a Premium SKU Volume. Consider using a lower tier in this situation.
- The flexibility of dynamically changing the service level enables you to switch these volumes from one tier to another. Changes in size requirement or performance could result in exercising this option.
- You could choose NFS v3 for volumes other than data and log, but we will keep v4.1 in this scenario for consistency.
- OS Managed Disk: We will use premium managed for the OS disk. There is no additional data disk requirement for this scenario.
Build – Base infrastructure
The steps to build a similar architecture is well laid out in MS Docs, therefore I will not repeat them here. With this MS Doc guide, the details in the design section and the below anecdotal comments, you have enough ammunition for the build phase:
Network
- The delegated subnet is needed when we are ready to create the volumes.
- On a restrictive subnet, the outbound internet access to management URLs can be achieved by configuring an outbound rule on a dedicated public load balancer, or by configuring the outbound connectivity in Azure Firewall or in a third-party firewall.
Compute
- The anchor VM, usually the DB VM, goes first in the deployment to pin the infrastructure.
- You may run into a problem when mounting an azure storage files onto the RHEL Linux system and get an error like this:

Install cifs-utils program “yum install cifs-utils” and then try again.
- When installing SAP HANA, you may face installation errors pointing to missing modules, if so then install the following and try again: yum install libtool-ltdl
Storage
- For complex workloads, to ensure sub millisecond latency to the storage, you may need Microsoft’s assistance in performing a backend manual pinning for the ANF storage to be laid out closer to the compute units. To do that, the key information you will need to provide to the support team would be the empty Availability Set, PPG and the empty storage pool. Once the pinning is done, you are good to proceed with the infrastructure provisioning.
- For large VMs in a scale-out, depending on the environment size, performance requirement and the environment priority, you may also need to use a dedicate logical network interfaces (LIF) for each of the data and log volumes. This is also done manually today and with the help of the support team. For this 2+1 scale-out scenario, an example LIFS pinning would look like this:
IP1 à data mnt 1, IP2 à log mnt 1
IP2 à data mnt 2, IP1 à log mnt 2
This helps enabling two unique paths from each of the nodes down to the ANF volume.
Conclusion and What’s next
This concludes the first part of the blog series. Now that we have the base infrastructure, we will focus on backup/recover and HA/DR in the upcoming parts of this series. Stay tuned.
Reference
by Contributed | Jan 20, 2021 | Technology
This article is contributed. See the original author and article here.
Hi Team, it’s Eric Jansen again, here today to continue where we left off in Part 3 of the series. In the last episode, we discussed how to parse the DNS Analytical Log using a sample scenario where I’ve deployed a DNS Black Hole Solution, and my goal was to harvest specific data of interest. Today we are going to take the data that we previously collected and report our findings. I wanted to talk about this because I’ve seen a number of customers employ DNS block lists as a security measure, but they don’t look to see what’s getting blocked, which I find somewhat shocking. If you don’t check to see what’s actually being blocked, other than the occasional end user complaining that they can’t get to something, how would you know if the block list is providing any value at all?
There are many ways to report the data of interest but today I’m going to show a simple means to do some basic reporting, writing just the data that you care about to, to its own event log. We’ll take the millions of events that we parsed through in the last part of this series and simply report the findings in just a handful of ‘higher level’ (arguably more useful) events, while still giving you the ability to find any of the more specific data that you’re interested in.
Note: For the ease of discussion, I’m taking small snips of code from a much larger function that I’ve written (where additional events are parsed) and showing just the necessary info in the code blocks below for ease of discussion. In some cases, I’m changing the code from the function so that it makes more sense when seen independently. Towards the end of this series, I’ll likely post all of the complete functions to a GitHub repository for folks to use.
And with that, here’s the usual disclaimer that all my code samples come with:
The code snippets above are considered sample scripts. Sample scripts are not supported under any Microsoft standard support program or service. The sample scripts are provided AS IS without warranty of any kind. Microsoft further disclaims all implied warranties including, without limitation, any implied warranties of merchantability or of fitness for a particular purpose. The entire risk arising out of the use or performance of the sample scripts and documentation remains with you. In no event shall Microsoft, its authors, or anyone else involved in the creation, production, or delivery of the scripts be liable for any damages whatsoever (including, without limitation, damages for loss of business profits, business interruption, loss of business information, or other pecuniary loss) arising out of the use of or inability to use the sample scripts or documentation, even if Microsoft has been advised of the possibility of such damages.
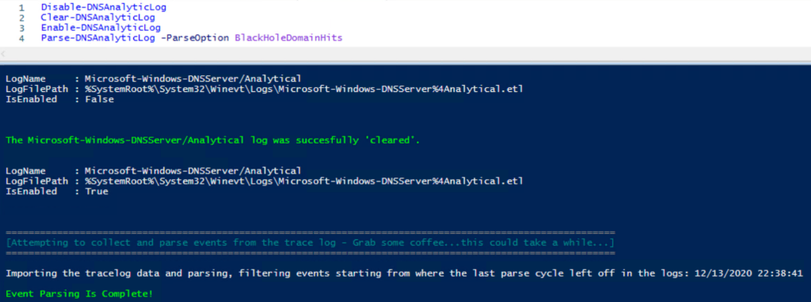
Ok, so in the last episode, we ran some snippets of code, which resulted in data being stored in a variable called $HitData. That variable contained query data that was blocked by the server as a result of DNS policy. The first thing that we’re going to do is create a new event log to put this ‘data of interest’ into:
#Create custom Event Log for parsed DNS Analytic data.

$CustomEventlogName = "DNS-Server-AnalyticLog-ParseData"
$EventSource_PAL = "Parse-AnalyticLog"
$EventSource_DD = "DENIED_Domains"
New-EventLog -LogName $CustomEventlogName -Source $EventSource_PAL,$EventSource_DD
The snippet above creates a new Event log called DNS-Server-AnalyticLog–ParseData, defining two event sources, that we’ll be using later on. Our mission now is to extract that data into even more ‘boiled down’ higher level info. To do that we’re going to pick and choose the data that we want out of $HitData for building messages to write to our shiny new custom event log. Here’s a sample of how we can get that done:
#If hits are found, process them.
If($HitData){

    #Defines the a .csv log file path for ALL hit data to be dumped to. Ideally this would be ingested into SQL.
    $CSVLogFilePath = "D:Logs$($ENV:COMPUTERNAME)_BHDomainHits_$(Get-Date -Format "ddMMMyyyy_HHmm").csv"

    $HitData | sort timestamp | Export-Csv $CSVLogFilePath -NoTypeInformation

    #Variable containing the higher level information of interest.
    $Message += "The HitData has been sorted and dumped to $($CSVLogFilePath).`n" | Out-String

    #Collect QRP Count for use in calculating the percentage of blocked domains that are hit.
    $QRPCount = (Get-item 'HKLM:SOFTWAREMicrosoftWindows NTCurrentVersionDNS ServerPolicies').SubKeyCount

    #Sorts EventID 258 data.
    $258HitData = $HitData | where EventID -eq 258
    $Unique258Queries = $258HitData | sort XID -Unique | select -ExpandProperty XID
    $Unique258Domains = $258HitData | sort Query -Unique | select -ExpandProperty Query
    $Unique258QuerySources = $258HitData | sort QuerySource -Unique| select QuerySource

    $UQCount = $Unique258Queries.count
    $UDCount = $Unique258Domains.count
    $UQSCount = $Unique258QuerySources.count

    #If there are 258 events that were a result of 'Policy', the 'high level' findings breakdown is output to the DNS-Server-AnalyticLog-ParseData event log, in event ID 2.
    $Message += "There were $($j) RESPONSE_FAILURE events; out of those there were $l that were not a result of a Query Resolution Policy match." | Out-String
    $Message += "Out of those $($j) events, $($UQCount) were unique, based on the Transaction ID (XID)." | Out-String
    $Message += "The $($UQCount) unique queries originated from $() clients, and boiled down to $($UDCount) unique domains queried.`n" | Out-String
    $Message += "The $($UQSCount) clients are:" | Out-String
    $Message += $($Unique258QuerySources) | sort QuerySource -Descending | Format-Wide -Property QuerySource -Column 5 | Out-String
    $Message += "This represents $($($UDCount/$QRPCount)*100) percent of what's being blocked via the $($QRPCount) QRPs." | Out-String
    $Message += "The corresponding Domains that were flagged as Policy Hits and DENIED can be found in Event ID 3.`n" | Out-String

    If($Unique258Domains){

        #The -Message parameter for Write-EventLog allows a maximum of 32766 characters, so the data within must be within those limits.
        If($(Get-CharacterCount -InputObject $Unique258Domains) -lt 32500){

        #Response Failure Domain Message Data.
        $RFMessage = "Black Hole Domain Hits - DENIED Domains:`n" | Out-String
        $RFMessage += $Unique258Domains | Out-String

        #Domains that were blocked are output to the DNS-Server-AnalyticLog-ParseData event log as it's own event, in event ID 3.
        Write-EventLog -LogName $CustomEventlogName -Source $EventSource_DD -EventId 3 -Message $RFMessage
        }
        Else{
        $CharLength = $(Get-CharacterCount -InputObject $Unique258Domains)
        Write-Warning "The character limit for the maximum allowable size of the message within for the Event ID has been exceeded and has a length of $($CharLength), but only 32766 characters are allowed."
        Write-Host "`nPrinting the DENIED Domains to the screen instead:`n"
        $Unique258Domains
        }
    }

    #Send the data of interest to the DNS-Server-AnalyticLog-ParseData event log located in "Application and Services Logs".
    Write-EventLog -LogName $CustomEventlogName -Source $EventSource_PAL -EventId 2 -Message $Message

    #Find the last event to be parsed and output it to the DNS-Server-AnalyticLog-ParseData event log located in "Application and Services Logs".
    Write-EventLog -LogName $CustomEventlogName -EventId 1 -Source $EventSource_PAL -Message "LastIterationLastEventTimeStamp - $($LastEventTimestamp)"
}
Else{
$WarningMsg = "There was no hit data found. This could be a good news or due to one of the following scenarios - but this is by no means an all inclusive list:"
$NoHitsMessage = $WarningMsg | Out-String
$NoHitsMessage += "`n"
$NoHitsMessage += " - The Parse-DNSAnalyticLog function was run without elevated credentials (The account didn't have permissions to the log to be able to parse it)." | Out-String
$NoHitsMessage += " - The DNS analytic log was just recently cleared." | Out-String
$NoHitsMessage += "`t This is usually due to a reboot, but it could have also been administratively done." | Out-String
$NoHitsMessage += " - The DNS analytic log was just recently turned on." | Out-String
$NoHitsMessage += " - There are no Query Resolution Policies on the server." | Out-String
$NoHitsMessage += " - If there are Query Resolution Policies, then they could be Disabled. Check the Policies to see if they're disabled { Get-DNSServerQueryResolutionPolicy }." | Out-String
$NoHitsMessage += " - If there are Query Resolution Policies, then they could be getting Ignored. Check the DNS Server Settings { (Get-DNSServerSetting -All).IgnoreServerLevelPolicies }." | Out-String
$NoHitsMessage += " - The inbound queries aren't meeting the criteria defined within the Query Resolution Policies." | Out-String

Write-Warning $WarningMsg
$NoHitsMessage.Substring($($WarningMsg.Length + 2))
Write-EventLog -LogName $CustomEventlogName -Source $EventSource_PAL -EventId 0 -Message $NoHitsMessage
}
In the code above, you’ll notice a non-native function called Get-CharacterCount, that can be found here:
function Get-CharacterCount ([String]$InputObject)
{
    $($InputObject | Measure-Object -Character).Characters
}
I have notes in the code, but in summary, it further picks apart the data that’s stored in the $HitData variable and stores it into separate variables for use in building possible messages that are dumped to the different events. For this scenario, I have four Events defined:
Event ID 0 – This event is triggered if a parsing cycle occurs and there are not hits, which is possible, but unlikely (depending on the block list used). This lists possible reasons for this event being triggered.
Event ID 1 – This event is triggered on every parsing cycle, but only if events are found in the $HitData variable. In this case it logs the timestamp of the last event that was parsed, during the last parsing iteration.
Event ID 2 – This event shows the “Bottom-Line Up-Front” information that can be customized to whatever you decide is of value.
Event ID 3 – This event shows just the domains that were Denied from query attempts to the resolver. The list tends to be long, so I have it stored as its own event.
One thing to consider, in Part 3 of the series, I show how to build a hash table for use in filtering the log for just the 258 events, but you can add more filters to that to further reduce the amount of data that needs to get parsed. That’s the reason that I’ve included Event ID 1 above – when employed, it tells the next parse attempt to start parsing events beginning when the last event that was parsed. This can save a considerable amount of time, depending on traffic and how long you go between parsing cycles among other things. The snippet below shows how I collect the timestamp and how to use it in the $FilterHashTable variable – essentially, just adding to that which I previously showed:
#Tries to collect the LastIterationLastEventTimeStamp value from the latest Event ID 1.

IF( $((Get-EventLog $CustomEventlogName -Newest 1 -InstanceId 1 -ErrorAction SilentlyContinue).message.split('-').trim()[1]) ){

#If there is, I store the content in a variable as a datetime format so that I can start the event search looking for events after the last parsed timestamp.

    $LastIterationLastEventTimeStamp = Get-Date $((Get-EventLog $CustomEventlogName -Newest 1 -InstanceId 1 -ErrorAction SilentlyContinue).message.split('-').trim()[1])

}
The updated Hash Table would just include a new value – StartTime:
#Build the HashTable for use with Get-WinEvent

$FilterHashTable = @{
Path=$DNSAnalyticalLogPath
ID=$EventIDs
StartTime= $LastIterationLastEventTimeStamp
}
At this point, we’ve further parsed the collected data into subsets of information for building messages for writing to our custom event log, showing only the “Bottom–Line Up–Front” information that we’re interested in. At the same time however, we’re writing ALL hit data to a .csv file during each parsing cycle, so we still have the ability to further investigate any interesting information that we find in the new events that we’re writing to. We have the best of both worlds! The .csv files (I say plural, because ideally this parser would be set up to run on a schedule) can further be leveraged by ingesting them into SQL or other data repositories for use in analyzing historical trends among other metrics. So let’s take a look at what I have in my lab, to show you what the final product looks like in Event ID Order:
At this point, we’ve further parsed the collected data into subsets of information for building messages for writing to our custom event log, showing only the “Bottom–Line Up–Front” information that we’re interested in. At the same time however, we’re writing ALL hit data to a .csv file during each parsing cycle, so we still have the ability to further investigate any interesting information that we find in the new events that we’re writing to. We have the best of both worlds! The .csv files (I say plural, because ideally this parser would be set up to run on a schedule) can further be leveraged by ingesting them into SQL or other data repositories for use in analyzing historical trends among other metrics. So let’s take a look at what I have in my lab, to show you what the final product looks like in Event ID Order:
Event ID 0:
|
Possible explanations of why there are no Query Resolution Policy hits.
|
I didn’t have any examples of this event, so I had to reproduce it artificially to be able to get a screenshot of it:

Event ID 1:
|
Timestamp of the last event that was parsed during the last parsing cycle.
|

Event ID 2:
|
Bottom-Line Up-Front Data – This can be whatever you think is important.
|

Event ID 3:
|
List of domains that were blocked as a result of a Query Resolution Policy.
|

Well, team...as you can see, we‘ve managed to successfully parse the DNS Analytic Log, define some data of interest, and then built some report data that we‘ve shipped to a custom created event log called DNS-Server-AnalyticLog–ParseData. It’s not the prettiest solution, and there’s plenty of room for innovation, but it’s better than just putting a block list in place and not knowing if it’s effective or not. Now you just need to remember to check the logs, like any other log that you deem important.
You know what would be super cool though?? What if instead of just shipping this data to an event log, what if we were able to use PowerBI to give us some visuals of this data that we deemed important? Maybe some charts and graphs showing important data on a per resolver basis. That’d be pretty cool.
Until next time!
by Contributed | Jan 19, 2021 | Technology
This article is contributed. See the original author and article here.
Misconfigured policies can prevent devices from updating and negatively affect monthly patch compliance. Explore common policy configuration mistakes that can hinder update adoption and result in a poor experience for your end users—and get guidance on how to review your Windows update policies to confirm your devices are configured correctly. Alternatively, you can leverage the Update Baseline tool to automatically apply the recommended set of Windows Update policies to your devices.
Set deadlines (with a grace period)
One of the most powerful resources that IT admins can use to support patch compliance is setting deadlines. A deadline is the number of days before a device is forced to restart to ensure compliance. Deadlines provide a balance between keeping devices secure and providing a good end user experience.
Deadlines work in coordination with pause and deferral settings. For example, if you set a quality update deadline of 2 days and a quality update deferral of 7 days, users will not get offered the quality update until day 7 and the deadline will not force restart until day 9. Similarly, if you (or the end user) pause quality updates, the deadline will not kick in until after the pause has elapsed and a quality update is offered to the device. For example, if the end user pauses all updates for 7 days and the quality update deadline is set to 2 days, as soon as the pause period is over on day 7, the deadline kicks in and the device will have 2 days to download, install, and restart to complete the update.
To ensure a good user experience for devices that have been shut off for some time, as when a user of a device is on vacation, we strongly recommend setting a grace period. The grace period is a buffer that prevents deadlines from immediately forcing a restart as soon as a device is turned on.
We also recommend leveraging the default automatic restart behavior. Windows has heuristics to analyze when the user interacts with the device to find the optimal time to automatically download, install, and restart. Allowing auto-restart can therefore improve your patch compliance while maintaining a good end user experience.
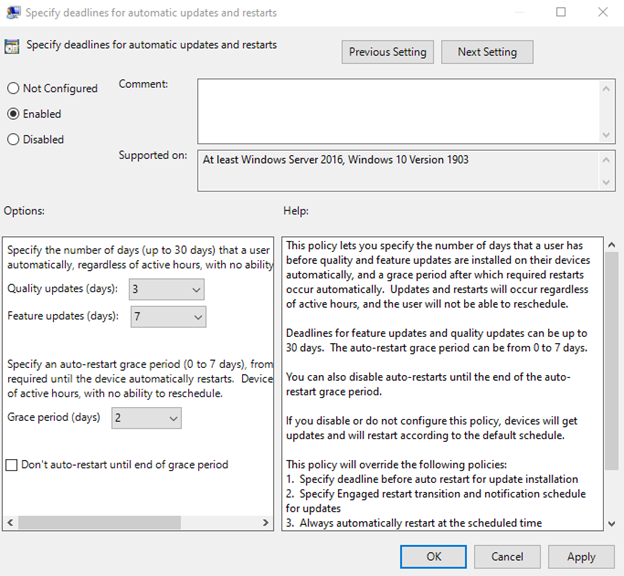
We recommend the following settings for deadline policies. You can find these policies in Group Policy under Computer Configuration > Administrative Templates > Windows Components > Windows Update > Specify deadlines for automatic updates and restarts or the CSP name listed for each policy setting below.
- Quality updates (days): 0-7 (3 days is the recommended configuration)
CSP name: Update/ConfigureDeadlineForFeatureUpdates
- Feature update (days): 0-14 (7 days is the recommended configuration)
CSP name: Update/ConfigureDeadlineForQualityUpdates
- Grace period (days): 0-3 (2 days is the recommended configuration)
CSP name: Update/ConfigureDeadlineGracePeriod
Note: We strongly recommend the sum of a feature update/quality update deadline and the grace period to be no less than 2. Setting a value lower than 2 can cause a poor end user experience due to the aggressive timeline.
|
- Auto-restart: Disabled is the recommended configuration.
CSP name: Update/ConfigureDeadlineNoAutoReboot
How to set deadlines for automatic updates and restarts using Group Policy
For more information, see Enforcing compliance deadlines for updates in Windows Update for Business.
Make sure automatic updates are set up correctly
Automatic updates are another policy where misconfigurations affect patch compliance. Within the Configure Automatic Updates policy in Group Policy (see below for the Configuration service provider (CSP) equivalent), you can define when and if to require end user interaction during the update process.
As a rule of thumb, requiring end user approval of updates negatively impacts patch compliance and success rates by a significant percentage. To simplify the update process, we therefore recommend either not configuring this policy at all or, if configured, selecting “4 – Auto download and schedule the install.” This allows the update to download and install silently in the background and only notifies the user once it is time to restart.
We also recommend setting the scheduled installation time to “Automatic,” rather than a specific time to restart, as the device will then fall back to the configured restart policies, such as active hours, to find the optimal time to schedule the restart (like when the user is away).
We strongly recommend not requiring the end user to approve updates for the smoothest update process as this can create bottlenecks in the update process. This includes avoiding configuring “2 – Notify for download and auto install” and “3 – Auto download and notify for install.”
If you do choose to use values 2 or 3, the following policy conflicts may arise and prevent updates from successfully being applied or may significantly degrade the end user experience.
- If “Configure Automatic Updates” is set to 2 or 3 and
“Remove access to use all Windows Update features” is set to Enabled:
The end user will be unable to take action on Windows Update notifications and will, therefore, be unable to download or install the update before the deadline. When the deadline is reached, the update will automatically be downloaded and installed.
- If “Configure Automatic Updates” is set to 2 or 3 and
“ Display options for update notifications” is set to (2) Disable all notifications including restart notifications:
The end user will not see notifications and, therefore, cannot take action without going to the Windows Update Settings page. Thus, the user will be unlikely to download or install the update before the deadline at which time the device will be forced to restart without any warning.
 How to configure automatic update settings using Group Policy
The CSP equivalent of the above recommended configurations for “Configure Automatic Updates” in Group Policy would be:
- Update/AllowAutoUpdate = 2 (Auto install and restart. Updates are downloaded automatically and installed when the device is not in use.)
- Update/ScheduledInstallDay = 0 (Every day)
- Update/ScheduledInstallEveryWeek = 1
- Or simply not configuring the policy
Ensure that devices can check for updates
Frequently, we see the policies listed in this section misconfigured during the initial setup of a device and then never revisited. If left misconfigured, they can prevent devices from updating. As a result, we recommend that you review the following policies to ensure they are configured correctly. You can find these policies in Group Policy under Computer Configuration > Administrative Templates > Windows Components > Windows Update or the Update Policy CSP listed for each policy setting below.
Do not allow update deferral policies to cause scans against Windows Update
CSP name: Update/DisableDualScan
If a device is configured to receive updates from Windows Update, including DualScan devices, make sure this policy is not set to Enabled. To clean out the policy, we recommend you set this policy to Disabled.
Specify intranet Microsoft update service location
CSP name: Update/AllowUpdateService
We see a significant number of devices unable to update due to bad Windows Server Update Services (WSUS) server addresses, often because a replacement WSUS server is provisioned with a different name. As a result, double-check to ensure that the WSUS server address is up to date. Devices that are misconfigured to ping an address that is expired or no longer in service won’t receive updates.
Additionally, scan failures can occur when devices require user proxy to scan their configured WSUS server and do not have the proper proxy policy configured. for proxy scenarios, see Scan changes and certificates add security for Windows devices using WSUS for updates.
Configure policies to ensure a good end user experience
The following policies can negatively affect your end user experience:
Remove access to “Pause updates” feature
CSP name: Update/SetDisablePauseUXAccess
Enabling this policy can benefit your monthly adoption rate, but also prevents users from pausing updates when necessary. If you have set deadlines that may cause a mandatory restart, disabling this policy will give end users the power to protect their work. For example, if a device is in the middle of a process that must run for consecutive days, the end user may want to make sure that their device is not forced to restart during the process.
Remove access to use all Windows Update features
CSP name: Update/SetDisableUXWUAccess
Leveraging this policy will remove the end user’s ability to use the Windows Update Settings page. This includes their ability to check for updates or interact with notifications, and can lead to policy conflicts. Note that, if this policy is left alone, checking for updates simply prompts a scan and does not change what the user is offered if you have configured Windows Update for Business offering policies on the device.
Display options for update notifications
CSP Name: Update/UpdateNotificationLevel
We recommend this setting is configured to 0 (default). If set to 1 or 2, this setting will disable all restart warnings or all restart notifications, limiting the visibility that your end user has to an upcoming restart. This can result in restarts happening while the end user is present with no notifications due to the deadline being reached. Enabling this policy is recommended for kiosk or digital signage devices only.
Apply recommendations with the Update Baseline
To implement the recommendations outlined above, we provide the Update Baseline tool which allows you to import our full set of Windows update policy recommendations into Group Policy Management Center. The Update Baseline toolkit is currently only available for Group Policy. A Microsoft Intune solution to apply the Update Baseline is coming soon. Download the Update Baseline and review the documentation included to view and apply our full list of policy configuration recommendations.
Try out our policy recommendations for yourself to see how you can improve your patch velocity. Let us know what you think by commenting below or reaching out to me directly on Twitter @ariaupdated.
by Contributed | Jan 19, 2021 | Technology
This article is contributed. See the original author and article here.
In my previous blog I addressed the issue of managing credentials in the code and presented two different alternatives to secure it. In this post, I will focus on Azure subscription security health and its challenge. I could summarize the subscription security health challenges as follows:
- New resources are deployed to Azure subscriptions all the time, especially if the company has many developers and DevOps working on the same subscription.
- Conducting subscription security health checks frequently for many subscriptions to make sure all the resources within the subscriptions follow the security best practices.
- For a big subscription, a manual check can be challenging.
Of course, there is an option to develop manual security checks as the scripts and run them on the subscription. However maintaining such a tool and updating it would be a nightmare, especially as the company adapts more resources type in the subscription.
Wouldn’t it be nice if there was a tool that I could run against the subscription? And it could come back with a list of security issues and even give me the option to fix them automatically? Fortunately, this tool exists, and it is called a secure DevOps kit for Azure or AzSK.
What is Secure DevOps kit (AzSK)?
- Secure DevOps kit was an internal tool for Microsoft and was developed to help Microsoft internal teams to move to Azure quicker on more easily.
- It is an open-source tool and not an official product.
- Microsoft released this tool so it can share Azure cloud security best practices with the community.
- Both the code and documentation can be found on GitHub.
- It allows the option to customize these is scripts so they can match company needs
AzSK Focus Area:
- Secure the subscription: It can run global subscription health checks then it will come back with a list of improvements. Then I can go ahead and apply these improvements manually or automatically.
- Integrate Security into CICD: These security tests can be integrated into the company’s continuous integration on continuous delivery pipelines.
- Enable Secure Development: It enables secure development. There is a visual extension that can be installed on the developers’ machine. It adds security intelligence to the developers’ IDE, so developers will be presented with the security best practices at the time of development.
- Continuous Assurance: It has the option to integrate these security tests with Azure automation, so this test can be run automatically as part of Azure automation process.
- Alerting & Monitoring: It will provide verbal’s alerting and monitoring data where users can implement it as part of Azure monitor.
- Security Telemetry in App Insights: It can write security telemetry information to an instance of Application Insights.
How does it work?
In the subscription, I can have different azure services like Azure SQL Server, virtual machines, storage accounts, Azure key, Walt Instances, API management instances ..etc, there are few options to user AzSK tool
- Running a few security tests against the subscription.
- Performing all these tests on come back with the test result. The test result is a CSV file.
- Automatically fix the issues for us.
NOTE: Not all the issues found can be fixed automatically. DevOps Admin will need to fix them manually.

Setting up AzSK
All the requirement and step by step instruction can be found https://azsk.azurewebsites.net/

I will need the following Pre-requisites:
- PowerShell 5.0 or higher.
- Windows OS

To Install the Secure DevOps Kit for Azure (AzSK) PS module:
Install-Module AzSK -Scope CurrentUser
Demo: Running Security Validation Tests (SVT) with AzSK
I am going to use the tool to scan on Azure subscription for Security Health. I will also use the tool to scan a resource group for security health. The resource group will have the following
- Storage Account
- Azure SQL Database.
- Virtual Machine
- Azure Key Vault
- Azure Cosmos DB
The following the azSK command will run security scans against the subscription.
Get-AzSKSubscriptionSecurityStatus -SubscriptionId '<subscriptionId>' --GenerateFixScript

Once the command is finished it will open an explorer window and show the result.

The SecurityReport file will show a list of the subscription level test, which were executed, and its result. For example, there is a test to make sure the admin owners off.

Also, since I used “GenerateFixScript” flag, there is a folder calls “FixControlScript” and if I opened this folder I can see Powershell fix script

In this second test, I will run the AzSK command against a resource group
Get-AzSKAzureServicesSecurityStatus -SubscriptionId <SubscriptionId> -ResourceGroupNames <rgname>

Like the last test, AzSK command will open the result folder where I can find the security scan result report


Also, there will be a “FixControlScript” folder where I will find the “RunFixScript” file

If I edit the file I could see the script and how it will attempt to fix the problem

Also if I checked the result folder again I could see a “security-validation-rg” folder that contains logs for each azure service that exists under the resource group. The log will contain information about the test and results that executed against the resource.

Summary
AzSK enables us to run security health checks against our subscriptions or resource groups. The tool will give a report and also an option to automatically fix issues that are found. In our next blog, I will discuss Azure sentinel.

Recent Comments