This article is contributed. See the original author and article here.
We are excited to announce that starting today, Microsoft Defender for Identity alerts are natively integrated into Microsoft 365 security center (security.microsoft.com) with a dedicated Identity alert page format. This marks the first step in our journey to introduce the full Microsoft Defender for Identity experience into the unified Microsoft 365 Defender portal and is a continuation of the convergence motion to integrate protection across domains, which started with Defender for Office 365 and Defender for Endpoint.
The new Identity alert page unlocks value for Microsoft Defender for Identity customers such as better cross-domain signal enrichment and new automated identity response capabilities. It ensures that we can best help our customers to stay secure and help improve the efficiency of security operations. To learn more about Microsoft 365 Defender, check out this dedicated Tech Community blog.
Alerts and investigation
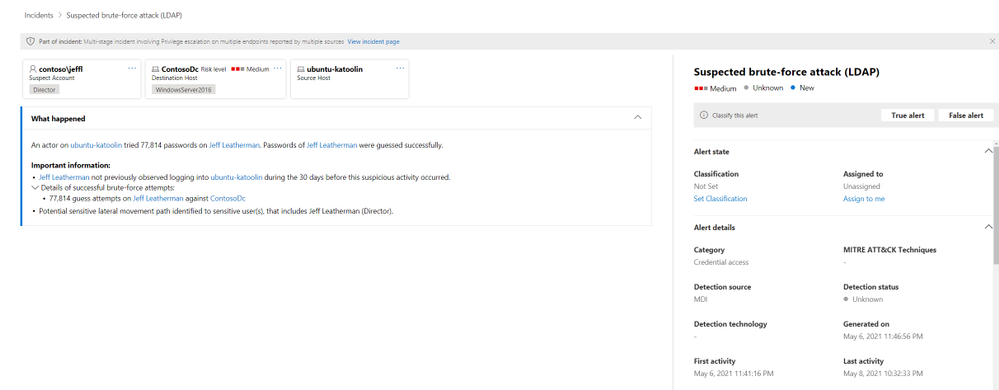
Alerts are a key experience when working with any security product. That’s why Defender for Identity is continuously investing in research and engineering efforts to provide new alerts to attack techniques, tools and vulnerabilities. Starting today, Microsoft Defender for Identity alerts are available to view within the Microsoft 365 Defender portal.
(Figure 1. Alert experience in Microsoft 365 security center)
One of the benefits of investigating alerts through Microsoft 365 security center is that Microsoft Defender for Identity alerts are further correlated with information obtained from each of the other products in the suite. These enhanced alerts are consistent with the other Microsoft 365 Defender alert formats originating from Microsoft Defender for Office 365 and Microsoft Defender for Endpoint. The new page effectively eliminates that need to navigate (‘tab-out’) to another product portal to investigate alerts associated with identity.
(Figure 2. Side panel for device entity that is enriched by both Microsoft Defender for Endpoint and Microsoft Defender for Identity)
The new alert page maintains a similar look and feel to Defender for Identity while adapting to the Microsoft 365 Defender user experience and style.
Not just a new home…
Alerts are now in one common alert queue with Defender for Office 365, Defender for Endpoint, Microsoft Cloud App Security and various compliance workload alerts. Another stand-out feature for alerts originating from Defender for Identity is that they can now trigger the Microsoft 365 Defender automated investigation and response (AIR) capabilities, including automatically remediating alerts and the mitigation of tools and process that can contribute to the suspicious activity.
(Figure 3. Automatic alert investigation based on Microsoft Defender for Identity alert)
How do I get started?
Defender for Identity alerts can easily be accessed from either the Incidents or Alerts queue. Open either of these areas, and then you can filter by Service Sources to see the specific alerts you’re looking for.
(Figure 4. Microsoft 365 security menu)
(Figure 5. Filter options for alert view)
As always, we’d love to know what you think.
Leave us feedback directly on the Microsoft 365 security center
This article is contributed. See the original author and article here.
Service encryption with Microsoft 365 Customer Key Microsoft 365 provides baseline, volume-level encryption enabled through BitLocker and Distributed Key Manager (DKM) which ensures customer data is always encrypted at rest in the Microsoft 365 service with BitLocker and DKM. Microsoft 365 offers an added layer of encryption at the application layer for content, including data from Exchange Online, SharePoint Online, OneDrive, and Teams, called service encryption.
Microsoft 365 Customer Key is built on service encryption, providing a layer of encryption at the application layer for data-at-rest and allows the organization to provide and control the encryption keys used to encrypt customer data in Microsoft’s datacenters. Customer Key provides an additional protection against viewing of data by unauthorized systems or personnel, complimenting BitLocker disk encrypted in Microsoft datacenters. Customer Key enhances the ability of organizations to meet the demands of compliance requirements that specify key arrangements with the cloud service provider, assisting customers in meeting regulatory or compliance obligations for controlling root keys.
Microsoft 365 Customer Key now supports Microsoft Teams! After providing the keys, Microsoft 365 then uses the provided keys to encrypt data at rest as described in the Online Services Terms (OST). The organization can create a data encryption policy (DEP) and assign it to encrypt certain Microsoft 365 data for all tenant users. While multiple DEPs can be created per tenant, only one DEP can be assigned at a time. For customers already using Customer Key for Exchange Online and SharePoint online, data encryption policies add broader control and now includes support for Microsoft Teams! Once a DEP is created and assigned, it will encrypt the following data for all tenant users:
Teams chat messages (1:1 chats, group chats, meeting chats and channel conversations)
Teams media messages (images, code snippets, video messages, audio messages, wiki images)
Teams call and meeting recordings stored in Teams storage
Teams chat notifications, Teams chat suggestions by Cortana, Teams status messages
User and signal information for Exchange Online
Exchange Online mailboxes that aren’t already encrypted using mailbox level DEPs
Microsoft Information Protection exact data match (EDM) data – (data file schemas, rule packages, and the salts used to hash the sensitive data)
When a DEP is assigned, encryption begins automatically but will take some time to complete depending on size of the tenant. For Microsoft Information Protection and Teams, Customer Key DEP encrypts new data from the time of DEP assignment. We are working to bring support to encrypting past data. For Exchange Online, the DEP starts encrypting all existing and new data. For more details on using Microsoft 365 Customer Key across multiple workloads and how to get started, please see Service encryption with Customer Key.
This article is contributed. See the original author and article here.
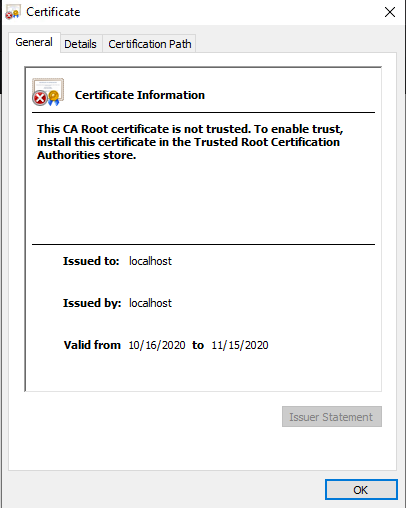
I’ve started using the new Microsoft Teams toolkit, which is a Visual Studio Code extension and generator for Teams applications. One thing I noticed is a little challenge when creating tabs, and that’s due to the requirement to use SSL. The documentation is fine and explains how to trust your local project, but I found it a little painful since the certificates only last 1 month and there’s a different one for each project, so I need repeat the process frequently. Your teammates will need to do that as well.
Here is an alternative approach in which you create your own certificate authority and build certs from that so you can install just one root certificate across all your projects! Each teammate can have their own certs, so you can collaborate as much as you wish and nobody has to go installing certs.
NOTE: Did you know that the Teams Toolkit uses Create React App (CRA) for tabs? Create React App is a toolchain from Facebook (who created React in the first place) it’s very popular and well supported! If you need help, search on “Create React App” and you can find a plethora of helpful articles; this one helped me figure this out!
Step 1: Create and trust a certificate authority (CA)
This step only needs to be done once for as many projects as you wish. It assumes you already have Node.js installed, as required by the Teams Toolkit.
a. Create a safe/private folder somewhere and go there in your favorite command-line tool, and run these commands:
NOTE: 3650 is the number of days your certs will be valid; feel free to change it. You can use –help on mkcert to reveal other options, such as setting an organization name and location (the default org is “Test CA”) and customizing the domain names for your certificate (the default is “localhost,127.0.0.1”).
This will create a new Certificate Authority and a certificate that was issued from it. You should see 4 files:
FILE
DESCRIPTION
ca.crt
Certificate for your new CA
ca.key
Private key for your new CA
cert.crt
Certificate for use in projects
cert.key
Private key for use in projects
b. Now you need to trust the certificate for your new CA; by doing that any cert you create will be trusted with no additional action on your part.
On Windows
Double click on the ca.crt file and click “Install Certificate”.
Choose Local Machine and click next.
Select “Place all certificates in the following store” and then click the “Browse” button. Choose “Trusted Root Certification Authorities” click “OK” to close the dialog box, and then click “Next”.
Restart all instances of your browser to force it to re-read its trusted roots. If in doubt, reboot your computer.
On Mac
Double click on the ca.crt file, which should be found under /Users/[your-name]/. It will launch Keychain Access app.
Enter your password or use Touch ID when prompted.
The new certificate (in this case, “MyOrg”) should be added. Double-click it.
In a new window, expand the Trust section of the certificate details. Select “Always Trust” for every option.
Close the window. Enter your password or use Touch ID again if you are asked. Now the certificate is trusted.
Restart all instances of your browser to force it to re-read its trusted roots. If in doubt, reboot your computer.
On Linux
There are more steps on Linux as most browsers don’t use the operating system’s certificate store, and a tool called certutil is needed to modify the browsers’ cert?.db files. This article explains how to install your new root certificate on Linux.
Step 2 – Add the certs to your project
This is what you need to do for each project.
a. Create a new folder in your project folder (the same level as the package.json file) called .cert. Copy the cert.crt and cert.key files into this folder.
b. Modify your .env file to tell the local web server to use your cert:
HTTPS=true
SSL_CRT_FILE=./.cert/cert.crt
SSL_KEY_FILE=./.cert/cert.key
c. Prevent saving the certs to your git repository by adding a line to the .gitignore file.
.cert
Azure Active Directory SSO Tabs
Tabs that implement Azure Active Directory Single Sign-On need to implement more than just a web page; they need to implement a web service to exchange the SSO token for an access token that the app can use to call downstream services such as the Microsoft Graph. This is explained inthis blog article, orthis one,more clearly than in the documentation.
Whenyo teamsgenerates an SSO tab, this web service is hosted using the same web server as the page itself.
When the Teams Toolkit generates one, however, it creates a separate web service for the web service so there really are two endpoints that need to be SSL enabled. The web service is in a folder calledapi-server. To enable SSL here, follow these steps:
2. Immediately above the lineapp.get(‘/getGraphAccessToken’)inserver.tsorserver.js, add these lines to allow the cross-origin call from the web page (port 3000) to the web service (port 5000):
const cors = require(‘cors’);
app.use(cors({
    origin: process.env.CORS_ORIGIN
}));
3. Near the bottom of the same file, replace the line
app.listen(port);
with this code:
const fs = require(‘fs’); const https = require(‘https’); var privateKey = fs.readFileSync(process.env.SSL_KEY_FILE ); var certificate = fs.readFileSync(process.env.SSL_CRT_FILE);
Each team member needs to do Step 1 on their computer just once. When a developer starts working on a project they can simply copy their .cert folder into their project and go to work.
Many thanks to my colleagueTomomi Imurafor documenting the Mac instructions and providing screen shots.
Do you have ideas on how to do this better, especially in a project team? Please chime in using the comments; thanks!
This article is contributed. See the original author and article here.
Windows Server 2008 R2 achieved end of support via Microsoft on January 14th 2020. In a previous post, steps were detailed on Active Directory Certificate Service migration from 2008 R2 to 2019 but required the new Windows Server 2019 server to have the same name as the previous 2008 R2 server. Many of you have reached out asking for an update of the steps to reflect Active Directory Certificate Service migration from 2008 R2 to 2016 / 2019 containing a different name. A solution has been found and tested with repeatable steps shared below.
NOTE:The following was tested in a lab environment. While the solution was successful it may not reflect your organization’s current setup. Please test the steps below in a lab environment prior to implementing on production.
Step 1: Backup Windows Server 2008 R2 certificate authority database and its configuration
Log in to Windows 2008 R2 Server as member of local administrator group
Go to Start > Administrative Tools > Certificate Authority
Right Click on Server Node > All Tasks > Backup CA
Certification Authority Backup CA
Click Next on the Certification Authority Backup Wizard screen
Click both check boxes to select both items to backup and provide the backup path for the file to be stored
Provide a password to protect private key and CA certificate file and click on next to continue
Click Finish to complete the process
Step 2: Backup CA Registry Settings
Click Start > Run > type regedit and click OK
Expand the key in following path: HKEY_LOCAL_MACHINESYSTEMCurrentControlSetServicesCertSvc
Right click on the Configuration key and click Export
Provide a name, save the backup file and then click on save to complete the backup
Backup CA Registry Settings
Backup of the Certificates is now complete and the files can now be moved to the new Windows 2016 / 2019 server.
CA Backup complete
Step 3: Uninstall CA Service from Windows Server 2008 R2
Navigate to Server Manager
Click Remove Roles under Roles Summary to start the Remove Roles Wizard, and then click Next
Uninstalling a CA
Click to clear the Active Directory Certificate Services check box and click Next
Removing Active Directory Certificate Services
Click Remove on the Confirm Removal Options page
If Internet Information Services (IIS) is running and you are prompted to stop the service before you continue with the uninstall process, click OK
Click Close
Restart the server to complete the uninstall
Step 4: Install Windows Server 2016 / 2019 Certificate Services
*NOTE: The screenshots below show the server name as WS2019 to highlight which server we are working on. This step-by-step highlights screenshots from Windows Server 2019. Windows Server 2016 process is the same with similar screenshots
Log in to Windows Server 2019 as Domain Administrator or member of local administrator group
Navigate to Server Manager > Add roles and features
Click on next to continue in the Add Roles and features Wizard
Select Role-based or Feature-based installation and click next
Keep the default selection from the server selections window and click next
Windows Server 2019 Server Selections
Select Active Directory Certificate Services, click next in the pop up window to acknowledge the required features that need to be added, and click next to continue
Adding Active Directory Certificate Services
Click Next in the Features section to continue
Review the brief description about AD CS and click next to continue
Select Certificate Authority and Certification Authority Web Enrollment, click next in the pop up window to acknowledge the required features that need to be added, and click next to continue
Windows Server 2019 Add Role Services
Review the brief description about IIS and click next to continue
Leave the default and click next to continue
Click Install to begin the installation process
Close the wizard once it is complete
Step 5: Configure AD CS
In this step will look in to configuration and restoring the backup created previously
Navigate to Server Manager > AD CS
In right hand panel it will show message as following screenshot and click on More
AD CS
Click on Configure Active Directory Certificate Service …… in the pop up window
Configure Active Directory Certificate Service
In the Role Configuration wizard, ensure the proper credential for Enterprise Administrator is shown and click next to continue
Select Certification Authority and Certification Authority Web Enrollment and click next to continue
Ensure Enterprise CA is selected the setup type and click next to continue
Select Root CA as the CA type and click next to continue
With this being a migration, select Use existing private key and Select a certificate and use its associated private key and click next to continue
AD CS Configuration
Click Import in the AD CS Configuration window
Select the key backed up during the backup process from windows 2008 R2 server. Browse and select the key from the backup we made and provide the password we used for protection and click OK.
Import Existing Certificate
With the key successfully imported and select the imported certificate and click next to continue
Leave the default certificate database path and click next to continue
Click on configure to proceed with the configuration process
Close the configuration Wizard once complete
Open the Command Prompt in Administrator Mode
Run the following to stop certificate services
net stop certsvc
Open the registry file exported from the Windows 2008 server in Notepad
NOTE:Please ensure you have tested this in lab first prior to completing these steps. While the solution was successful in lab it may not reflect your organization’s current setup and may disrupt your service. Microsoft is not liable for any possible disruption that may occur.
Locate CAServerName and change the value to the name of the NEW 2016 / 2019 Windows Server
Modify registry file
Save the changes in Notepad
Step 6: Restore CA Backup
Navigate to Server Manager > Tools > Certification Authority
Right click on server node > All Tasks > Restore CA
A window will appear confirming the stop of Active Directory Certificate Services. Click OK to continue.
Confirm stop of Active Directory Certificate Services
Click Next to start the Certification Authority Restore Wizard
Click both check boxes to select both items to restore and provide the backup path for the file to be restored from
Certification Authority Restore Wizard
Enter the password used to protect private key during the backup process and click next
Click Finish to complete the restore process
Click Yes to restart Active Directory Certificate Services
Step 7: Restore Registry info
Navigate to the folder containing the backed-up registry key with the newly edited CAServerName value and double click > Run to initialize the restore
Click yes to proceed with registry key restore
Click OK once confirmation about the restore is shared
Step 8: Reissue Certificate Templates
It is now time to reissue the certificate with the migration process now complete.
Under Server Manager, navigate to Tools > Certification Authority
Right click on Certificate Templates Folder > New > Certificate Template to Reissue
From the certificate templates list click on the appropriate certificate template and click OK
This completes the Active Directory Certificate Service migration steps from 2008 R2 to 2016 / 2019 containing a different server name.
The following video also shares steps surrounding this process as well as migrating DNS.
This article is contributed. See the original author and article here.
With the growth of internet, the demands of real-time is also expanded to web application to achieve live and synchronous interaction with the world. The data must be efficiently processed and delivered to produce a responsive, real time experience, for example cross platforms chatting application with live video, group collaboration in remote education, live dashboard for IoT, instant notification and alert for IT systems, and so on.
The Azure Web PubSub service (AWPS) could help you build real-time web application easily with large scale and high availability and focus on your own business instead of infrastructure. This service enables you to build the real-time web application based on WebSocket technology and publish-subscribe pattern. It enables an extensive client platform, and you also have the flexibility to leverage WebSocket community ecosystem.
In some scenarios, we need the server to process the data between clients, for example, implementing the language moderation for a cross platforms chat room, raw data scaling and calibration for logistic location tracking, data statistics for live dashboard, etc. But in other cases, you may look for a more effective model which routes the data between clients directly with a lightweight server. Taking the group collaboration scenario in remote education as an example, you may want to build a whiteboard application for remote customers which will synchronize the customized events between clients.
The Azure Web PubSub service could support both server with the ability to process messages and lightweight server scenarios. To help you build application with lightweight server, the AWPS published a predefined subprotocol json.webpubsub.azure.v1 which empowers the clients to do publish-subscribe directly. For the client supporting this subprotocol, we call it “PubSub WebSocket Client”. Let’s walk through how to use this subprotocol and build a chatroom with lightweight server together. You build the application with any programming language supporting WebSocket API. We are taking JavaScript as an example here. If you are using others, like Node.JS, Python, etc., you need to replace the APIs accordingly.
Create the instance of AWPS
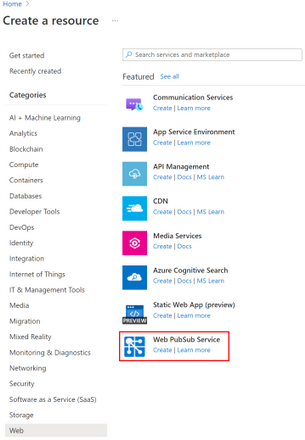
First, sign in to the Azure portal with your Azure account. You could create the new free instance by searching the “Web PubSub” or find it from the “Web” category.
Once the instance is created, we need to go to the “Client URL Generator” in “Key” tab to generate the “Client Access URL”. Please make sure that it has the roles of “Send To Groups” and “Join/Leave Groups”.
Create the PubSub WebSocket Client
It is using the Client_Access_URL and the subprotocol json.webpubsub.azure.v1 to create the WebSocket connection. In general, you need to generate the URL and token by server with the connection string. To simplify this demo, we just copy the URL from portal directly.
// PubSub WebSocket client
var publisher = new WebSocket('Client_Access_URL', 'json.webpubsub.azure.v1');
var subscriber = new WebSocket('Client_Access_URL', 'json.webpubsub.azure.v1');
Join and subscribe message from group
You need to join the group at first before receiving the messages. The message format to join a group is as below.
{
    "type": "joinGroup",
    "group": "<group_name>"
}
Once you join the group, it is easy to receive the messages from the specific group by onmessageevent as the code snippet below.
subscriber.onopen = function () {
    subscriber.send(JSON.stringify({
        "type": "joinGroup",
        "group": "group1"
    }));
}

subscriber.onmessage = function (e) {
    console.log(e.data);
}
Publish a text message the group
You could publish a text message to the specific group with this message format, if you have proper permission with the Client Access URL. It is not required to join the group at first.
Now, you have learned how to use Azure Web PubSub to complete pub/sub between clients, and you can use it to build a real application like chat room as this online demo and the sample code. You could also get more helpful resources from the getting stated contents. We are looking forward your feedback and ideas to help us become better via Azure Feedback Forum!
This article is contributed. See the original author and article here.
Q: How do I run my PowerShell command against all my Azure subscriptions?
A: Easy – Use the cmdlet I wrote when I ran into the same problem.
When you go from one Azure subscription to two, three, or hundreds it is no longer trivial to run a single command against all your subscriptions in PowerShell. I was working with one subscription that quickly expanded to three then soon more than a dozen. Opening new PowerShell hosts for each environment and switching between them was too much work. I needed an easy way to assess everything across all my subscriptions. My solution was to write Invoke-AzureCommand. Invoke-AzureCommand allows you to run a script block against every subscription easily. To use it install AzureHelper, put your code in a script block, and run Invoke-AzureCommand to do the repetitive work of cycling the script block across all your subscriptions.
Disclaimer: The sample scripts are not supported under any Microsoft standard support program or service. The sample scripts are provided AS IS without warranty of any kind. Microsoft further disclaims all implied warranties including, without limitation, any implied warranties of merchantability or of fitness for a particular purpose. The entire risk arising out of the use or performance of the sample scripts and documentation remains with you. In no event shall Microsoft, its authors, or anyone else involved in the creation, production, or delivery of the scripts be liable for any damages whatsoever (including, without limitation, damages for loss of business profits, business interruption, loss of business information, or other pecuniary loss) arising out of the use of or inability to use the sample scripts or documentation, even if Microsoft has been advised of the possibility of such damages.
1. Install AzureHelper
To get started, install the AzureHelper module using the following command:
Put whatever commands you want to run against all of your subscriptions into a script block. If you are new to script blocks check out more information on script blocks here.
For example, I want to find all Azure Disks that are larger than 512 GB across my subscriptions. To find these I put the following script block together.
3. Run your script block against all subscriptions
Running the script block against all subscriptions is as easy as the example below.
Invoke-AzureCommand -AllSubscriptions -ScriptBlock $DiskScriptBlock | FT ResourceGroupName, Name, DiskSizeGB
This example gives the output from every subscription, but if we have the same resource group name in multiple subscriptions then it isn’t clear which subscription contains the resource. To fix that we use a named expression to include the name of the subscription as seen in the following example.
Are you concerned about deallocated VMs sitting around that you don’t need anymore? Use the following:
Okay, that sure makes a quick query easier but what if I want to do something a little more complex in my script block that needs arguments passed in? I’m glad you asked. Invoke-AzureCommand also supports passing an array of arguments into your scriptblock as seen in the example here.
$ArgumentList = @()
$ArgumentList+=512    # The first parameter is the minimum disk size
$ArgumentList+="westus2"    # The second parameter is the Azure region to search

$BetterDiskScriptBlock = {
   param($disksize, $region)
   Get-AzDisk | Where{$_.DiskSizeGB -gt $disksize} | Where{$_.Location -eq $region}
}

Invoke-AzureCommand -ScriptBlock $BetterDiskScriptBlock -AllSubscriptions -ArgumentList $ArgumentList
You can make this example shorter by passing the arguments directly to Invoke-AzureCommand like this.
This article is contributed. See the original author and article here.
Whether it is because your agency doesn’t want to pay for premium access or because it just doesn’t work, Sean shared his experience and a few others shared theirs as well.
This article is contributed. See the original author and article here.
Over the past year, the shift to remote and hybrid work has meant our customers have navigated a digital transformation in the span of a few weeks or even days. This new work environment can be disorienting for employees while they navigate a blended environment of work and home and challenging for employers to support participation in a positive company culture across a distributed workforce. Maintaining a positive company culture while reducing risk has become both more critical, and more challenging to ensure a positive, safe culture where engaged employees can thrive.
With the rapid transformation to remote and hybrid work environments, the number of communications sent over digital communication platforms has grown exponentially. In fact, our recent Work Trend Index showed that between February 2020 and February 2021, the average Microsoft Teams user sent 45 percent more chats per week and 42 percent more chats per person after hours, with chats per week still on the rise.
While organizations seek out emerging technology to empower employees to do their best work in this environment, they also need to manage risk in communications to protect company assets and flag sharing of concerning content such as adult imagery or threatening language. Communication Compliance helps organizations detect these types of code of conduct violations as well as regulatory compliance requirements within company communications, with as little disruption possible to the business.
Today, we are excited to announce new capabilities that further enrich the solution’s integration with Microsoft Teams, intelligence, visibility, and reporting capabilities, while continuing our commitment to end-user privacy. For all the new features highlighted below, we have built strong safeguards and controls into the solution by default, such as pseudonymization, rules-based access control, admin explicit opt-in of users, and audit trails.
Deeper Microsoft Teams integration
As Microsoft Teams continues to elevate as a collaboration and teamwork platform, organizations need to respond to communicate risks effectively and quickly. To meet this need, we have made several Microsoft Teams investments to further integrate Communication Compliance capabilities. In this release, Communication Compliance will now provide policy investigators with additional Teams conversation context so that they can better assess whether a communication presents a potential violation. With this feature, policy reviewers will no longer have to search for additional context elsewhere and instead will see the messages before and after the one that matched the policy condition. Additionally, Communication Compliance can help organizations detect regulatory compliance and code of conduct violations in Adaptive Card content generated through apps in Teams.
Globalization and expanded visibility
To expand the ability to detect policy violations in communications beyond English, Communication Compliance now enables customers to detect potential compliance issues in French, Spanish, German, Portuguese, Italian, Japanese, and Chinese. And by leveraging Microsoft Translate, message content in a policy violation will be automatically translated to the policy reviewer’s preferred language when the message is in another language.
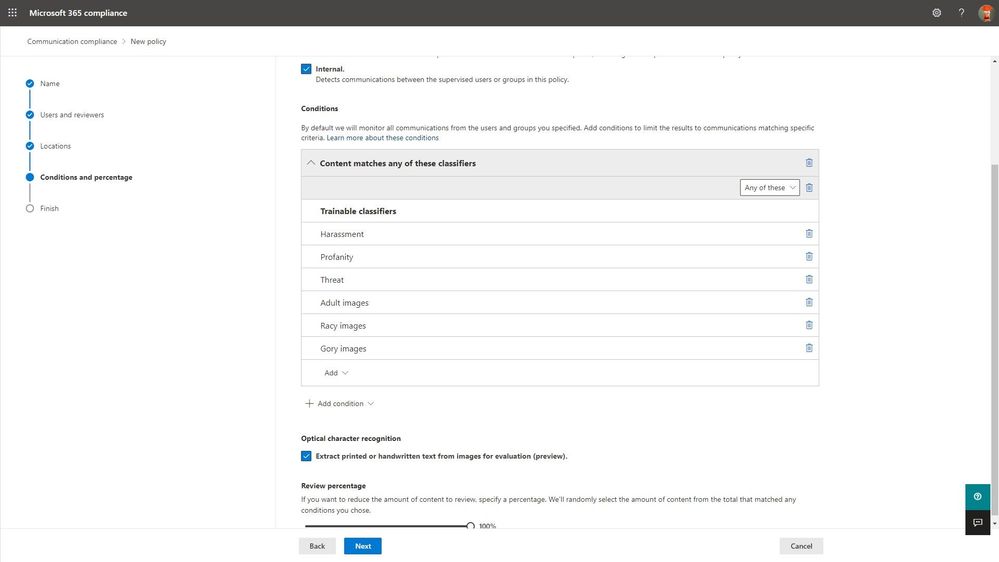
Additionally, we are introducing the ability for customers to detect compliance violations in images by extracting printed or handwritten text using Azure’s Computer Vision Optical Character Recognition (OCR). With OCR,text extracted from images or PDF will then be evaluated against the customer’s policy conditions (such as keywords matches for threatening language), further reducing an organization’s policy violation risk.
[Selection of optical character recognition to extract printed or handwritten text from images]
New communication risk detection templates and enhanced intelligence
Many of our customers have compliance requirements to ensure there is no sharing of information that could lead to a conflict of interest between different departments or groups of employees. For example, in the financial services industry, various regulations require organizations to build information safeguards so that there is no sharing of findings, output, or research across sales and trading departments. To detect potential conflicts of interest, we introduced a new template in Communication Compliance that customers can leverage to identify compliance issues in communications between two groups of users within their organization that could potentially lead to a conflict of interest.
[Policy setup for conflicts of interest template]
And in 2020, conversations around diversity, equity, and inclusion took center stage. We at Microsoft denounce injustice, racism, and discrimination. To detect and triage explicit discriminatory messages, we have enhanced our existing offensive language template to enable customers to detect potentially discriminating comments,supporting our customers in building more inclusive workplaces.
Advanced reporting and storage capabilities
We have enhanced the solution’s reporting capabilities with the introduction of the Sensitive information type flagging report, which provides customers with a breakdown of how many hits each sensitive information type receives by location.
With remote and hybrid work came an increased volume of digital messages, which has put customers at risk of exhausting their policy mailbox quota. To address this challenge, Communication Compliance shows and alerts customers when their storage consumption is reaching capacity. And from there, customers can now pause a policy from further evaluations of communications or clone the policy to continue detecting the policy scenario with renewed capacity.
Tune in to our podcast: Uncovering Hidden Risks
We have partnered with some of the top experts and thought leaders in the insider risk space who have a deep understanding of the challenges organizations face and the people, processes, and technology being used to address insider risks. Tune in to our podcast series Uncovering Hidden Risks, where we deep dive on topics like signal indicators, machine learning, and sentiment analysis.
Get Started
These new features in Communication Compliance have already rolled out or will start rolling out to customer’s tenants in the coming weeks. Communication Compliance is part of a broader set of Insider Risk Management solutions that help organizations mitigate insider risks and policy violations in Microsoft 365 E5. The solution is also generally available across government clouds, supported in GCC, GCC-High, and DoD tenants.
Learn more about what’s new with Communication Compliance and how to get started and configure policies in your tenant in this supporting documentation. We look forward to hearing your feedback.
Thank you,
@Liz Willets, Product Marketing Manager, Microsoft 365 Security and Compliance Marketing
@Christophe Fiessinger, Principal Program Manager, Microsoft 365 Security and Compliance Engineering
This article is contributed. See the original author and article here.
One very important aspect of managing one’s applications is that of monitoring and alerting. The Azure product group is acutely aware of this need, of course, and have built an advanced monitoring and alerting system right inside the portal, under the “Alerts” area. As part of this, you can configure various rules to keep track of your resources. These rules key to various elements (“conditions”), which you would choose from based on your understanding of the app and what are its key function parameters. There are about 60 conditions available, like certain HTTP errors, or CPU time. For example, one of the fundamental ways you could keep an eye on your app would be to set an alert on http server errors, and run it for a certain while without “major” alerting (as in, don’t email the entire world about every error just yet) to establish your baseline, as any app would have a certain amount of errors occasionally. Let’s say you run this for 2 weeks and see on average of 3 errors per day…you would then set the alert threshold to something higher, thus avoiding waking up everyone at 2am just because one user clicked the wrong button.
After configuring the conditions and thresholds that are appropriate for your application, you would decide what to do with it. Azure can send an alert to an email address, or to SMS, or perform a push-notification to the Azure app on your phone, or to make a phone-call (voice). You could add as many targets as you wish, though most people create some kind of corporate alias or group, which people can join or be added to get the notifications. You can see more info and a helpful video about configuring Service Now to interact with our alerting on the Azure blog.
However, really keeping track of your application is much more complicated, because the very notion of “up” vs “down” is different for every app. For example, if the application displays a form for the user to fill-out, then just testing if the form loads correctly doesn’t really give you much, and a truer test would be to see what happens when the form is submitted. If the application uses some kind of authentication, then testing the authentication process is an important goal, but not always possible, because it would typically require creating some kind of test account and that could create a security risk. One way to clear some of these obstacles is to create specific test pages, which perform “backend” operations, such as running a database query and displaying the result. Creating such a page and checking if it loads successfully and/or delivers the expected content is a good way to test the app.
Another aspect of testing is the one of performance. An application can be “up”, but the time it takes to process a transaction can suddenly go from 8 seconds to 50 seconds. That kind of change is way below normal time-outs, but certainly above the patience threshold of many human beings, so tracking it is an important way to know things might be going awry.
But things can get a lot more complicated, because as I noted, “up” and “down” can mean many things. For example, what if your application normally has about 100 transactions per minute, but suddenly, that number jumps to 1600? That’s not “down”, but such a growth could mean that the code is going into some kind of loop due to a bug or design issue, and that could be both a bad user experience, as well as cause undue strain on your resources, and even cause a spike in costs. Also, it could mean that some malicious party is doing some kind of footprinting on your app to find vulnerabilities, or performing a denial-of-service attack against the app. All of these are things you probably want to be aware of even if the app feels perfectly normal to all your users.
Another thing to consider is that for users, there could be nuanced notions of what’s “down”. For example, your form could be loading, but it could be missing some image or CSS files, causing the appearance to suffer. This kind of thing doesn’t mean the app is down, but it can look very ugly, and if your users are customers, it could make the company look bad.
Yet another thing to consider is alert levels. If your app is dead, you certainly want all-hands on deck, but if it’s performance is down by 20%, you might want a more limited circulation of just system admins or a developer or two. You might want that specific alert level to be off during the night, and set various thresholds (for example, 20% drop, just send an email to be read during the next business day, but a 40% drop warrants a phone call). The more complex the app and development process, the more elaborate your alerting decision tree and flowchart would be. Another aspect of this is the alert interval. Most monitoring options run at very short intervals, like once every 5 minutes, or even less, but people don’t typically respond that fast, and code-fixed can take time to develop and deploy. You certainly don’t want your CEO to receive a phone call every 60 seconds for 5 hours while your people are trying to fix it, right? Similarly, if the alerting system generates a high volume of alerts, many people tend to set email filters, so they don’t wake up in the morning to 540 new emails. Those kind of filters could lead to the issue not being seen, and so the alerting is too loud to be useful. A better design would be to have alerting trigger a certain number of alerts, but then quiet them down before they become unmanageable.
In closing, alerting is an engineering effort that in many cases can be almost as complex as designing the application itself, and so a good idea for any organization is to start planning this from day-1, alongside the applications’ design and coding. Integrating this into the app early is more likely to lead to a reliable and stable monitoring, and thus a more reliable and stable application.
This article is contributed. See the original author and article here.
We frequently hear from customers that they are concerned whether their users are getting the best possible performance and experience with Microsoft 365, which is often determined by the quality of connectivity that their users have and how Microsoft 365 connections are handled by the networks and network solutions between the client and Microsoft. Customers ask how they can measure and see the quality of network connectivity for their Microsoft 365 users and get insights how to optimize it further. That’s why we are excited to announce the General Availability of Microsoft 365 Admin Center Connectivity and the Microsoft 365 network connectivity test tool!
Using existing network connectivity tests in Microsoft 365 can provide network assessments and insights. They are aggregated to represent the network connectivity of a work location in use by an Microsoft 365 customer. This can be very valuable in identifying potential network connectivity improvements that would improve performance and provide a better user experience for Microsoft 365 users.
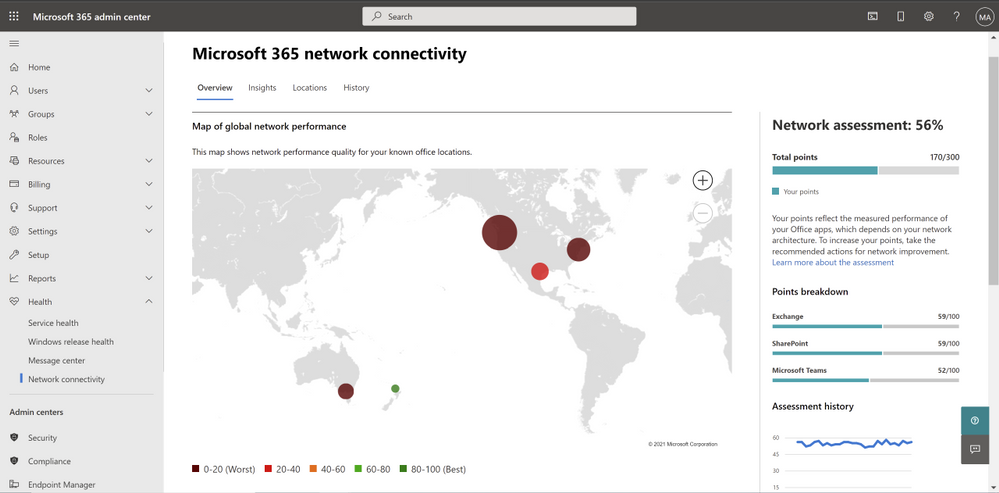
Microsoft 365 admin center network connectivity
Overview tab for Microsoft 365 admin center network connectivity
After configuration, the page for network connectivity in the Microsoft 365 admin center shows office locations where network connectivity is evaluated. Each location shows relative number of users connecting from the office and indicates the impact to user experience from network connectivity at that location. We show you a map of global performance, tenant-wide network assessment scores and location-specific network assessment scores for offices and remote workers in a city. You can view the network insights for each location to take action or research further. You can also drill down to each location for the detailed list of network connectivity tests and insights.
Summary of an office location in Microsoft 365 admin center network connectivity
Microsoft 365 network connectivity test tool
Summary result for Microsoft 365 network connectivity test tool
The Microsoft 365 network connectivity test tool allows for similar network tests to be run on demand and results to be viewed immediately. It The connectivity test tool allows users at remote locations to run networking tests in their web browser and the downloadable executable. It identifies common network design issues that violate Microsoft 365 network connectivity principles. The tool can be run anonymously or by signing in to a Microsoft 365 account to share results your administrator and other stakeholders.
Details results tab for Microsoft 365 network connectivity test tool
Actionable network insights supporting improved user experience
Microsoft describes guidance for securely optimizing Microsoft 365 network connectivity in Microsoft 365 network connectivity principles. The goal of the two tools is to help test for how closely that guidance is followed and provide recommendations for getting better performance and user experience.
Insight: Backhauled network egress – this is shown for a location when the users are more than 500 miles away from the network egress. It is recommended that users have local network egress so that connections can be made to the closest Microsoft network point of presence.
Insight: Network intermediary device – this is shown for a location when the users are connecting to Microsoft 365 through a proxy server or similar packet interception device. It is recommended that these be bypassed for critical Microsoft 365 network connections.
Insight: Better performance detected for customers near you – this is shown for a location where a number of other Microsoft 365 customers in the same geographic area have significantly better performance. More investigation would be required, but this indicates that the local telecommunications infrastructure is capable of providing a better Microsoft 365 user experience than your users are getting.
Insight: Low download speed from SharePoint front door – this indicates that the download speed for OneDrive for Business or SharePoint users is very poor in this location. Further investigation may be required to identify the cause, but often bandwidth can be increased to improve user experience.
Finally, it’s worth noting that all these tests and insights are generated in strict compliance with Microsoft security and privacy practices. Security and privacy sensitive customers will appreciate that those tests do not collect user or device identifiable information and thus can’t be attributed back to a specific person.
To learn more about Microsoft 365 admin center network connectivity, click here.
To learn more about the Microsoft 365 network connectivity test tool, click here.
Continue the conversation by joining us in theMicrosoft 365 Tech Community!Whether you have product questions or just want to stay informed with the latest updates on new releases, tools, and blogs, Microsoft 365 Tech Community is your go-to resource to stay connected!


![[Policy setup for conflicts of interest template]](https://www.drware.com/wp-content/uploads/2021/05/fb_image-98.jpeg "conflicts of interest.jpg")


Recent Comments