by Contributed | May 13, 2021 | Technology
This article is contributed. See the original author and article here.
References and Information Resources
|
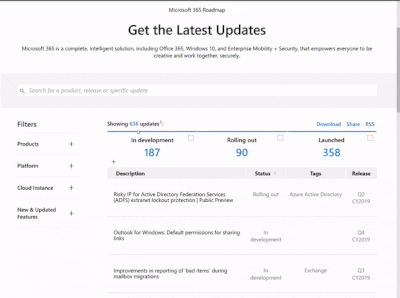
Microsoft 365 Public Roadmap
This link is filtered to show GCC, GCC High and DOD specific items. For more general information uncheck these boxes under “Cloud Instance”.
New to filtering the roadmap for GCC specific changes? Try this:
Stay on top of Office 365 changes
Here are a few ways that you can stay on top of the Office 365 updates in your organization.
Microsoft Tech Community for Public Sector
Your community for discussion surrounding the public sector, local and state governments.
Microsoft 365 for US Government Service Descriptions
- Office ProPlus (GCC, GCCH, DoD)
- PowerApps (GCC, GCCH, DoD)
- Power Automate US Government (GCC, GCCH, DoD)
- Power BI (GCC, GCCH)
- Planner (GCC, GCCH, DoD)
- Outlook Mobile (GCC, GCCH, DoD)
- My Analytics (GCCH, DoD)
- Dynamics 365 US Government
May Webinars & Remote Work Resources
May Edition Sections:
- Highlighted
- Microsoft Teams – IT Admins & Planning
- Microsoft Teams – End Users & Champions
- Security & Compliance
- Device Management
- Blogs & Articles of Interest
Microsoft Teams for Gov YouTube Video Series
The hub for teamwork in Office 365 GCC, GCC High, & DoD
Microsoft Teams for US Government Adoption Guide

Go further with Microsoft Lists – five free virtual workshops
Pick your time zone and join in. Learn all you can do with Microsoft Lists – your smart information tracking app in Microsoft 365.
Preparing for TLS 1.2 in Office 365 and Office 365 GCC
To provide the best-in-class encryption to our customers, Microsoft plans to deprecate Transport Layer Security (TLS) versions 1.0 and 1.1 in Office 365 and Office 365 GCC. We understand that the security of your data is important, and we’re committed to transparency about changes that may affect your use of the TLS service.
Deploying M365 Learning Pathways in your GCC High Tenant
This article replaces the previous article, which used the – now legacy – version of PnP PowerShell.
Microsoft 365 learning pathways is a customizable, on-demand learning solution designed to increase usage and adoption of Microsoft 365 services in your organization.
Announcing General Availability of the new Exchange admin center
We are excited to announce that the new EAC is now generally available for customers (including GCC customers) in 10 languages. With this announcement, we are also releasing a new dashboard, new usability features, and several intelligent reports to help admins be more productive in their work. The new EAC is expected to be available to customers in GCC High at the end of May 2021, and to customers in DoD at the end of June 2021.
Why Exchange Server updates matter
One thing we learned during the March 2021 release of Exchange Server security updates is that many of our customers were not ready to install security updates because they were not on supported cumulative update versions. With the threat landscape rapidly evolving, the importance of keeping your environment current should not be underestimated.
Release News
We are rolling out a new PowerShell command to enable or disable the link to return to classic SharePoint
Tenant administrators can now control whether the “Return to classic SharePoint” and “Exit classic experience” links are shown or not using a new PowerShell command. The Set-SPOTenant command will be updated in the April 2021 month’s PowerShell update to contain ‘DisableBackToClassic’ parameter.
Microsoft Teams Supervised Chat – GCC
The Events web part on SharePoint pages and news posts will have an option to show images
When making a Live Presentation, presenters will soon be able to add a video feed to the presentation
SharePoint now offers several site templates that contain pre-populated content, pages, and web parts that can be customized to fit the needs of your organization
Starting May 2021, it will no longer be possible to download individual files or subsets of files within .zip file previews in OneDrive and SharePoint on the web
Improvements for managing attendee audio permissions in Teams Meetings
Soon you will be able to use a new Enterprise Content Delivery Network (eCDN), Ramp, should you need a CDN for live events in Microsoft Teams – GCC
Exchange Security Updates for April 13, 2021
Dynamic view automatically optimizes shared content and video participants in Teams meetings and lets users show shared content and specific participants side-by-side – GCC
Improvements for managing attendee audio permissions in Teams Meetings
Message Center Posts and Updates for Microsoft Teams in GCC
|
Looking for what’s on the map for Microsoft Teams and only Teams in GCC?
Go right to the GCC Teams Feature Communications Guide
Message Center Highlights
|
MC254083 – Microsoft 365 Translation in Outlook Win32 coming to GCC and GCC-High
This message is associated with Microsoft 365 Roadmap ID 81921
We are introducing Microsoft 365 translation services to Outlook Win32 clients. This release is a new set of translation features that enable users to translate full messages or specific words and phrases. This is rolling out on Outlook desktop.
Key Points
· Timing: Rolling out to GCC and GCC-H in early June 2021.
o Rolling out to GCC and GCC-H in semi-annual channel in January 2022.
· Roll-out: user level
· Control type: admin control
· Action: review and assess by June 7, 2021
How this will affect your organization
When enabled, if a user receives an email in another language, they can translate the message to their preferred language by using the following three options:
1. User will be prompted to translate the message using intelligent suggestions that appears on top of the message.
2. User can click on “…”, then Translate Message for message translation.
3. User can select a piece of text and see translation for it in the context menu. Select the text, then right click, then select Translate.
This feature is rolling out default on.
What you need to do to prepare
If you want to use the new modern Translator feature in Outlook, when you update to Version 2101, Translator will be available to use by default.
Note: If you wish to disable this feature, you must do so by June 7th 2021.
· For more information see How to configure translation capabilities available in Office
Learn More:
· How to translate text into a different language
· Announcing new translation features in Outlook
Additional information
Blog
MC253595 – Teams: Simplified way to manage your notification settings – GCC-High, DoD
This message is associated with Microsoft 365 Roadmap ID 70663
This new Microsoft Team feature update will enable end users to configure notification settings through a simplified global notification settings page for Teams desktop and web.
When this will happen?
This will rollout in mid-May.
How this affects your organization?
Your end users will be able to configure notification settings through a simplified global notification settings page. This update will enable them to choose from the two available Teams and channel notification preset options (All activity or Mentions & replies). For greater control over their channel, they can further customize their channel notification settings by clicking Custom.
The new settings can be accessed by selecting the profile picture at the top right corner of Teams, and then selecting Settings > Notifications.
What you need to do to prepare?
You might want to notify your users about this new capability and update your training and documentation as appropriate.
Please review Manage notifications in Teams to learn more.
MC253497 – Together Mode – GCC-High, DoD
Microsoft 365 Roadmap ID 68847 and 70625
This release of Together mode uses AI segmentation technology in meetings to digitally place participants in a shared background, making it feel like users are sitting in the same room. This is rolling out on Teams desktop.
When this will happen?
· GCC-High: We will begin rolling this out in early May and expect to complete rollout late May.
· DoD: We will begin rolling this out in early June and expect to complete rollout late June.
How this will affect your organization?
Meeting participants in your tenant can now view participants in Together Mode. Additionally, users will be able to select from various different virtual spaces and change the scenes in Together Mode.
What you need to do to prepare?
You might want to notify your users about this new capability and update your training and documentation as appropriate.
MC253493 – Improvements to Service Health Dashboard and Incident Communications
Microsoft 365 Roadmap ID 80175
We are updating the Service Health dashboard to make it quicker and easier to find out about active issues of the services
When this will happen?
The updates to the Service Health page will start to roll out in early May and we expect to complete the rollout by the end of June.
How this will affect your organization?
The Service Health dashboard will have a new user experience aimed to make it quicker and easier to find out about active issues of the services. The new view will show the Incidents and advisories displayed directly on the landing page of the Service Health dashboard. For high impacting incidents we will continue to provide the regular updates but now in addition to those Microsoft will also provide smaller and more frequent updates intermixed with the regular updates labeled as quick updates in the details panel.
MC252959 – New Azure AD built-in roles – Knowledge Admin, Knowledge Manager, and Exchange Recipient Admin
We have created 3 new built-in roles in Azure AD for you to manage Microsoft Viva Topics and Exchange Online admin settings.
· Knowledge Admin – Users in this role have full access to all knowledge, learning and intelligent features settings in the Microsoft 365 admin center.
· Knowledge Manager – Users in this role can create and manage content, like topics and acronyms. These users are primarily responsible for the quality and structure of knowledge.
· Exchange Recipient Admin – Users with this role have read access to recipients and write access to the attributes of those recipients in Exchange Online.
When this will happen?
These roles are available in all environments now.
What you need to do to prepare?
Because Global administrator accounts are powerful and vulnerable to attack, we recommend that you have fewer than five Global Administrators. Use these lower privileged roles instead.
Learn more:
· Knowledge Administrator
· Knowledge Manager
· Exchange Recipient Administrator
Additional Information
MC252958 – Speaker Attribution in Live Caption in GCC
Microsoft 365 Roadmap ID 82849
This release of Live captions will make your meetings more inclusive to participants who are deaf or hard-of-hearing, people with different levels of language proficiency, and participants in loud places by giving them another way to follow along. With speaker attribution, it is easier for users to follow along with who is speaking as well as with what is being said.
This feature update will rollout on Teams desktop.
When this will happen?
This will roll out and be complete in late April.
How this will affect your organization?
Live captions improves the accessibility of Microsoft Teams. By identifying who is speaking when there are multiple speakers in a meeting, live captions makes Teams more useful while increasing comprehension.
Captions are available only in English (US) for now.
Note: Remarks made by participants joining from a conference room device will be attributed to the room rather than to an individual in the room.
What you need to do to prepare?
Live captions with speaker attribution is available in new meeting and calling experiences.
To opt-out of being identified in Live Captions, see Hide your identity in meeting captions and transcripts.
Additional Information
MC252940 – Admins can install Apps in Meetings – GCC
Microsoft 365 Roadmap ID 81086
We are enabling IT admins to select Teams apps that can be installed in meetings for their organization. It will leverage the App setup policies, Installed apps section in which admins can specify the apps to install on behalf of their users.
This is rolling out to Microsoft Teams desktop, web and mobile.
When this will happen?
We will begin rolling this out in mid-May and expect to complete rollout early June.
How this will affect your organization?
Tenant admins will be able to install apps in meetings on behalf of their users and be able to choose which apps are installed by default when Teams is started.
What you need to do to prepare?
You might want to notify your users about this new capability and update your training and documentation as appropriate.
Additional Information
MC252939 – Microsoft Lists: Grid view keyboard improvements
Microsoft 365 Roadmap ID 70670
This new SharePoint feature will allow users to edit in grid view, and have a faster editing experience and greater levels of accessibility than before.
When this will happen?
Targeted release will begin rolling this out in late April and expect to complete rollout mid-May.
Standard will begin rolling this out in mid-May and expect to complete rollout mid-June.
How this will affect your organization?
This Edit in grid view feature will improve the speed and accuracy of how your users input and update information. Users will be able to navigate across rows and columns using the tab key. In addition, pressing Enter will enable them to edit that field.
Clicking Enter on a new row saves the new item, and pressing the Esc key closes editor.
This is rolling out default on with no admin control.
MC252704 – PowerPoint Live: Present to Teams from PowerPoint for Windows
Microsoft 365 Roadmap ID 80599
This new feature release will bring the PowerPoint Live in Teams entry point into PowerPoint for Windows. Clicking the Present in Teams button in PowerPoint will be the only step you need to take to present the deck in your Teams meeting.
When this will happen?
We will begin rolling this out in mid-May and expect to complete the roll-out late May.
How this will affect your organization?
Users can click the Present in Teams button in PowerPoint for Windows to present their slides into an ongoing Teams meeting in the PowerPoint Live mode.
There are two entry points users can choose from, one in the top right corner and the other under the Slide Show tab.

Requirements:
· Have the latest Teams desktop app installed.
· Have the latest PowerPoint for Windows installed
· Store the presentation on OneDrive for Business or SharePoint.
· Join a Teams meeting before clicking the Present in Teams button in PowerPoint for Windows.
· Be using an Office 365 E3/A3, Office 365 E5/A5, or Microsoft 365 for Government license.
MC252692 – Announcing Teams location picker support for security groups and distribution lists – GCC-High
This message is associated with Microsoft 365 Roadmap ID 72229
Data loss prevention (DLP) for Microsoft Teams will soon support security groups (SGs) and distribution lists (DLs) as part of the Teams location picker.
Once available, you will see the new options as part of the Teams DLP policy settings in Microsoft 365 compliance center.
When this will happen?
Rollout will begin in mid-May and is expected to be complete by early June.
How this will affect your organization?
With this update to the Teams location picker, you will have more granular control of DLP policy scope within the Microsoft 365 compliance center, such as the ability to include or exclude particular departments, business units, or geo-specific security groups.
Note: The DLP policy will apply to the existing membership of security groups (SGs) or distribution group (DGs). The policy will be updated automatically to reflect any changes in membership.
What you need to do to prepare?
Once available, you will see the new options as part of the Teams DLP policy settings in the Microsoft 365 compliance center.
· Learn more about data loss prevention for Microsoft Teams.
· Review policy settings in Microsoft 365 compliance center.
MC252588 – Update to Meeting creation and expiration policies – GCC
Microsoft 365 Roadmap ID 66921
We have made changes to how Teams meetings and join links are accessible for meeting organizers who have had their scheduling capabilities revoked. Today, Teams meeting URLs can be accessed before, during, and after the scheduled meeting time, even if the scheduling permission for the meeting organizer has been revoked after the meeting was created. To implement this change, we have adjusted the behavior of some settings in csTeamsMeetingPolicy to give additional control to the Tenant Admins.
We apologize for not communicating this change sooner. We are working to ensure we communicate changes prior to them being available, in the future.
Key points:
·
· Timing: these changes are available today
· Control: policies in Teams admin center or PowerShell
· Action: review and assess impact.
How this will affect your organization?
Tenant admins can now control and define the expiration of meetings created and scheduled by their users. This change does not impact any scheduled meetings for organizers who continue to have the ability to schedule Teams meetings (as defined by Meeting Policy).
What you need to do to prepare?
You may consider reviewing your policies to determine if you would like to make any changes.
Additional details and information are available here: Meeting policies and meeting expiration in Microsoft Teams
MC252335 – OneDrive: iOS – Outline for PDF viewing
Microsoft 365 Roadmap ID 81918
This new OneDrive for iOS release will allow you to view a table of contents that you can use for easy and concise navigation in a PDF document. Just press a title in the table of contents and you’ll navigate directly to the page.
When this will happen?
We will begin rolling this out to the Apple Store in early May and expect to complete rollout mid-May.
MC252330 – Reduce background noise in Microsoft Teams Meetings (now available for MAC users)
Microsoft 365 Roadmap ID 82826
Updated April 26, 2021: We have updated this post for clarity. Thank you for your feedback.
The AI-based, real-time noise suppression that was added to Windows desktop client for Microsoft Teams in Nov 2020 will soon also be available on MAC. This feature will automatically remove background noise from your meetings.
When this will happen?
We will begin rolling this out in late April and expect to complete rollout late August.
How this will affect your organization?
Users can set the noise suppression level before a meeting. Once changed, the setting applies to the next call.
The four settings are Auto (default), Low, High, and Off.
They are accessible from the profile image > Settings prior to a meeting and from More options […] > Device settings during a meeting.
When left on the default setting, Auto, the Teams app sets noise suppression based on ambient sound.
· Low is designed for persistent background noise like an air conditioner, computer fan, or music.
· (New) High suppresses all background sound that is not speech; this setting uses more computer resources.
· Off disables the noise suppression feature.
Note: The high setting is unavailable for MacOS users with M1 Arm Processor
What you need to do to prepare?
You might want to notify your users about this new capability and update your training and documentation as appropriate.
Additional Information
MC252053 – (Updated) The new Exchange admin center general availability
Microsoft 365 Roadmap ID 80626
Updated April 23, 2021: We have updated the content below for clarity. Thank you for your feedback.
The new Exchange Admin Center (EAC) is a modern and a performant admin portal. This new portal has most of the functionality available in the classic EAC portal along with a lot of new features like tenant-to-tenant migration, automated G-Suite migration, and more. It also features a personalized dashboard with reports and insights that are designed to increase productivity.
When this will happen?
· Standard release and GCC available in late April.
· GCC High available at the end of May.
· DoD available at the end of June.
How this will affect your organization?
There is no impact to users. Tenant admins will find the new experience available at https://admin.exchange.microsoft.com.
What you need to do to prepare?
Admins do not need to do anything to prepare. EAC will default to the new experience, and admins have a toggle they can use to revert back to the classic EAC experience if needed.
MC252199 – Set out of office within Microsoft Teams – GCC
Microsoft 365 Roadmap ID 68701
With this update, end users can create an out of office message from within Microsoft Teams desktop or Microsoft Teams on the web. This out of office message will sync with the user’s Outlook calendar, presence, and contact card information.
When this will happen?
Rollout will begin early May and is expected to be complete by the end of May.
How this will affect your organization?
There are two ways to access the Out of Office setting:
1. Access the Out of Office setting through the “Set status message” panel accessible from the user profile image.

2. Access the Out of Office setting through the Teams application settings accessible from the user profile image.

MC252196 – OneDrive: Android – Outline for PDF viewing
Microsoft 365 Roadmap ID 81917
This new OneDrive for Android release will allow you to view a table of contents that you can use for easy and concise navigation in a PDF document. Just press a title in the table of contents and you’ll navigate directly to the page.
When this will happen?
We will begin rolling this out to the Google Play Store in early May and expect to complete rollout mid-May.
How this will affect your organization?
Users will be able to use Outline to quickly navigate through PDF content using a clickable table of contents.
· While viewing a PDF, tap Outline.
· When table of contents appears, tap on any page title to jump to that page.
MC252055 – Microsoft Information Protection: Ability to test Exact Data Match
Microsoft 365 Roadmap ID 72220
Customers will be able to test their custom Exact Data Match (EDM) Sensitive Information Types (SITs)
When this will happen?
The rollout will be complete by late April 2021.
How this will affect your organization?
After setting up EDM-based classification (configuring EDM and hashing/uploading the sensitive data to the EDM service), tenant admins will be able to test EDM SITs via the Compliance portal and also via the Test-DataClassification PowerShell cmdlet. The classification results returned includes the sensitive type, its count, and confidence.
What you need to do to prepare?
After ensuring EDM has been fully setup, there is no additional preparation required to test EDM custom SITs.
· Use:Test-DataClassification cmdlet to find the confidence and count of a sensitive information type.
· Refer to:Create custom sensitive information types with Exact Data Match to learn more about EDM.
· To learn more about SITs:Get started with custom sensitive information types.
MC252052 – Prevent/Fix (Detected) Addressing PowerPoint Session Expiration in Microsoft Teams
Problem detected: Microsoft is seeing a high percentage of PowerPoint for the web sessions expiring when using PowerPoint due to a short Token Lifetime SharePoint setting.
Customers may have activated “Control access to SharePoint and OneDrive data based on network location” to prevent their users from accessing documents outside of their tenant’s trusted IP ranges. When they do this Microsoft Office apps will also have a reduced token lifetime of 15 minutes which causes PowerPoint for the web users to need to refresh their session every 15 minutes. Office for the web apps will deliver a better end user experience when using a longer lifetime token setting (30 to 60 minutes).
Customers can choose to have a longer token life using the change process documented here. A tenant admin can change the lifetime of that token up to 1 hour for the field -IPAddressWACTokenLifetime.
How this will affect your organization?
If you don’t fix this problem, end users working in Office files in a browser will need to refresh their session every 15 minutes because this is the default lifetime of a token when “Control access to SharePoint and OneDrive data based on network location” is enabled.
What you need to do to prepare?
To fix this problem a tenant admin can change the lifetime of their token by using PowerShell Set-SPOTenant Cmdlet to set the -IPAddressWACTokenLifetime field to a longer lifetime.
MC252051 – Introducing 10 new markets for Microsoft Calling Plans
We are pleased to announce the upcoming launch of Microsoft Calling Plans in 10 new markets: Czech Republic, Finland, Hungary, Luxembourg, New Zealand, Norway, Poland, Romania, Singapore and Slovakia.
When this will happen?
The expansion will be generally available on May 3, 2021.
How this will affect your organization?
Any customer with the necessary phone system and calling plan licenses can acquire numbers in the 10 new countries starting May 3, 2021.
What you need to do to prepare?
Ensure you have sufficient calling plan licenses to cover your needs.
MC251868 – Exclude specific files from OneDrive sync on macOS
Microsoft 365 Roadmap ID 80684
Updated April 29, 2021: We have updated the rollout timeline below. Thank you for your patience.
This new feature setting will allow you to exclude newly added OneDrive files from syncing to the cloud by file name or extension on macOS devices.
This will rollout to the OneDrive sync app on macOS.
When this will happen?
We will begin rolling this out in late April and expect to complete rollout by the end of May (previously mid-May).
How this will affect your organization?
This setting lets you enter keywords to prevent the OneDrive sync app from uploading certain files to OneDrive or SharePoint. You can enter complete names, such as “setup.exe” or use the asterisk (*) as a wildcard character to represent a series of characters, such as *.pst. Keywords aren’t case-sensitive.
If you enable this setting, the sync app doesn’t upload new files that match the keywords you specified. No errors appear for the skipped files, and the files remain in the local OneDrive folder.
MC251867 – SharePoint: Audience Targeting capability for Events Web Part
Microsoft 365 Roadmap ID 70815
This new audience targeting release will allow the ability to target specific audiences per event within the SharePoint Events Web Part. This can help users target specific events to different audiences, helping them provide more personalized experiences on SharePoint pages.
When this will happen?
Target release: We will begin rolling this out in mid-April and expect to complete rollout early May.
Standard release: We will begin rolling this out in mid-May and expect to complete rollout mid-June.
How this will affect your organization?
End-users leveraging the events web part will have a new option in its configuration to enable audience targeting, and then for each event an option to add specific audiences to target. For example, users can target events to team members and stakeholders that would be most interested.
To use audience targeting:
· Enable audience targeting for the event list in the site’s document library
· Select your audience
· Enable audience targeting in the Events web part

The ability to add audiences on events is an optional capability within the events web part. No action is required by the admin to activate this feature.

What you need to do to prepare?
You might want to notify your users about this new capability and update your training and documentation as appropriate.
For more information on the SharePoint audience targeting system, including supported audience types, please see Target content to a specific audience on a SharePoint site.
Review Use the Events web part to learn how to use audience targeting for this web part.
MC251567 – Enable Intune app protection polices (APP) for Microsoft Lists on iOS
Microsoft 365 Roadmap ID 70752
The Microsoft Lists iOS app is now configurable as a first party app in the Microsoft Endpoint Manager admin center. This allows app to be targeted to ensure that the data accessed is protected by app protection policies. The app now also supports conditional access deployment through Azure admin portal.
When this will happen?
This change will be part of the app update planned for mid-April through late April.
How this will affect your organization?
There is no effect on the existing apps or services being used. Action may be required to allow use of the Lists iOS app in your organization by properly configuring conditional access policy.
Please note that the Lists app currently doesn’t support ‘Require approved client app’ grant access. Only ‘Require app protection policy’ is supported which provides higher level of assurance.
What you need to do to prepare?
For more details on how to target apps with your app protection policy, see:
· How to create and assign app protection policies
· Support Tip: How to enable Intune app protection policies (APP) with Microsoft Lists
MC251565 – (Updated) New PowerShell to enable or disable the link to return to classic SharePoint
Updated April 23, 2021: We have updated this post with additional details for clarity. Thank you for your feedback.
On modern SharePoint list and library pages, there’s a link in the lower left of the page that says “Return to classic SharePoint.” This link reverts the current list or library back to classic mode. On the classic page, there’s a corresponding link that says, “Exit classic experience.” Tenant administrators can now control whether these links appear. By default, these links are shown on all list and library pages to all users.
To remove the links, run the following PowerShell cmdlet:
· Set_SPOTenant -DisableBackToClassic $true
To show these links again, run the following PowerShell cmdlet:
· Set_SPOTenant -DisableBackToClassic $false
When this will happen?
The Set-SPOTenant command will be updated in this month’s PowerShell update to contain ‘DisableBackToClassic’ parameter.
Targeted Release environments can start utilizing this in late April and this gradually available to all standard release environments by the end of May.
MC251564 – Organizers can lock meetings – GCC
Microsoft 365 Roadmap ID 80669
Within the desktop app in-meeting experience, organizers can choose to lock their meetings to prevent subsequent unwanted join attempts.
Users attempting to join a locked meeting by any means (e.g. from web, desktop, mobile, PSTN, and devices) will not be able to do so. There will be a message to say that the meeting is locked.
When this will happen?
We will begin rolling out in mid-May and expect to complete by the end of May.
MC250957 – Request Files is now Available – GCC-High, DoD
Microsoft 365 Roadmap ID 72228
This new OneDrive Request Files feature will soon be available in your environment. This feature will enable users to give others permissions to upload files to a specific folder in their OneDrive. This is rolling out to OneDrive on the web.
When this will happen?
We will begin rolling this out in late April and expect to complete rollout mid-May.
How this will affect your organization?
When Anyone links are enabled in your organization, users in OneDrive will be able to create a Request Files link to a folder in their OneDrive. They will be able to send this link which allows recipients to upload items into the folder without the ability to see any files stored within the folder.
Anyone links give access to anyone who receives this link, whether they receive it directly or forwarded from someone else. This may include people outside of your organization.
Note: Expiration dates can be set based on admin policy.
MC250956 – Teams meetings to support view-only attendees – GCC
Microsoft 365 Roadmap ID 65952
We originally communicated this in MC240169 (Feb ’21). Currently, Teams meetings are limited to 300 users. If someone tries to join a meeting after it reaches capacity, they are unable to do so. With this update, meeting organizers who are assigned an appropriate license will be able to host a Teams meeting that has overflow capacity.
Up to 20,000 view-only attendees may join a meeting from late February through the end of June in order to accommodate heightened remote work scenarios. After July 1, 2021 we will support only 10,000 view only attendees.
Note: This capability will be available to users with the following licenses: Office 365 or Microsoft 365 E3/E5/A3/A5/Business Standard/Business Premium. For the rest of 2021, we are offering temporary availability to Teams users to try the features with their existing commercial subscription.
When this will happen?
We have started to roll this out and expect to complete by end of April.
How this will affect your organization?
When a tenant enables this overflow feature:
· After a meeting reaches capacity (300 users), people will be able to join as view-only attendees, with the maximum number limited by the phase.
· Organizers cannot remove view-only attendees from a meeting.
· View-only attendees will not impact the normal interaction available for regular attendees (those who joined before the meeting reached capacity).
· Once the view-only attendee limit is reached, no additional view-only attendees will be able to join.
· View-only attendees will follow all lobby and security policy mechanisms.
· View-only attendees will have limited access to meeting features. For example, view-only attendees will be able to listen to all audio and view a screen or window shared during the meeting. However, they will be unable to share audio or video, and they will be unable to see chat or other applications that are shared during the meeting.
· Meeting organizers will not see view-only participants in attendee counts or reports; this feature does not support the e-discovery of data
What you need to do to prepare?
This feature is OFF by default for your users.
You may use PowerShell to enable this feature for your entire tenant while you prepare to assign the licenses.
· Set-CsTeamsMeetingPolicy -Identity Global -StreamingAttendeeMode Enabled
Note: The view-only attendance feature is provided using Teams streaming services.
Learn more:
· Meeting policy settings – Participants & guests
· Teams view-only meeting experience
MC250949 – Prevent/Fix (Planned) Feature roll back for SharePoint Site headers
We are rolling back the minimal and extended layout options for the SharePoint site header because these layouts have not yet migrated to Microsoft Search.
After April 30,2021, if you take no action, SharePoint sites that incorporate the minimal header will automatically transition to the compact header. Sites using the extended header layout will automatically transition to the standard header.
How this will affect your organization?
These two header layout options depend upon Microsoft Search and are optimized for the search input box to be displayed in the suite header. Without Microsoft search, the search input box for these two layouts will not function.
The compact and standard layout options for the SharePoint site header options will continue to be available with no impact on the search experience.
What you need to do to prepare?
If you do nothing, when this change rolls out:
· Your SharePoint sites that employ the minimal header will automatically transition to the compact header.
· Your sites using the extended header layout will automatically transition to the standard header when this change
You can update those site headers in advance of this change.
We recommend informing your users about this change.
MC250940 – Reminder: Skype for Business Online Connector Retirement
Originally announced in MC230065 (December 2020) and MC244740 (March 2021), Microsoft Teams PowerShell module is available to all tenant administrator. This is a reminder the Skype for Business Online connector will retire on May 15, 2021.
After May 15, 2021 tenant admins will encounter connection failure when using the Skype for Business Online connector.
Note: if your organization is not using the Skype for Business Online connector you can safely disregard this message.
How this will affect your organization?
While admins will no longer be able to use Skype for Business online connector, they can switch over to Teams PowerShell Module for the simpler and safer administrative experience.
Administrators will no longer be able to use Skype for Business online connector, when this change is implemented.
We’ll be gradually rolling this out to Teams tenants starting May 15, 2021 and the roll out will be completed by July 31 2021.
What you need to do to prepare?
Instead of using Skype for Business online connector, we recommend using Teams PowerShell Module.
Please click here to learn more:
Move from Skype for Business Online Connector to the Teams PowerShell module – Microsoft Teams | Microsoft Docs
MC250797 – Teams: Create Teams with Templates – GCC
Microsoft 365 Roadmap ID 71635
This new feature will allow users to use Microsoft Teams templates when creating a new team. Teams templates let users quickly create rich collaboration spaces with channels for different topics and preinstall apps to pull in content and services.
Custom templates are not yet available for EDU customers but are planned in the future.
When this will happen?
We will begin rolling this out in mid-May and expect the rollout to be complete by the end of June.
How this will affect your organization?
Your users can choose from both Microsoft provided templates as well as custom templates within the tenant to create teams. For Microsoft provided templates, we provide 13 pre-built or base templates for different tasks, such as managing a project or an event or coordinating an incident response. Base templates have a predefined team structure with a set of channels, tabs, and apps; they can be duplicated but not edited.
IT admins can create, modify and remove custom templates for their tenants in the Teams Admin center and via PowerShell. In the Teams Admin center, Admins may also manage which templates are shown or hidden to the end user in the team creation flow.

MC250796 – Teams: Create tasks from Teams chats or channel posts – GCC
Microsoft 365 Roadmap ID 68696
This new feature will allow users to create Tasks from Teams chats or channel posts and enable them to identify tasks that arise naturally in Teams conversations while ensuring important work isn’t overlooked. This will rollout on Microsoft Teams desktop and mobile.
When this will happen?
Rollout will begin early May and be complete in late May.
How this will affect your organization?
This feature will unify tasks in the Teams Task app in your organization. Select More options on a Teams message to choose Create task and track in the Tasks app in Teams. All tasks created from chats and posts will appear with all of a user’s tasks in the Teams Tasks app. Individual tasks can be added to My tasks and collaborative tasks can be added to any shared plan.
Both will include a link back to the original chat or channel post to provide context. Your users will be able to add accountability by assigning tasks, setting due dates, priority, assignments, and even add notes right from their chat or channel post.
MC250795 – Adding translator service to Service Health Dashboard
Microsoft 365 Roadmap ID 82267
This new translator toggle feature on the Service Health Dashboard (SHD) page will use Microsoft’s translation service to automatically translate the content of Incidents and advisories to the language selected by user.
When this will happen?
We will begin rolling this out in early May and expect to complete rollout early June.
How this will affect your organization?
If you have configured your admin center in a language other than English, a toggle will appear on the Service Health Dashboard that will allow you to auto translate the content of incidents/advisories into your currently configured language. The content that will be translated with this toggle includes the following:
· Title of incident/advisory
· User Impact section of the incident/advisory
· Latest posts of the incident/advisory
If you toggle the switch off, the content will default back to English. This new toggle switch will work in the same way the Message Center does today.
MC250541 – Microsoft Defender for Office 365: Updates to post-delivery detections and investigations
Microsoft 365 Roadmap ID 70614
Updated April 29, 2021: We have updated the rollout timeline below. Thank you for your patience.
Microsoft Defender for Office 365 is introducing new alert policies related to post-delivery detections as well as enhancements to the Automated Investigation & Response (AIR) playbooks associated with them.
In addition, we are modifying the severity classification for six default alert policies to better align the alerts with their impact on your organization.
When this will happen?
· New alerts rollout begins on April 14, 2021
· We will disable two existing alert policies on May 14, 2021
· The severity classification changes happen at the end of April
How this affects your organization?
These new alerts, and the AIR playbooks that will trigger from these alerts, will accurately capture the threats of the emails and entities, including if the URL points to a malicious file or if the file contains a malicious URL.
New alerts:
· Email messages containing malicious URL removed after delivery
· Email messages containing malicious file removed after delivery
· Email messages from a campaign were delivered and later removed
· Malicious emails were delivered and later removed
Existing alerts that will be disabled the end of April:
· Email messages containing phish URLs removed after delivery
· Email messages containing malware removed after delivery
You will see both new and to-be-removed alerts along with new alerts between April 14 and May 14 to provide your security teams with time to handle any required changes. In order to help security teams with the increased alert volume during this short duration, the existing and new alerts will be correlated into the same AIR investigation as well as correlated into the same Incidents.
In addition, we are modifying the severity classification of the following default alert policies to better align with the potential risk and impact on your organization and to help your security teams prioritize alerts.
· Suspicious Email Forwarding Activity
· Email reported by user as malware or phish
· Unusual increase in email reported as phish
· Admin Submission Result Completed
· Creation of forwarding/redirect rule
· eDiscovery search started or exported
What you need to do to prepare?
If you are utilizing alerts either through an API, alert email notification, or in the Office 365 Security & Compliance Center (protection.office.com/viewalerts) or Microsoft Security Center (security.microsoft.com/viewalerts), you will need to modify your workflows by May 14, 2021.
If you are not currently utilizing these alerts you may:
· Disable the existing alert policies in order to reduce alert volume in your tenant: “Email messages containing phish URLs removed after delivery” and “Email messages containing malware removed after delivery”
· Do nothing, we will disable these two existing alert policies on May 14, 2021
Learn more:
New alert policies in Microsoft Defender for Office 365
MC250528 – “Tasks by Planner and To Do” app name to be shortened to “Tasks” within Teams
Reminder: Last year we announced the public preview of Tasks in Teams. At the same time, we also announced the planned three-stage naming sequence for how the app name would appear in Teams.
This update reflects the final stage where we shorten Tasks by Planner and To Do to simply Tasks for simplicity, brevity and to better reflect the app combining the To Do and Planner experiences. You’ll still be able to find the app by searching Planner or To Do and this will not impact the functionality of the app.
When this will happen?
We will begin rolling this out in early May and expect to complete rollout mid-May.
How this will affect your organization?
Users will see the Tasks by Planner and the To Do app names in Teams shortened to Tasks.
MC250343 – Outlook mobile clients will soon provide access to delegate mailboxes
Microsoft 365 Roadmap ID 67273 and 67274
Your end users will soon be able to add and remove delegates from within Outlook for iOS and Outlook for Android. Delegates will be able to access those mailboxes on their mobile app as well.
When this will happen?
Rollout begins in late April and should be complete in early May.
How this will affect your organization?
A delegate mailbox is a mailbox where users can provide access for others (delegates) to take actions on their behalf.
With this update, users can manage delegates from within their Outlook mobile app. Colleagues with delegate permissions can add and view delegate mailboxes in their Outlook mobile app.

MC250338 – REMINDER: Microsoft Edge to replace Microsoft Edge Legacy with the April Windows 10 Update Tuesday (or “B”) release
As announced in MC237900 (February 2021), we are replacing the out-of-support Microsoft Edge Legacy application with the new Microsoft Edge as part of the April Windows 10 cumulative monthly security update, also known as the Update Tuesday (or “B”) release.
· Support for the Microsoft Edge Legacy desktop application ended on March 9, 2021.
· When you apply this update to your devices, the new Microsoft Edge will be installed and the out-of-support Microsoft Edge Legacy will be removed.
o Please review which Windows 10 versions are affected.
· To avoid disruption to your kiosk scenarios, you will need to set up kiosk mode in the new Microsoft Edge.
When this will happen?
The April Windows 10 Update Tuesday release will be available starting April 13, 2021.
How this will affect your organization?
When you apply this update, the out-of-support Microsoft Edge Legacy desktop application will be removed, and the new Microsoft Edge will be installed.
If you do not set up kiosk mode in the new Microsoft Edge prior to applying the April Windows 10 Update Tuesday release, you will experience a disruption in your kiosk scenarios because Microsoft Edge Legacy and its kiosk mode will no longer be available.
MC249777 – Microsoft Teams: introducing organization-wide backgrounds (preview) – GCC
Microsoft 365 Roadmap ID 80193
Updated April 27, 2021: We have updated the rollout timeline below. Thank you for your patience.
Currently, your end users can replace the background in a video meeting or call with an image, if you have enabled this feature for Teams desktop apps and Teams on the web.
We are introducing, via a preview feature, the ability for you to provide backgrounds that end users have access to across the organization.
This feature will require an Advanced Communications license when it becomes generally available in July. If users do not have an Advanced Communications license, any organization backgrounds applied during the preview will no longer be available.
When this will happen?
Rollout is planned from early May (previously late April) to late May.
MC249776 – Introducing Approvals in Microsoft Teams – GCC
Microsoft 365 Roadmap ID 82332
Approvals in Microsoft Teams is a way to streamline requests and processes with a team or partners. Users will be able to create new approvals, view pending approvals, and see previous ones in one place.
Users with an F3 license or above are able to take advantage of the Approvals app within Teams (license list below). If you do not have users that meet that requirement, you may safely ignore this message.
Key points:
· Timing: mid-May 2021
· Roll-out: tenant level
· Control type: user control and admin control
· Action: review and assess by May 10, 2021
How this will affect your organization?
Approvals is a native Teams application that lets users easily create, manage, and share approvals from a hub for teamwork. These approvals are triggered directly with the Power Automate infrastructure and do not require a flow with an approvals action.
Users see all of their approvals in the hub, including the approvals that have been completed. Approvals show up across all of a user’s systems, including Power Automate, SharePoint, and Microsoft Dynamics 365.

What you need to do to prepare?
The Approvals app is on by default if your tenant has enabled Power Automate.
Manage the Approvals app in the Teams Admin Center within the app page, including customizing which users are able to access the app via permission policies. Currently, all the approvals are created in your organization’s default environment.
MC249774 – Azure AD Default access token lifetime Variation
We are making some changes to the default lifetime of Access Tokens. The default lifetime of Access Tokens issued by Azure AD will change from a static value of 60 minutes to a value between 60-90 minutes (75 minutes on average). We are making this change to provide a smoother experience across the service.
When will this happen?
We will roll out this change on May 31, 2021.
How this will affect your organization?
Once the change has rolled out, Access Tokens issued by Azure AD for your tenant will have a value between 60-90 minutes.
What you need to do to prepare?
This is for your information, you are not required to take any action.
For information on the Azure AD Access Token default values, visit here
MC249626 – Organization logos in Outlook for iOS and Android
This message is associated with Microsoft 365 Roadmap ID 72214
This new Outlook for iOS and Android update will display your organization’s logo, that is defined within Azure Active Directory, in the left-hand navigation area and while composing messages and calendar events. This feature will help users differentiate their work accounts from their personal accounts in the app.
When this will happen?
We will begin rolling this out in early May and expect to complete rollout late June.
How this will affect your organization?
For organizations that have configured a logo, users with two or more accounts (only one work account) in Outlook mobile will have the Office 365 logo replaced with the logo defined in Azure Active Directory.
Cases where the organization logo will not appear:
· Users only have a single account added in Outlook mobile.
· No logo is defined in Azure Active Directory.
· Users with multiple work accounts from the same tenant (like shared/delegate mailboxes).
If users have their Outlook app theme set to System Default or Light, then they will see the Square logo image from Azure Active Directory. If the user has their Outlook app theme set to Dark, then the Square logo image, dark theme will be displayed. If your organization only has the Square logo image set in Azure Active Directory, then the user will see that image in their Outlook app, regardless of the app theme they have set.
MC249625 – Customized backgrounds in Microsoft Teams meeting video coming to mobile devices – GCC
If you have enabled this feature for Teams desktop apps, users will be able blur their background in a video meeting or call or replace the background with an image.
This message is associated with Microsoft 365 Roadmap ID 82234
When this will happen?
· iOS: rollout began early April and should be complete mid-April
· Android: rollout begins early May and should be complete mid-May
How this will affect your organization?
Users will be able to add backgrounds to their meetings and calls on mobile devices; the feature respects the same policies as desktop backgrounds.
What you need to do to prepare?
Mobile devices respect the policies that are in place for Teams desktop apps via the VideoFiltersMode parameter.
· Edit an existing Teams meeting policy using the Set-CsTeamsMeetingPolicy cmdlet.
· Create a new Teams meeting policy using the New-CsTeamsMeetingPolicy cmdlet and then assign the policy to users.
You might want to notify your users about this new capability and update your training and documentation as appropriate.
MC249623 – OneDrive sync client update available for Mac
Microsoft 365 Roadmap ID 70693
Updated April 29, 2021: We have updated the rollout timeline below. Thank you for your patience.
We are making updates available for the OneDrive sync app on Mac.
When this will happen?
· Insiders: rollout begins May (previously late April)
· General availability: rollout should be mid-May through the end of May
How this will affect your organization?
Updates to OneDrive on Mac will be delivered in the .pkg format which allows for faster updates and better security. There is no change to the end-user experience.
MC249608 – Opt-in to the new Teams live events multi-window producer experience – GCC
Microsoft 365 Roadmap ID 81804
Currently, a Microsoft Teams live event producer manages a live event within the primary Teams window.
With MC248212 (April 1, 2021), we announced a new feature that allows producers to manage a live event in a separate Teams window. We are providing an opportunity to opt-in to this new feature before it rolls out to your tenant.
How this will affect your organization?
If you would like to opt-in to this new experience, Teams live events producers will always manage a live event in a new external window (also known as multi-window experience).
What you need to do to prepare?
To opt-in your entire tenant to this experience, please send a request to tlerequests@microsoft.com.
MC249393 – (Updated) OneDrive sync client 64-bit update available for Windows
Microsoft 365 Roadmap IDs 70694 and 70695
Updated April 29, 2021: We have updated the post with additional details, for clarity. Thank you for your feedback.
We are making a 64-bit version of the OneDrive sync client available for Windows.
When this will happen?
· Insiders: rollout begins early April
· General availability: rollout should be mid-April through mid-May (previously end of April) following the normal
The OneDrive sync app update process
· Preview: download available now
How this will affect your organization?
We will silently update user devices from the 32-bit version to the 64-bit version. All functionality is the same as it is in the 32-bit installation.
For preview customers: users can download and install a 64-bit version of OneDrive:
64-bit preview package
MC249289 – Teams: Simplified way to manage your notification settings – GCC
Microsoft 365 Roadmap ID 77796
This new Microsoft Team feature update will enable end users to configure notification settings through a simplified global notification settings page for Teams desktop and web.
When this will happen?
We will begin rolling this out in late April and expect to complete rollout early May.
How this affects your organization?
Your end users will be able to configure notification settings through a simplified global notification settings page. This update will enable them to choose from the two available Teams and channel notification preset options (All activity or Mentions & replies). For greater control over their channel, they can further customize their channel notification settings by clicking Custom.
The new settings can be accessed by selecting the profile picture at the top right corner of Teams, and then selecting Settings > Notifications.
MC249250 – Allowing anonymous presenters in Teams Live Events – GCC
Microsoft 365 Roadmap ID 70599
Note: This announcement only applies to customers who are currently able to utilize Live Events. If you do not currently have access to Live Events you may ignore this message.
We originally communicated this in MC240167 (Feb ’21). With this update, meeting organizers will be able to allow anonymous presenters in a Microsoft Teams live event.
When this will happen?
Rollout will begin in mid-April and complete by the end of May.
How this will affect your organization?
Your meeting organizers will now be able to schedule an anonymous presenter for a Teams live event when using the Teams desktop app.
Meeting organizers will indicate when scheduling the live event that they expect an anonymous presenter. This must be managed when scheduling the meeting.
The anonymous presenter must also use the Teams desktop app.

· PSTN (dial-in) users will not be supported in this new anonymous presenters workflow
· If this option is set, only invites users will be allowed directly into the meeting regardless of the lobby option set for the tenant
MC249248 – SharePoint site templates
Microsoft 365 Roadmap ID 70574
Updated April 29, 2021: We have updated the rollout timeline below. Thank you for your patience.
This new SharePoint release of scenario-based site templates will help you expand what’s possible with content, pages, and web parts while helping you quickly get started building your own site. Each template contains pre-populated content and web parts that are fully customizable to meet the needs of your organization. This is rolling out on SharePoint Online and mobile.
When this will happen?
· Targeted Releases (selected users and organizations): rolling out from late May (previously late April) to mid-June (previously mid-May).
· Standard Release: rolling out from mid-June (previously mid-May) to late June.
How this will affect your organization?
Users will be able to benefit from the ability to browse, preview, and apply site templates to a new or existing SharePoint site. Users can select a site template that meets organizational business objectives and best fits the site goal while ensuring a higher level of consistency throughout their organization. They can then review pre-populated content and customize the site to address their needs. This feature is default on with no admin control.
MC249245 – Microsoft Teams: Manage apps page in the Microsoft Teams admin center
Microsoft 365 Roadmap ID 81182
You will soon have access to the Manage apps page in Microsoft Teams admin center, providing a view into all available apps as well as the information you need to decide which apps to allow or block across your organization.
When this will happen?
Rollout will begin early April and should be complete mid-April.
How this will affect your organization?
View and manage all Teams apps for your organization from the Manage apps page in the Microsoft Teams admin center. For example, you can review the organization-level status and properties of apps; approve or upload custom apps to your organization’s app store; and block or allow apps at the organization level. Review the support doc to see the full list of capabilities.
MC249244 – New options for attachments in Outlook on the web
Microsoft 365 Roadmap ID 72212
Updated April 29, 2021: We have updated the rollout timeline below and updated the body to include links to additional details. Thank you for your patience.
This new Outlook on the web feature will bring users an updated experience when receiving email attachments. We are updating the look and contents of the attachments, and consolidating all options under a single menu (similar to Outlook for Mac and Outlook for Windows).
Additionally, users in tenants with OneDrive enabled will see new options in this menu and in the attachment previewer for Word, Excel, and PowerPoint files. This will provide the ability to directly begin editing Office attachments in the corresponding browser or desktop app.
When this will happen?
· Targeted release: We will begin rolling this out in mid-April and expect to complete rollout late April.
· Standard release: We will begin rolling this out in early May and expect to complete rollout mid-May.
· Government and Germany: We will begin rolling this out in early June and expect to complete rollout mid-June.
How this will affect your organization?
This release will enable your users to better collaborate by expanding how attachments look (icons have been added to menu) and what users can do with them. The hover over menu has been replaced with a single, always present click target for all actions.
Users can access Preview, Edit in Browser, Edit in Word desktop app, Save to OneDrive and Download. Clicking Edit in Browser or Edit in Word desktop app, saves a copy of the file to OneDrive and opens it in the corresponding web or desktop app. Once users make edits, they can then share back collaborative links with co-workers so others can work on the same file in real time.
New attachments with always present click target.

Edit in browser is new default option.

Edit in browser menu options.

Note: The change to replace the hover over menu with the always present click target will affect all users, not just companies with OneDrive. Non-OneDrive teams will not see the Edit in browser or Edit in Desktop app options in this menu.
What you need to do to prepare?
You might want to notify your users about this new capability and update your training and documentation as appropriate.
MC248427 – Customize apps in Microsoft Teams – GCC
This message is associated with Microsoft 365 Roadmap ID 70769
A new Microsoft Teams app customization feature gives you the ability to re-brand some Teams apps.
When this will happen?
Rollout begins mid-April and should be complete by late April.
How this will affect your organization?
When a Teams app allows customization, Global and Teams admins will be able to customize that app to match tenant branding.
What you need to do to prepare?
To determine which apps are customizable, go to the Teams admin center. Expand Teams Apps; select Manage apps; then check the Customizable column of the apps list and sort by apps that are customizable.
You might want to notify any admins on your team about this new capability and update your training and documentation as appropriate.
Learn more: Customize apps in Microsoft Teams
MC248395 – Teams: Join a meeting with digital meeting ID – GCC
Microsoft 365 Roadmap ID 80668
This release of Microsoft Teams Meeting ID will be rolling out across Microsoft Teams Desktop, Mobile and Web and will provide an additional way for users to join a Microsoft Teams meeting by entering a digital ID.
Key points:
· Timing: We will begin rolling this out in early May and expect to complete rollout by late May 2021.
· Roll-out: tenant level
· Control type: user control
· Action: review and assess
How this will affect your organization?
All meetings will have a Meeting ID that is automatically assigned to a Microsoft Teams user and added to the meeting invite under the meeting link. Meeting attendees can join the meeting by entering the Meeting ID. For all meeting attendees, the pre-join, lobby and security will remain the same.
MC248392 – Spoof intelligence management enhancements for policy, insights, and report
Microsoft 365 Roadmap ID 70590
The Spoof intelligence experience will introduce enhancements so that Security Administrators can gain better management of spoofing activity within their tenant. These feature updates will provide a clearer and easier way for Security Administrators to configure domain spoofing for both Cross-Org (External) and Intra-Org (Internal) email messages using a new “Tenant allow/block list policy” designed for Spoofing activity. Furthermore, users will be able to review insights provided by spoof intelligence system and take actions. Additionally, an enhanced Spoof detections report (also known as Spoof Mail Report) will show details about authentication results such as SPF, DKIM, DMARC, so users can assess configurations within their tenant and adopt industry email standards as applicable. This Spoof Mail Report will provide a historical view of up to last 90 days of spoofing activity using the report.
When this will happen?
Roll out will begin at the end of April and is expected to be completed by the end of June.
How this will affect your organization?
Once available, a new additional policy, “Tenant Allow/Block Lists” will appear in the list of Threat policies page, which will provide a page for “Spoofing” from where a Security Administrator can manage spoofed domains/users (i.e. email addresses) and allow or block them for the tenant. You need to have a Security Admin role as well as View-Only Configuration/View-Only Organization Management role.
As a Security Administrator, you can view, add, update, delete spoofed domain pairs using this Policy or optionally using the below PowerShell cmdlets.
· Get-TenantAllowBlockListSpoofItems
· New-TenantAllowBlockListSpoofItems
· Set-TenantAllowBlockListSpoofItems
· Remove-TenantAllowBlockListSpoofItems
Note: The existing ‘spoof intelligence policy‘ setting currently seen within the AntiSpam policy will no longer be available. You will be able to perform the actions to allow or block spoofed senders using the new Tenant allow/block lists-Spoofing policy. (Note, the legacy PS cmdlets Get-PhishFilterPolicy and Set-PhishFilterPolicy that are tied to the AntiSpam policy->Spoof intelligence policy will temporarily still be available, however it is not recommended that you use these as they will be retired in the future by the end of Dec 2021)
Furthermore, as you might be aware, currently you can review insights as suspicious or non-suspicious spoofed domains determined by Spoof intelligence system within the past 7 days. You will be able to continue reviewing these insights in an easier way – By using spoof intelligence insight pages when you click on “View suspicious domains” or “View non-suspicious domains” links and optionally using Get-SpoofIntelligenceInsight cmdlet. Note: The spoofing activity shown on these insight pages is purely determined by the Spoof intelligence system and accordingly allowed or blocked by the system, whereas the spoofing activity shown on Tenant Allow Block list-Spoofing page is purely determined by a Security Administrator. If you wish to update an action (shown as Allow/Block) on a particular existing domain pair while reviewing the spoof intelligence insight (in case you decide to override the action taken by Spoof intelligence), you must use the UX portal. Once you update the current action of an existing domain pair from Spoof intelligence insight page, that pair will no longer be shown on the Spoof intelligence insight page, but will be shown on Tenant allow/block list-Spoofing page because it is considered a pair determined by the Administrator.
For a detailed Spoof detections report and a historical view of up to the last 90 days of spoofing activity, you can view Spoof detections report or optionally use Get-SpoofMailReport cmdlet.
What you need to do to prepare?
You may consider updating your training and documentation as appropriate. An easy way to associate these pages is as below –
· Spoof intelligence insight page: Spoofing activity determined purely by the Spoof intelligence system within the last 7 days. (PS cmdlet: Get-SpoofIntelligenceInsight)
· Tenant allow/block list-Spoofing page: Spoofing activity determined purely by Security Administrator, never expires unless deleted by Administrator (PS cmdlets: Get-TenantAllowBlockListSpoofItems, New-TenantAllowBlockListSpoofItems, Set-TenantAllowBlockListSpoofItems, Remove-TenantAllowBlockListSpoofItems)
Spoof Detections report (or Spoof Mail report) page: Spoofing activity shown with detailed information about authentication results such as SPF, DKIM, DMARC ( up to last 90 days)
MC248212 – (Updated) Teams live event producers will see a separate window experience for managing events
Microsoft 365 Roadmap ID 81804
Updated April 02, 2021: We have updated this message for accuracy. Thank you for your patience.
Currently, a Microsoft Teams live event producer manages the a live event within the primary Teams window. With this update, producers will manage a live event in a separate Teams window.
Key points:
· Timing: early May; complete mid-May
· Roll-out: tenant level
· Control type: user control and admin control
· Action: review and assess by May 1
How this will affect your organization?
All feature and functionalities available in the in-window user experience will be available in the new, separate window experience.

What you need to do to prepare?
When this update is complete, the live event producer will always manage a live event in a new external window.
You might want to notify your users about this new capability and update your training and documentation as appropriate.
Learn more:
· Get started with Teams live events
· Produce a live event using Teams
MC248208 – Attack simulation training in Microsoft Defender for Office 365 – GCC
We are pleased to announce the General Availability (GA) of Attack simulation training in Microsoft Defender for Office 365 in GCC. Attack simulation training is an intelligent social engineering risk management tool that automates the creation and management of phishing simulations to help customers detect, prioritize and remediate phishing risks by using real phish and hyper-targeted training to change employee behavior
When this will happen?
This will be made available in May.
How this will affect your organization?
Attack simulation training in Microsoft Defender for Office 365, available on security.microsoft.com will be available to all GCC customers to simulate and train all employees in phishing risks and measure changed behavior.
What you need to do to prepare?
Try out Attack simulation training in Microsoft Defender for Office 365: https://security.microsoft.com/attacksimulator
MC248005 – Changes to the way Exchange Online Protection (EOP) moves email to Junk folder
Updated April 29, 2021: We have updated the rollout timeline below. Thank you for your patience.
Note: This change will only effect Exchange Online Protection (EOP) customers with Exchange online mailboxes. EOP standalone customers with hybrid environments will have no impact.
Today EOP depends on the junk email rule to move spam/phish messages to a user’s Junk folder based on the spam confidence level set by EOP. Going forward EOP will use it’s own mailflow delivery agent to move malicious emails to the Junk folder depending on the policy set by security admins in Antispam policy. EOP will continue to honor the user safe sender/block sender preferences set in outlook just as the junk email rule does today.
Key points:
· Timing: This change will be rolled out starting in mid-May (previously late-April) through mid-June (previously end of May).
· Action: review and assess impact for your organization.
How this will affect your organization?
If your organization has users or mailboxes where the Junk email rule is disabled either due to an Exchange admin disabling it using the Set-MailboxJunkEmailConfiguration PowerShell command or a user using a legacy(now removed) outlook web setting to disable junk, EOP will not honor that setting. EOP detected spam or phish emails will still be routed to Junk.
What you need to do to prepare?
If you do not want EOP to perform spam filtering for a mailbox, please use the Anti-spam policies or Exchange transport rules to manage accordingly.
MC248001 – Microsoft Teams: new experience for Planner users – GCC
Microsoft 365 Roadmap ID 68950
Updated April 27, 2021: We have updated the rollout timeline below. Thank you for your patience.
We are updating the Planner user experience in Microsoft Teams to include both To Do and Planner together in one place as initially announced in MC211421 (April 2020). This will only impact the Teams desktop apps and Teams on the web.
Key points:
· Timing: Begins mid-May (previously late April), complete by late May (previously mid-May)
· Roll-out: tenant level
· Control type: user control
· Action: Review and assess
How this affects your organization?
In Microsoft Teams, the Planner app is being renamed Tasks by Planner and To Do; the app name will eventually be shortened to Tasks. The app experience puts individual tasks from To Do and collaborative plans from Planner into one place.
Users will see their individual tasks powered by To Do (which also powers Outlook tasks) and their team tasks powered by Planner. Existing Planner tabs will behave as they do today; however, they will provide an additional list view. Users will be able to add new Tasks tabs to the channels in teams they belong to. Users can also access the Tasks app in the same ways they previously accessed the Planner app.
MC247826 – New PowerPoint Live Presentation option with desktop and window sharing – GCC
This message is associated with Microsoft 365 Roadmap ID 66587
Updated April 22, 2021: We have updated the rollout timeline below. Thank you for your patience.
When making a Live Presentation, presenters will soon be able to add a video feed to the presentation. This feature is available for presenters using the Microsoft Teams desktop app for both Windows and Mac.
When this will happen?
Rollout is early May (previously mid-April) through late May (previously mid-May).
How this will affect your organization?
Currently, when using a Teams desktop or mobile app, presenters first connect to the Teams call, share the presentation in PowerPoint for the web, and then select Present Live.
When using the Teams Desktop app, the presenter will have a new option, Standout mode. When a presenter selects Standout mode, participants will see the presenter’s video feed superimposed onto the foreground of the content being shared. This mode appears to meeting participants who are using the Teams desktop or mobile app as well as Teams on the web.

Meeting presenters can customize the participant view before starting the meeting or after it has begun.
The presenter can easily enable or disable the video feed can during the Live Presentation.
MC247659 – New breakout room functionality coming to Microsoft teams – GCC
This feature is associated with Microsoft 365 Roadmap ID 81372
We announced breakout rooms in Microsoft Teams last fall (MC224343). We are adding persistent breakout rooms; the ability to reassign participants when rooms are open; and the ability for organizers to set timers for breakout sessions.
When this will happen?
Rollout will begin mid-April and should be complete by late April.
How this will affect your organization?
Organizers who are configuring and managing Breakout Rooms on a Teams desktop client will have access to these three options. For participants, the feature is supported by all devices and clients that support breakout room participation..
1. Room assignment retention (new default behavior)
Participants remain assigned to their breakout rooms unless the meeting organizer chooses to change them. The assignment persists across subsequent sessions or recurring meetings.
2. Participant reassignment while rooms are open
Organizers may reassign joined participants across rooms and the main meeting room when the breakout rooms are open. Currently reassignment works only when breakout rooms are closed.
3. Set timers for breakout sessions
Organizers can set a timer for all breakout rooms created in a meeting session via the Breakout rooms settings panel.
When the organizer has set a timer, the clock will show participants the time left in the room (countdown) rather than time elapsed.
The timer alerts participants that the breakout room session will close in 60 seconds. The organizer can choose:
· to automatically redirect participants to the main meeting room (auto-move On) or
· to provide participants with the option to return to the main meeting room or disconnect. Should the timer expire before participants take action, they will see an alert informing them that the session has ended which contains a button to return to the main meeting.
Notes:
· Once the organizer opens a timed breakout room, participants are invited to join; the timer starts when the first participant joins.
· If no participants join, the breakout room will not open.
· If all participants leave a breakout room before the timer expires, the room will close automatically.
Learn more: Use breakout rooms in Teams meetings will be updated after launch.
MC247658 – Zip file partial downloads no longer available
Starting May 2021, it will no longer be possible to download individual files or subsets of files within .zip file previews in OneDrive and SharePoint on the web . Instead we recommend downloading the entire .zip file, extracting its contents and using the files needed. In the past, we have received customer feedback that at times when a user selects a subset of files to download from within a .zip file, the files are not downloaded successfully. As we focus our investments on downloading entire .zip files, we are retiring the partial download feature as users can edit .zip files as needed once downloaded.
Key points:
· Timing: Early May 2021
· Action: review and assess for your organization
How this will affect your organization?
Users will no longer be able to download individual files from .zip file previews in OneDrive and SharePoint on the web when this change is implemented. Users will maintain the ability to preview and navigate through the contents of a .zip file. If a user wishes to download the partial contents of a .zip file, they must download the entire .zip file. They may then delete any unnecessary files from the downloaded .zip.
MC247656 – PowerPoint Live: Present to Teams from PowerPoint Web App
Microsoft 365 Roadmap ID 80600
This new PowerPoint for the web feature release will provide access to PowerPoint Live in Teams and with just one click, will make it easier for presenters to present their presentations from PowerPoint directly to their remote meeting audience.
When this will happen?
We will begin rolling this out in early May and complete rollout by mid-May.
Government: will begin rollout in late May and complete rollout by early June.
How this will affect your organization?
While in a Teams meeting, users will be able to present their slide presentations with one click of the Present in Teams button in PowerPoint for the web to the remote audience in Teams in PowerPoint Live mode.
MC247650 – Important Information about your Power Apps service – GCCH
Starting on April 30, 2021, Power Apps created using the SharePoint list app generation experience will display an in-app list of experiences in Power Apps mobile experiences when shared with Everyone.
Currently, Power Apps created using SharePoint list app generation that are shared using ‘Everyone’ as the audience are not discoverable to end-users using a Power Apps mobile client.
These apps are connected to the SharePoint list from which they’re created, and they may be played outside of SharePoint experiences. These apps are different from Power Apps used to customize SharePoint list forms, which are only accessible in SharePoint list experiences and will continue to only be accessible in SharePoint list experiences.
How does this affect me?
Users that have been provided access to an app generated from a SharePoint list will begin to see these apps listed in the Power Apps mobile experiences. This includes apps that have been shared using ‘Everyone’ as the audience.
Users that don’t have permission to access the app will not see the app listed in Power Apps mobile experiences. App Makers and admins will have the option to change the audience the app is shared with.
MC246710 – (Updated) New experience of the Participant roster – GCC
This message is associated with Microsoft 365 Roadmap ID 80385
Updated April 27, 2021: We have updated the rollout timeline below. Thank you for your patience.
We are changing how the Participant list is displayed for the Lobby, In meeting, Presenters, and Attendees participant sections in a Microsoft Teams meeting (desktop clients and Teams on the web).
When this will happen?
This change is rolling out early May (previously late March) through mid-May (previously mid-April).
How this will affect your organization?
A maximum of 20 participants for each of the sections will be displayed in the initial view, with an option to drill in and view all participants within that section. In the lobby view, meeting organizers can review the full list before admitting all into the meeting.
· The roster will display details of up to 260 of the most active participants in the meeting arranged in alphabetical order.
· There are no changes to the participants action menu.
MC246708 – (Updated) Improved search experience in the participant roster – GCC
Microsoft 365 Roadmap ID 80421
Updated April 27, 2021: We have updated the rollout timeline below. Thank you for your patience.
We are expanding the search experience for Teams meeting attendees who wish to examine the participant roster when using Teams desktop or Teams on the web. This feature update does not apply to Teams mobile.
When this will happen?
Rollout will begin in early May (previously late March) and should be complete in mid-May (previously mid-April).
How this will affect your organization?
From the search box in the roster, users can now search in meeting participants and take action on them. They can continue to search for participants outside the meeting and request that they join the meeting.
MC246706 – Updating Teams live event ‘Never record’ recording policy
Updated March 29, 2021: We have updated the title to reflect the correct policy. We apologize for any confusion.
We are changing the behavior of the ‘Never record’ recording policy for Microsoft Teams live events.
Key points:
· Timing: late April
· Roll-out: tenant level
· Control type: user control and admin control
· Action: review and assess by April 26, 2021
How this will affect your organization?
Before this update, the Teams live events organizer could enable attendee recordings despite your having set the Teams live event Recording policy to ‘Never record.’
With this change, when the Teams Live Event Recording policy is set to ‘Never record’, all live events will have the recordings disabled for everyone: the presenter, organizer, and attendees.
There are now three policy settings:
· Always record
· Never record
· Organizer can record or not
MC246704 – (Updated) Improvements in managing attendee audio in Microsoft Teams Meetings
This message is associated with Microsoft 365 Roadmap ID 80261
Updated April 01, 2021: We have updated the message with additional details for clarity. Thank you for your feedback.
Teams meeting organizers and presenters who use the attendee audio management feature will have greater flexibility to determine when attendees can use their microphone.
These updates apply to Teams desktop apps, Teams mobile apps, and Teams on the web.
When this will happen?
· Rollout will begin with production and GCC tenants in early April and should be complete by late April.
· Rollout will begin to GCCH and DOD tenants in early May and should be complete by late May.
MC246446 – (Updated) Outlook – Suggested replies available for GCC subscriptions
Microsoft 365 Roadmap ID 70719
Updated April 29, 2021: We have updated the rollout timeline below. Thank you for your patience.
Outlook on the web, iOS, and Android are rolling out suggested replies to customers with government licenses in GCC in the following languages: Chinese (Simplified), English, French, German, Italian, Portuguese, and Spanish.
When this will happen?
Outlook mobile will begin rollout in early May (previously late April) and be completed by the end of June (previously mid-June).
Outlook on the web will begin rollout in late April (previously early April) and be completed by mid-May (previously mid-April).
How this will affect your organization?
When this feature rolls out to your tenant, your users will see three options for suggested replies if people are having an email conversation in Outlook on the web, iOS or Android in any of the supported languages.
· Chinese (Simplified)
· English
· French
· German
· Italian
· Portuguese
· Spanish.
Users can select a suggested reply and still have the option to keep editing until they click or tap on “send”.
MC246221 – (Updated) Multiple Spotlights coming to Teams meetings – GCC
Microsoft 365 Roadmap ID 80425
Updated April 22, 2021: We have updated the message to include the mobile client and additional images for clarity. Thank you for your patience.
This release of Multiple spotlights in Teams meetings will allow organizers and presenters to spotlight up to 7 participants simultaneously for everyone to see during meetings and will roll out across Microsoft Teams Desktop, Mobile and on the Web.
When this will happen?
This feature will rollout from early May (previously mid-April) through mid-May (previously end of April).
How this will affect your organization?
Users, when they are the meeting presenters or organizers, can now spotlight more participants in Team meetings than ever before. The spotlighting of selected participants will be maintained on their videos or avatars for everyone to see until turned off by the presenter or organizer.
Presenters/organizers can now:
· Start spotlight on multiple participants by accessing their context menu from the participant roster or from the stage
· Stop individual spotlights or stop all spotlights in bulk from the roster
· Spotlight a maximum of 7 participants simultaneously in a meeting
MC245998 – (Updated) Microsoft Teams: Call Merge
Microsoft 365 Roadmap ID 66054
Updated April 29, 2021: We have updated the rollout timeline below. Thank you for your patience.
Call Merge gives end users the capability to merge their active unheld 1:1 call into another 1:1 call or another group call. This applies to Teams VOIP calls and PSTN calls.
When this will happen?
This feature will start rolling out in late March and will complete rollout by the end of May (previously end of April).
MC245847 – (Updated) Microsoft Lists: new Integrate drop-down menu, powered by SharePoint
Microsoft 365 Roadmap ID 64869
Updated April 16, 2021: We have updated the rollout timeline below. Thank you for your patience.
As part of updating the command bar at the top of Microsoft Lists, we are introducing a new top-level menu item: Integrate. This is the home for features that help extend list experiences.
When this will happen?
· Targeted Release (organization) rollout begins late March; Standard Release rollout should be complete at the end of April (previously mid-April).
How this will affect your organization?
The existing command buttons for Power Apps and Power Automate will move into Integrate.

Once the new experience is available, the Power Apps menu option will disappear. End users will need to navigate to the Integrate menu option to access both Power Apps and Power Automate.

MC245824 – (Updated) Customizable Praise for Microsoft Teams – GCC
Microsoft 365 Roadmap ID 80913
Updated April 23, 2021: We have updated the rollout timeline below. Thank you for your patience.
The Praise app in Microsoft Teams is designed to help recognize the effort that goes into the wide range of work that Teams users do.
With this update, we have added Praise settings to the Microsoft Teams admin center.
When this will happen?
Rollout is expected to begin in mid-May (previously late April) and complete at the end of May.
How this will affect your organization?
Nothing in Praise will change until you take action. With this change, you can upload up to 25 custom Praise badges and disable the current default Praise badges.
MC245302 – (Updated) PowerPoint Live in Teams: Slide Translation
Microsoft 365 Roadmap ID 80601
Updated April 16, 2021: We have updated the rollout timeline below. Thank you for your patience.
This new slide translation feature in Microsoft Teams (desktop) will enable all meeting attendees to translate presentation content, presented via PowerPoint Live in a Teams meeting, into a language of their choice while in private view.
When this will happen?
We will begin rolling this out in early May (previously late April) and expect to complete rollout by early June (previously late May).
How this will affect your organization?
Meeting attendees will see the slide translation feature when the presenter uses PowerPoint Live in a Teams meeting. Each meeting attendee will be able to convert the slide show content into one of nineteen languages of their preference. This unique experience will only occur for the user requesting slide translation without interrupting the presenter or any other attendees in the meeting.
PowerPoint slide translation available in nineteen languages.

MC245020 – (Updated) Prevent attendees from sharing video feed in Microsoft Teams Meetings – GCC-High, DoD
Microsoft 365 Roadmap IDs 80221 and 80224
Updated April 27, 2021: We have updated the rollout timeline below. Thank you for your patience.
Meeting organizers and presenters will be able to prevent meeting attendees from turning their camera on to share video during a meeting. Currently meeting organizers and presenters have no control over whether meeting attendees can share video.
When this will happen?
Rollout begins mid-June (previously early June) and should complete by the end of June (previously mid-June).
How this will affect your organization?
By default, meeting attendees will be able to turn their camera on or off to share video, which is the current experience.
There are three ways that meeting organizers or presenters may manage the attendees’ camera.
Before a meeting, the meeting organizer can set Enable camera for attendees to Off from the Meeting Options web page. By default this is on, which means that attendees can share their video feed. Note that this change does not mean attendees will be forced to share video.
MC245019 – (Updated) New predictive coding module in Advanced eDiscovery
Microsoft 365 Roadmap ID 70805
Updated April 06, 2021: We have updated the rollout timeline below. Thank you for your patience.
eDiscovery managers will soon have access to an enhanced predictive coding module without moving data outside the Microsoft 365 security and compliance boundary. They will be able to create and train models within Advanced eDiscovery using as few as 50 documents.
When this will happen?
Timing: available as preview release at the end of May (previously mid-April)
MC244912 – (Updated) Focus mode for modern SharePoint Pages
Microsoft 365 Roadmap ID 70800
Updated March 31, 2021: We have updated Roadmap ID to point to the correct item. Thank you for your feedback.
We’re excited to share that this coming release will enable SharePoint page authors and viewers to focus on a greater amount of page content by hiding the site header, site navigation, and global navigation bar with one click.
When this will happen?
Rollout begins with targeted release (select user and organization) in late March and will be complete in late April.
GA begins rolling out in early May and will be complete by late May.
MC244747 – (Updated) Forms response receipt – MVP2 support for GCC/GCC High/DoD
Microsoft 365 Roadmap ID 70803
Updated April 20, 2021: We have updated the rollout timeline below. Thank you for your patience.
With this update, forms designers can provide two ways respondents can make a copy of their responses to a form.
When this will happen?
Rollout will begin in late May (previously late March) and will complete in early June.
How this will affect your organization?
When a Forms designer turns on confirmation emails in settings, Forms will send a confirmation email to in-tenant respondents who have completed a form. That email contains a link which allows the respondent to print a copy of their responses.
In addition, enabling confirmation emails adds a Print/Download option for all respondents (both within and outside of your organization) on the “Thank you” page they see after completing the form.
MC244745 – (Updated) Prevent attendees from sharing video feed in Microsoft Teams Meetings – GCC
Microsoft 365 Roadmap IDs 70620 and 70621
Updated April 22, 2021: We have updated the rollout timeline below. Thank you for your patience.
Meeting organizers and presenters will be able to prevent meeting attendees from turning their camera on to share video during a meeting. Currently meeting organizers and presenters have no control over whether meeting attendees can share video.
When this will happen?
Rollout begins early May (previously mid-April) and should complete in mid-May (previously late April).
How this will affect your organization?
By default, meeting attendees will be able to turn their camera on or off to share video, which is the current experience.
There are three ways that meeting organizers or presenters may manage the attendees’ camera.
Before a meeting, the meeting organizer can set Enable camera for attendees to Off from the Meeting Options web page. By default this is on, which means that attendees can turn share their video feed. Note that this change does not mean attendees will be forced to share video.
During a meeting, either the organizer or a presenter can reverse that setting so that all attendees can turn their camera on. They can also enable or disable the camera of individual attendees.
Note: This setting only affects meeting attendees. It does not affect video for presenters or the meeting organizer.
MC244599 – (Updated) De-identify personally identifiable information in Teams admin usage reports – GCC, GCC-High
Microsoft 365 Roadmap ID 70774
Updated April 09, 2021: We are pleased to announce that this feature has completed rolling out and is available in your organization as applicable. Additionally, we have added a link for more information.
Usage reports in Teams admin center currently exposes user identifiable information like AAD Id, User name, email etc. in various reports (like Teams user activity, device usage reports )
Currently, M365 admin center Teams usage report has capability to de-identify personal information which is present in usage reports available in M365 admin center (see more). However, these settings don’t apply to usage reports available in Teams admin center.
We are introducing a capability where Global admin can de-identify PII information in Teams usage reports based on Anonymization setting available in M365 admin center. This will help global administrators to hide Personally identifiable information of users in your organization.
Key points:
· Timing: roll out to begin in early April and expect to complete by mid-April
· Action: review and assess impact for your organization and updating settings as appropriate
MC244295 – (Updated) New eCDN Ramp available for Microsoft Teams – GCC
Microsoft 365 Roadmap ID 80825
Updated April 29, 2021: We have updated the rollout timeline below. Thank you for your patience.
Note: This was originally posted as MC242584 that was removed prematurely. Thank you for your patience.
Soon you will be able to use a new Enterprise Content Delivery Network (eCDN), Ramp, should you need a CDN for live events in Microsoft Teams.
When this will happen?
We will begin rolling this out in early May (previously late March) and expect the rollout to be complete by mid-May (previously early May).
How this will affect your organization?
Ramp, the industry standard for video content delivery within the enterprise, will soon support Microsoft Teams customers (already supported in Microsoft Stream). With this support you will be able to deliver secure, reliable, high-quality video, at scale throughout your enterprise.
This change brings the familiar Ramp eCDN options to Teams Live Events in your tenant. Your current selection should not be impacted by this addition.
What you need to do to prepare?
Ramp will be an option in the Microsoft Teams admin center or you can select it via PowerShell:
· Set-CsTeamsMeetingBroadcastConfiguration -AllowSdnProviderForBroadcastMeeting $True -SdnProviderName ramp -SdnRuntimeConfiguration “{config provided by RAMP}”
MC244069 – (Updated) Task publishing feature for frontline organizations now available in Microsoft Teams – GCC
Microsoft 365 Roadmap ID 68950 and 68951
Updated April 23, 2021: We have updated the rollout timeline below. Thank you for your patience.
We are introducing task publishing and reporting features within the Tasks app in Teams. This allows an organization to define the tasks that need to be completed across their frontline locations, choose which locations need to complete those tasks, and track the progress of the work. Frontline managers and workers can use the desktop or mobile Tasks in Teams experience to see the tasks they need to complete, all in one place.
When this will happen?
Rollout is expected to begin in late May (previously late April) and complete by late June
How this will affect your organization?
Task publishing lets companies create tasks centrally at the corporate level and publish those tasks to different frontline locations like stores, factories, and clinics. You can publish to all teams or choose specific locations based on customizable characteristics like size or layout.
For example, leadership for a nationwide retailer can create tasks for the reopening of their stores, send that list to only the affected store locations, and then track progress against the tasks at those locations. Managers on those store teams can easily assign tasks to individual employees. Meanwhile, the frontline Workers at those store locations will see a simple list of the tasks assigned to them whether they log in backstage or use a personal or company-issued mobile device.
You will not see any changes in your admin or end user experiences unless you take steps to enable task publishing. With task publishing, your organization can publish task lists targeted to specific locations (teams) across your organization to define and share a work plan to be completed at those locations.
· Frontline workers have a simple mobile experience to see tasks assigned to them. They can attach photos to show their work when appropriate and mark their tasks as completed.
· Managers on the recipient teams can review the published tasks and assign individual tasks to team members.
· People on the publishing team, such as corporate or regional leadership, can create task lists and publish them to specific teams.
· Publishers and managers can view reports to see assignment and completion status of tasks they’re tracking.
What you need to do to prepare?
The feature will be disabled until an admin in your organization enables it by uploading a team targeting hierarchy as summarized below.
Task publishing is an additional feature within the Tasks app in Teams. The Tasks app is enabled by default for all Teams users in your organization. You can configure the app at the org level on the Manage apps page in the Microsoft Teams admin center.
To enable task publishing in your organization, you must upload a schema file via our PowerShell cmdlet. This schema file defines how all the teams in your hierarchy are related to each other, and it defines which teams can publish to which other teams. It also defines the attributes available to filter and select recipient teams when publishing. After you create the schema, you will use PowerShell to apply it to your organization. Members of any team that has child teams in the hierarchy can publish tasks. For example, a user who is part of a Retail Operations team that has children in the hierarchy will be able to create a task list and choose which teams to publish those tasks to.
Learn more:
· Assign tasks in Teams
· Manage the Tasks app for your organization in Microsoft Teams
· Publish task lists to create and track work in your organization
· Set up your team targeting hierarchy
MC243207 – (Updated) Important update: Microsoft Dataverse Backfill for Office GCC and GCC High SKUs
Updated March 30, 2021: We have updated this message with additional details for this release.
Microsoft Dataverse for Teams will be available to your organization. Microsoft Dataverse for Teams delivers a built-in, low-code data platform for Microsoft Teams. It provides relational data storage, rich data types, enterprise-grade governance, and one-click solution deployment. Dataverse for Teams enables everyone to easily build and deploy apps.
You can familiarize yourself with the FAQ documentation to learn about the benefits and capabilities that will soon become available to you and your users. You can also learn more about Teams environments and how to manage these environments within your organization.
We are reaching out to provide an update to admins about the availability of Microsoft Dataverse.
Key points:
· Timing: April 2021
· Action: review and assess for your organization
MC243041 – (Updated) Announcing Tenant-level Organizational Theme Capabilities for Global Admins – GCC
Microsoft 365 Roadmap ID 70551
Updated April 02, 2021: We have updated the post for clarity. Additionally, we have updated the rollout timeline below. Thank you for your patience.
Organizational Theme provides you the ability to define multiple themes within your organization, from the Microsoft 365 global admin center, using Microsoft 365 Groups. Each theme can be further customized by specifying mobile-specific and alternate dark mode logo experiences.
Key points:
· Timing:
o Targeted release: we will begin rolling this out in mid-April (previously early April) and expect to complete rollout by early May (previously mid-April).
o Standard release: we will begin rolling this out in mid-May (previously late April) and expect to complete rollout by mid-June 2021.
· Roll-out: tenant level
· Control type: admin control
· Action: review and assess
MC242824 – (Updated) Microsoft Teams: Dynamic View – GCC
Microsoft 365 Roadmap ID 65943
Updated April 22, 2021: We have updated the rollout timeline below. Thank you for your patience.
Microsoft Teams is excited to introduce Dynamic view, a redesigned and optimized meeting stage that will optimize your experience of consuming shared content and engaging with video and audio participants.
When this will happen?
This feature will rollout in mid-May (previously mid-April) through the end of May (previously end of April).
How this will affect your organization?
All users will get a new optimized visual experience in Teams Meetings.
Dynamic view will enable:
· Video and audio participants to be shown separately, with audio participants appearing as smaller circles
· Shared content to appear larger, with more participants being visible
· Users to pin or spotlight particular people in the meeting and make them appear larger than other participants
· You to view Together Mode alongside content
· Users to dock the participant gallery to the top of their screen
MC242588 – (Updated) Advanced eDiscovery: UX changes to review sets for cases
Updated April 06, 2021: We have updated the rollout timeline below. Thank you for your patience.
We are updating the Advanced eDiscovery user interface (UI) for review sets.
Key points:
· Timing: we will begin rolling out at the end of May (previously early April) and expect to complete by early June
· Roll-out: tenant level
· Action: review and assess
How this will affect your organization?
With this release, user controls have been built on top of a new UI framework. Changes include enhancements in the workflow for filter and querying as well as an update in general layout of controls.
This new UI supports all existing functionality within the review set and does not add major features.
MC242587 – (Updated) Increasing interactive meeting participants and chat from 300 to 1000
Microsoft 365 Roadmap ID 65951 and 68844
Updated April 22, 2021: We have updated the rollout timeline below. Thank you for your patience.
Currently, we allow only 300 users to be added to interactive meetings. We are going to increase the meeting participant and chat size from 300 to 1000.
When will this happen?
We will start rollout early May (previously early April) and expect to complete by mid-May (previously end of April).
MC242586 – (Updated) Planner’s New Roaster Containers
Updated April 14, 2021: Thank you for your feedback. At this time we will not be moving forward with rolling out the feature as outlined. We are evaluating changes based on feedback and will announce our new plan via Message center when we are ready proceed. Your feedback is greatly appreciated.
This release of a new type of container in Planner will allow plans to be created independent of an M365 group. This will be enabled by Roster containers, which is a simple list of members stored in Planner that can contain any user with a valid AAD ID in that tenant. We are calling plans contained by Rosters “Roster plans”.
· Upcoming follow-on features, taking advantage of this new Plan type, will be released on the Roadmap.
When this will happen?
We will communicate via Message center when we are ready to move forward.
How this will affect your organization?
When this feature is released, plans for collaboration can be created outside of M365 groups. Roster plans are not subject to existing M365 group controls.
The basic functionality of Roster plans is:
· There is currently no UI in Planner to create a Roster plan, but Roster plans can be created and membership managed via Graph APIs. Anyone in a tenant can create these plans using those APIs. We are also working on building end user experiences that will provide UI for users to create Roster plans. These plans will live alongside existing M365 group plans.
· All members have equivalent permissions: Via the Plan UI, any existing member can add / remove other members to the Roster as well as create / edit / delete tasks
· Plan collateral associated with an M365 group is disabled in these plans, incl. links to the group OneNote / SP Site, comments on tasks, and uploaded attachments
· The Roster and the plan contained by the Roster automatically self-delete when the last member is removed from the Roster
· There are no other changes to Plan functionality for Roster Plans
MC240169 – (Updated) Teams meetings to support view-only attendees – GCC-High, DoD
Microsoft 365 Roadmap ID 65952
Updated April 16, 2021: We have determined that this message did not go to the correct audience and you can safely disregard this message. We will post a message to the correct audience with additional details in the near future. We apologize for any confusion.
Microsoft Teams will soon support up to 20,000 meeting attendees as view-only participants when the attendee is accessing a meeting via a Teams desktop application (Windows or Mac), Teams on the web, or Teams mobile (Android and iOS). This feature applies to those with E5, E3, A5, or A3 licenses.
When this will happen?
· Phase 1, a temporary increase to 20,000 view-only participants runs from late February through the end of June
· Phase 2, view-only participant capacity will revert to 10,000 view-only participants the first of July
How this will affect your organization?
Currently, Teams meetings are limited to 300 users. If someone tries to join a meeting after it reaches capacity, they are unable to do so. With this update, meeting organizers who are assigned an appropriate license will be able to host a Teams meeting that has overflow capacity.
· Up to 20,000 view-only attendees may join a meeting from late February through the end of June
· Up to 10,000 view-only attendees may join a meeting after July 1, 2021
Similar to Teams Live Events limit increases, during this peak remote work time, we have temporarily increased attendee limits.
Meeting organizers will not see view-only participants in attendee counts or reports; this feature does not support the e-discovery of data. Organizers cannot remove view-only attendees from a meeting.
When a meeting organizer enables this overflow feature:
· After a meeting reaches capacity (300 users), people will be able to join as view-only attendees, with the maximum number limited by the phase
· View-only attendees will not impact the normal interaction available for regular attendees (those who joined before the meeting reached capacity).
· Once the view-only attendee limit is reached, no additional view-only attendees will be able to join.
View-only attendees do not need a special SKU to join the meeting in a view-only capacity. However, they do need permission to bypass the Lobby based on set Lobby Policies or Options.
· View-only attendees will follow all lobby and security policy mechanisms.
· View-only attendees will have limited access to meeting features. For example, view-only attendees will be able to listen to all audio and view a screen or window shared during the meeting. However, they will be unable to share audio or video, and they will be unable to see chat or other applications that are shared during the meeting.
What you need to do to prepare?
This feature is OFF by default for your users.
You may use PowerShell to enable this feature for your entire tenant while you prepare to assign the licenses.
· Set-CsTeamsMeetingPolicy -Identity Global -StreamingAttendeeMode Enabled
Note: The view-only attendance feature is provided using Teams live events streaming services.
Learn more
· Meeting policy settings – Participants & guests
· Teams view-only meeting experience
MC240066 – (Updated) Introducing a SharePoint app bar that features global navigation – GCC
Microsoft 365 Roadmap ID 70576
Updated April 09, 2021: Based on learnings from our early rings, we have made the decision to make additional changes before we proceed with the rollout. We will this Message center post once we re-start the rollout. Thank you for your patience.
Your SharePoint modern communication and team sites will soon feature the SharePoint app bar which provides quick access to customizable global navigation as well as other intranet resources. The SharePoint app bar makes important content and resources easily accessible for users on these sites, regardless of where they might be in SharePoint.
Key points:
· Timing:
o We will update this post with timing once available.
· Roll-out: tenant and user level
·
· Action: review and assess
How this affects your organization?
Users access the SharePoint app bar from the upper left-hand side of the browser on the SharePoint start page and throughout modern SharePoint sites. The SharePoint app bar improves global wayfinding and dynamically displays personalized content for sites, news, and files.
The app bar features customizable global navigation that leads to important intranet resources. Personalized content, news and files, is driven by Microsoft Graph and cannot be customized.
What you need to do to prepare?
Please review these admin notes in the support document.
If you take no action, the new SharePoint app bar will appear on your SharePoint modern communication and team sites. Until you customize it, the global nav entry point will refer your users to their SharePoint start page.
· You can temporarily disable the SharePoint app bar until October 31, 2021 in your tenant to prepare for this change or to control its rollout to users.
· Customizing the global navigation tab requires that you have an organization home site. Learn how to set up a home site. You can set up a home site just for global navigation.
MC239262 – (Updated) Enforcing mailbox receiving limits
Updated April 29, 2021: We have updated the rollout timeline below. Thank you for your patience.
We are updating the way we enforce our receiving limits in Exchange. Starting in May 2021, we will be more strictly enforcing limits across all mailboxes to protect the health of our systems and ensure optimal mail flow performance for all customers.
Mailboxes that receive high message volume in a short time can cause mail flow delays, both for individual recipients and across your organization.
With these changes, emails will be throttled for recipients that exceed our published and established threshold of 3600 messages per hour. While this is not a new limit, it has been a soft limit before – we’ve ensured up to 3600 but in some cases supported higher volume. We are now making this a hard limit.
Key Points:
· Timing: May 2021
· Action: review and assess
How this will affect your organization?
Rollout will begin for all tenants at the same time, and we will enforce limits incrementally by starting with a higher throttling threshold, then gradually lowering the threshold until we reach the established limit. This gives you time to reach out to users that are exceeding the limit, which you’ll be able to monitor in the Exchange Admin Center through a new “Mailboxes exceeding receiving limits” insight and report.
Note: Most users are not likely to be impacted by this, as only a small percentage of mailboxes are currently hitting receiving limits.
If a mailbox exceeds the established limit, messages to that mailbox will be throttled. Affected mailboxes will receive an email informing them of the throttling, while senders to these mailboxes will receive a non-delivery report specifying that the recipient has been getting too many messages. Emails will be throttled until the limit resets one hour from when the threshold was exceeded, allowing the mailbox to accept messages again.
Administrators will be able to monitor users that exceed their receiving limits through the new “Mailbox exceeding receiving limits” insight and report in the Exchange Admin Center. The insight and report will be released end of March, prior to when rollout of limit enforcement begins.
When one or more mailboxes in your organization hit the receiving limit, an insight titled “Some mailboxes need attention: one or more mailboxes have exceeded their receiving limits” will appear in your dashboard via the “Insights” tab.
From this insight, or from the “Reports>Mail flow” tab, you can open the “Mailbox exceeding receiving limits” report, showing mailboxes that have hit or are at risk of hitting the receiving limit in the last 24 hours. You will also find the mailbox owner’s contact information. Please contact affected users to understand why they are receiving so many messages and inform them of ways to reduce mail volume and improve their experience.
What you need to do to prepare?
No direct action is required on your part, though it is recommended that you review the established limits and update training and documentation as appropriate.
· Review the published receiving limits at Exchange Online limits – Service Descriptions | Microsoft Docs
· Inform users of actions they can take to reduce mail load
High mail load is often caused by automated mailers. If an automated mailer is sending high volume to a single mailbox, users should configure the mailer to deliver across a longer period or to multiple mailboxes.
MC238796 – (Updated) 1:1 Call recording policy introduction
Updated April 29, 2021: We have updated the rollout timeline below. Thank you for your patience.
We are changing how 1:1 Call recording is enabled by creating its own policy.
Key Points:
· Control: via PowerShell
· Action: Review settings and make changes by May 31, 2021 (previously April 12, 2021)
How this will affect your organization?
Currently, 1:1 Call recording is controlled by the -CsTeamsMeetingPolicy / AllowCloudRecording attribute. After this change, it will be controlled by the -CsTeamsCallingPolicy / allowCloudRecordingForCalls attribute.
By default this new policy attribute will be set to false, so 1:1 call recording will not work unless you change this attribute to true.
What you need to do to prepare?
If you are currently using 1:1 Call recording and would like to continue doing so, please update the -CsTeamsCallingPolicy / allowCloudRecordingForCalls attribute to true.
· You can make this change immediately.
· If you do not change the attribute, once the policy enforcement is rolled out, users using the 1:1 Call recording feature will not be able to use this feature.
If you do not want to have 1:1 Call recording enabled, you do not need to do anything.
NOTE: This new policy attribute relates to the Microsoft Teams Recording solution for 1:1 calls. This attribute does not affect 1:1 Compliance Recording, which is still controlled via the Compliance Recording policy.
MC237669 – (Updated) Forms is getting a new start page
Microsoft 365 Roadmap ID 80044
Updated April 09, 2021: We have updated the rollout timeline below. Thank you for your patience.
We are replacing the existing Forms portal page at forms.office.com with a new Forms start page at Office.com (Office.com > Forms).
Key points:
· Timing: early May (previously mid-April) through the end of May (previously end of April)
· Roll-out: tenant level
· Action: review and assess
How this will affect your organization?
This update replaces the existing Forms Portal page with a new Forms Start page on Office.com (Office.com > Forms).
MC237369 – (Updated) Announcing general availability of Microsoft 365 data classification analytics (GCC-H & DoD)
Microsoft 365 Roadmap ID 70666
Updated April 06, 2021: We have updated the rollout timeline below. Thank you for your patience.
New data classification analytics capabilities will soon be available within your Microsoft 365 compliance center experience in two new service plans, Information Protection and Governance Analytics – Premium and Information Protection and Governance Analytics – Standard.
Key points:
· Timing:
o New service plans: late April (previously mid-March)
o Feature available: from mid April through early May
· Roll-out: tenant level
· Control type: admin UI
· Action: review and assess
How this will affect your organization?
Data classification capabilities in Microsoft 365 compliance center help you get a holistic understanding of the sensitive data in your digital estate and related user activities.
· Activity Explorer shows activities related to your sensitive data and labels, such as label downgrades or external sharing that could expose your content to risk.
· Content Explorer provides visibility into amount and types of sensitive data, and allows you to filter by label or sensitivity type to get a detailed view of locations where the sensitive data is stored.
· Overview shows you the locations of your digital content and most common sensitive information types and labels present.
MC236653 – (Updated) Microsoft Teams for GCC-High
This message is associated with Microsoft 365 Roadmap ID 70664
Updated March 31, 2021: Recording Microsoft Teams meetings is now live for GCC-High and DoD! Admins must enable this feature for their organization to start allowing users to record meetings.
Note: For DoD customers, please be aware of one known issue that prevents PowerPoint slides from being recorded when a presentation is uploaded to use PowerPoint Live, preventing the slides from being shown in the final meeting recording. As a workaround, meeting presenters can instead use screen or window sharing (rather than uploading their PowerPoint deck) to ensure that slides are shown in the recording. We are resolving this issue and will update the MCP when the fix is complete.
You will soon be able to record meetings on Microsoft Teams across Desktop/Mobile/Web. Teams meeting recordings will be stored on, and served from, OneDrive and SharePoint (ODSP).
When this will happen?
This feature will begin rolling out on March 1, 2021 and will be complete by March 31, 2021
How this will affect your organization?
This advancement benefits your organization in multiple ways including:
New recording feature:
· Users may record their Teams meetings and group calls to capture audio, video, and screen sharing activity. The recording happens in the cloud and is saved to OneDrive and SharePoint, so users can share it securely across their organization.
Secure meeting storage:
· Non-channel meetings: stored in the OneDrive of the person who clicked the record button and located in a new folder labeled Recordings.
· Channel meetings: are stored in the Teams site documentation library in a folder labeled Recordings.
Advanced sharing permissions:
· Non-channel meetings: all meeting invitees, except for external users, automatically get a shared link to access the meeting recording.
· The meeting organizer or the person that clicked the record button will need to explicitly add external users to the share.
· Channel meetings: permissions will be inherited from the owner and member list in the channel.
Coming future enhancements:
· Ability to block download of the video by meeting participants
· Ability to view and edit the transcript in the player
· Non-English language captions
· Variable playback speed in video player
· Transcript timeframe search (e.g., to find a specific point in time when something was discussed)
What you need to do to prepare?
Starting in March 2021, you may use the Microsoft Teams admin center or PowerShell to set a Teams meeting policy to control whether user’s meetings can be recorded.
This feature is turned off by default and must be explicitly turned on by the admin.
· See our detailed instructions for turning on or turning off cloud recording.
· Additional information
MC235288 – (Updated) SharePoint spaces to be available by default in New menu
Microsoft 365 Roadmap ID 67135
Updated April 09, 2021: We have updated the rollout timeline below. Thank you for your patience.
SharePoint spaces allows the creation and sharing of immersive or browser-based mixed reality environments using assets such as 3D models, 360° images and videos, and 2D content such as videos, images, and office documents. In October 2020 (MC224942), SharePoint spaces became generally available.
We are now including spaces in the site level +New menu by default.
Key points:
· Timing:
o Targeted Release (organization): early February 2021
o Standard Release: mid-February through early June (previously mid-April)
· Roll-out: tenant level
· Control type: admin control
· Action: review and assess by 6/01/2021
How this will affect your organization?
Users with appropriate permissions to create content on a site will see an additional entry for creating a Space in the +New menu on all SharePoint sites.

As with pages, SharePoint site owners will continue to have the option to turn off the spaces feature for their sites using the Manage Site Features page or using PowerShell cmdlets described below.
What you need to do to prepare?
You should determine whether you want to maintain the current behavior (where site owners must enable SharePoint spaces at the site level before it will show in the +New menu) or have spaces show in the +New menu by default across your tenant.
· If you want to show the Space menu item on the +New menu by default across your tenant, you don’t need to do anything except notify site owners and authors of this change. You may also want to train users or provide them with documentation as well as notify your help desk.
· If you don’t want the Space menu item to show in the +New menu across your tenant by default, you’ll need to enable the tenant-level control by executing the following PowerShell command:
Set-SPODisableSpacesActivation -scope tenant -Disable $true
· You can reverse this action and re-enable the spaces entry in the +New menu by executing:
Set-SPODisableSpacesActivation -scope tenant -Disable $false
In addition to the tenant level control, you can also use PowerShell to enable or disable the spaces entry in the +New menu for individual sites.
· To disable the space entry in the +New menu on a specific site, use the following PowerShell command:
Set-SPODisableSpacesActivation -scope site -Disable $true -Identity $siteURL
· Reverse this action and re-enable the spaces entry in the +New menu on a site by executing:
Set-SPODisableSpacesActivation -scope site -Disable $false -Identity $siteURL
For both site-level commands, the variable $siteURL contains the URL to the specific SharePoint site where you want to enable or disable the +New menu entry.
MC235180 – (Updated) Teams desktop app for Mac: Include computer sound in a meeting
This message is associated with Microsoft 365 Roadmap ID 67168 and 67169.
Updated April 29, 2021: We have updated the rollout timeline below. Thank you for your patience.
The Microsoft Teams desktop app for MacOS will soon allow users include their computer’s sound when sharing either their desktop or a window in a meeting.
When this will happen?
· Rollout for production and GCC tenants begins in mid-May (previously early April) and should be complete in mid-June (previously late April).
· Rollout for GCC-High and DoD tenants begins in mid-June (previously late April) and should be complete by mid-July (previously early May).
How this will affect your organization?
With this update, Mac users can share audio from their speakers with other meeting participants, such as when they share a video with sound as part of a collective viewing experience.
This feature will be available to all Mac users in your tenant unless you have set the ScreenSharingMode policy to None.
This feature requires a one-time installation of an audio driver. Users will be prompted to install the audio driver when they select Include computer sound from the Share content tray in a meeting. Once installed, users can freely toggle the functionality on or off before or after they start sharing a desktop or window.
MC235111 – (Updated) Microsoft Teams Revised In-Meeting Share Experience – GCC
Microsoft 365 Roadmap ID 70560
Updated April 27, 2021: We have updated the rollout timeline below. Thank you for your patience.
Microsoft Teams desktop users on Windows and Mac will soon have a revised share experience while in meetings.
Key points:
· Timing: early May (previously end of April) through mid-May (previously end of April)
· Roll-out: tenant level
· Control type: user control
· Action: review and assess
MC233466 – (Updated) New Teams meeting lobby settings – only invited users join directly – GCC
Microsoft 365 Roadmap ID 68730
Updated March 30, 2021: We have updated the rollout timeline below. Thank you for your patience.
Teams meeting organizers can have greater control over their meetings by enabling a new lobby setting where only Calendar meeting invited users will be able to join directly.
When this will happen?
· For Production and GCC environments: roll out will start at the end of April (previously end of March) and will be complete by mid-May (previously mid-April).
MC231108 – (Updated) Add a shared calendar to a Teams channel
Microsoft 365 Roadmap IDs 68910 and 68911
Updated April 27, 2021: We have updated the rollout timeline below. Thank you for your patience.
With this feature, users can add the Channel calendar app to a Teams channel when using the Teams desktop app.
When this will happen?
· Production tenants: rollout from mid-January through the end of January 2021 – Complete
· Government tenants:
o GCC-High: from early February through the end of February
o DoD: from mid-May (previously end of February) to late May (previously March)
How this will affect your organization?
This feature makes it easy for members to see scheduled channel meetings.
· Select new tab+ at the top of the channel
· Find and add Channel calendar from available apps
Teams automatically creates a new post when a channel meeting is created. It will appear in the activity feed and/or in a banner notification depending on users notification settings. Any user who has notifications turned off will see the event only when they open the channel calendar.
Note: the channel calendar is available only to team members. Guest users cannot access the channel calendar app.
MC231223 – (Updated) New meeting options for managing large Teams meetings in Outlook for Windows – GCC
Microsoft 365 Roadmap ID 78699
Updated April 01, 2021: We have updated the rollout timeline below. Thank you for your patience.
When organizing Teams meetings in Outlook for Windows for 40 or more participants or 10 or more distribution lists, Teams users will soon see a prompt to set meeting options.
Key points:
· Timing: early June (previously mid-April) through the end of June (previously mid-May)
· Roll-out: tenant level
· Control type: user control
· Action: review and assess
MC230680 – (Updated) Meeting Reactions in Teams Meetings
Microsoft 365 Roadmap IDs 65946 and 68905
Updated April 29, 2021: We have updated the rollout timeline below. Thank you for your patience.
The Meeting Reactions feature allows users to react to participants during a meeting. Reactions will be available on Teams Desktop and Teams Mobile apps.
When this will happen?
· Production and GCC environments: will start rolling out in early February (previously late January) and will be complete by mid-February (previously early February). Complete
· GCC-High tenants: start rolling out end of May (previously mid-April) and will be complete by the mid-June (previously end of April)
· DOD tenants: start rolling out in Q3 calendar year 2021 (we will provide an additional update in the future).
How this will affect your organization?
In a Teams meeting, participants can choose from four different reaction types – like, heart, applause, and laugh – and send it to meeting attendees from the new reactions and raise hand flyout in the control bar.
Meeting participants will see the reaction displayed over their position.
When content is shared, the reactions will float over the content. This applies to Desktop, Window, PowerPoint, and Whiteboard sharing.
What you need to do to prepare?
Meeting reactions will be on by default and you should consider how to deploy in your tenant.
You can change whether users have reactions on or off by default by using the AllowMeetingReactions policy. If you turn reactions off by default for users, they can still enable reactions in their meetings if they are the meeting organizer from the meeting option page.
You might want to notify your users about this new capability and update your training and documentation as appropriate.
Support for meetings on web, room systems, or surface hub will follow later in the year.
Learn more: Set-CsTeamsMeetingPolicy
MC230505 – (Updated) Block Download Permissions for Teams Meeting Recordings on OneDrive – GCC
Microsoft 365 Roadmap ID 70543
Updated April 29, 2021: We have updated the rollout timeline below. Thank you for your patience.
As part of the New Stream experience, new Teams meeting recordings will be stored in your OneDrive for Business and SharePoint. Based on customer feedback we are enhancing the feature so that these recordings are not downloadable by those with view-only permissions, and that those permissions be set by default.
The New Stream experience was originally communicated in MC222640 (Standard) and MC229363 (GCC) also see this documentation for more details on the timing and experience.
Key Points:
· The rollout of this change will begin in mid-May (previously early April) and it expect to complete in early June (previously end April).
· Action: Review and assess impact on your organization.
How this will affect your organization?
When this change is implemented:
1. All new Teams meeting recordings uploaded to OneDrive and SharePoint will get the same permissions as outlined here, except that everyone who would normally receive view-only permissions will now also be blocked from being able to download the recording by default for non-channel meetings (i.e. the ones going to the recorder’s OneDrive). We will update that documentation to reflect the added block download restrictions once the feature is deployed. This change that will block downloadability of Teams meeting recordings will apply only to non-Channel meetings (aka “adhoc” meetings). Meeting recordings from meetings hosted in a Teams channel are uploaded to the doclib on the SharePoint team site backing that Teams channel. As such, it inherits the permissions from that team site to maintain its collaborative nature. It is recommended that you do not use Channel meetings for sensitive topics where you do not want members to have full access. A separate post and roadmap item will be created for the channel meeting recording solution in the future.
2. Any time the recording is shared with someone else, block download permissions will continue to be set by default. Only the recording edit owners will have the ability to explicitly override that setting and re-share with download permissions if they choose to do so. That will be an explicit action, so the owners will not be at risk of accidentally oversharing.
The enhanced security and privacy permissions setting will happen by default and cannot be overridden.
Note: This only applies new recordings created after you are enrolled in the new OneDrive and SharePoint experience.
MC229945 – (Updated) Introducing an enhanced Teams Calling experience – GCC
Microsoft 365 Roadmap ID 68771
Updated April 27, 2021: We have updated the rollout timeline below. Thank you for your patience.
We are simplifying the calling experience in the Teams desktop app (Windows and Mac) by providing a streamlined view that combines contacts, voicemail, and calling history.
Key points:
· Timing: early May (previously April) through the end of May (previously April)
· Roll-out: user level roll-out v tenant level
· Action: review and assess
How this will affect your organization?
When your users update the Teams desktop app, they will see the new calling experience. A streamlined view shows contacts, voicemail, and calling history at once, making it easier to initiate or return a call with a single click.
Additional enhancements that are coming to Teams Calling:
· CarPlay support for Teams Calling
· Teams Admins can take advantage of the Teams and OneDrive or SharePoint integration and make OneDrive or SharePoint the default calls recording storage location, in lieu of Stream.
· Teams will identify potential spam calls and digitally attest to outgoing calls to prevent them from being rejected by external recipients.
What you need to do to prepare?
You might want to notify your users about this new capability and update your training and documentation as appropriate.
Learn more: Restore and maintain personal connections with new Microsoft Teams Calling features
MC228897 – (Updated) Text formatting (bold, italic, underline) available in Microsoft Forms
Microsoft 365 Roadmap ID 68894
Updated April 21, 2021: We have updated the rollout timeline below. Thank you for your patience.
Forms users and educators can make more professional looking surveys and quizzes with highlighted and emphasized information inline. Now you’ll be able to bold, italicize, underline, add bullets or numbering and even change the font size, font color when designing your forms and quizzes.
When this will happen?
We will begin rolling out in late April (previously late February) and expect to be complete in late May (previously March).
MC226990 – (Updated) Improving the Message center user experience
Microsoft 365 Roadmap ID 67102
Updated March 31, 2021: We have completed the roll out for Worldwide tenants and expect to complete rolling out for Governments tenants by mid April. Thank you for your patience.
Note: The Category column can be enabled in the view by selecting it from the Choose columns drop down.
We are making it easier to discover relevant Message center posts and are providing an improved Message center reading experience.
When this will happen?
We will begin rolling out this feature in mid-December 2020 and expect the rollout to be complete in mid-April.
How this will affect your organization?
Message center will have improved search and filtering functionality. The list view will also be more customizable and interactive, and the message detail panel provides an enhanced reading experience.
Here are the detailed changes you can expect in this new experience:
· Favorite messages to make them easier to find
· In-line filtering control
· New column in the Message center list highlights the services related to a post
· Next and Back arrows in the message detail panel provide improved navigability
· Pivots will be consolidated to Inbox and Archive
· Sort by Act by date, Favorite, Last updated, Message ID, and Message title
MC223082 – (Updated) Microsoft To Do web app available for GCC
Microsoft 365 Roadmap ID 67144
Updated April 12, 2021: We have made the decision to make additional changes before we proceed with the rollout. We will deliver a new Message center post once we re-start the rollout. Thank you for your patience.
The Microsoft To Do web app will soon be available for GCC customers.
Key points:
· Timing: We will communicate via Message center when we are ready to proceed.
· Roll-out: tenant level
· Action: review and assess
MC222745 – (Updated) Introducing live transcription in Microsoft Teams meeting – GCC
Microsoft 365 Roadmap ID 82836
Updated April 27, 2021: We have updated the rollout timeline below. Thank you for your patience.
Live transcripts in Microsoft Teams meetings will provide another way to both follow and review meeting conversations. Note: Live transcription currently supports only spoken English (English-US).
When this will happen?
We will begin rolling this out in early May (previously early March) and expect the rollout to be complete at the end of May (previously end of March).
MC222156 – (Updated) Introducing macOS native notifications in Teams
Microsoft 365 Roadmap ID 66743
Updated April 21, 2021: Based on learning’s from our early rings, we have made the decision to make additional changes before we proceed with the rollout. We will deliver a new Message center post once we are ready to proceed with the rollout. Thank you for your patience.
With this update, your users will be able to choose their preferred means of Teams notifications delivery, either via the Teams built-in notification system or via their native OS notification system.
When this will happen?
· MacOS 10.14 and greater native notifications: mid-April (previously late March) through end of April (previously mid-April)
Microsoft 365 IP and URL Endpoint Updates
|
Documentation – Office 365 IP Address and URL web service
29 April 2021 – GCC
28 January 2021 – GCC High
29 April 2021 – DOD


.gif")


.png")


.png")


 Briefing.png")


Recent Comments