by Contributed | May 27, 2021 | Technology
This article is contributed. See the original author and article here.
This month, we’re releasing new productivity and security capabilities. You can view the complete list of What’s New in the 2105 (May) release for details. Below you’ll find more about my favorite features shipped this month. As usual, I appreciate your feedback. Comment on this post, connect with me on LinkedIn, or tag me @RamyaChitrakar on Twitter.
Protecting data on different device types with filters
Filters let you maximize your current asset investments while protecting data on personal, company-owned, and shared devices. You can use filters to target policy and apps based on specific device attributes. The applications are endless. Out of many customer use cases, these three consistently guide our filters development:
- You want to apply a consistent compliance policy setting the minimum OS version on all enrolled Android devices but omit Microsoft Teams Android devices from this policy. Now, you can simply apply one compliance policy across your entire portfolio and filter out the device type where it doesn’t make business sense to apply the policy.
- Part of your device environment includes iPadOS devices that run a business-critical app certified by a regulatory agency for use with specific OS versions. Your iPadOS devices cannot update their OS until the app is certified for use with the latest OS. You also have bring your own device (BYOD) iOS devices, which meet your minimum OS policy but can update any time your user wants to take advantage of the latest features and security updates. You can now create one policy for updating all iOS devices but filter specific iPadOS devices from the policy. That way your BYOD devices stay current and your iPadOS devices remain under your update control.
- Your device portfolio includes Autopilot-enrolled Windows 10 devices, BYOD Windows 10 devices, and Windows Virtual Desktops, which several of your developers have for testing. You have an app purchased for business use but due to licensing restrictions, you don’t want BYOD Windows devices or Windows 10 virtual devices to use the app licenses. You can now make the app available on all Windows 10 devices in your portfolio but omit BYOD and virtual OSs.
Check out this post for more details on filters and look for additional device attributes and capabilities in the future. Watch this video to see filters in action:
Several customers have asked how to best approach filters. We recommend that you:
- Assess all the assignments in your organization. Many customers have a mix of corporate and personal devices.
- Review each app assignment and policy.
- Evaluate if these assignments and policies are correctly scoped or if there’s a device filter that you can apply to better meet the app or policy needs.
- Determine if one filter can be used in multiple scenarios as a reusable entity – this simplifies the management and application of filters.
- Test and apply filters.
I am incredibly proud of the engineering work done to build the filters capability. Our rules engine performance for filter evaluation is world class – our scale testing found filter evaluations for 350K device check-ins took less than 1 second! The feature works in conjunction with Azure Active Directory groups and complements your identity management group options to ensure you have flexibility for your business needs.
Supporting Windows 10 Enterprise multi-session (public preview)
You’ve likely used Windows Virtual Desktop – it delivers a Windows 10 desktop experience on any device, anywhere, integrated with Microsoft 365 security features and often at a reduced cost as you can use existing licenses to save cost with a modern-cloud-based virtual desktop infrastructure and pay only for what you use. This preview will enable your frontline workforce to share the same enterprise multi-session virtual machine! You can quickly and easily enroll, provision, and manage the virtual machine with a new, simplified policy authoring experience targeted to shared Windows multi-session devices.
See your organization’s multi-session virtual machines in the Microsoft Endpoint Manager admin center:
Customizing and managing policies more easily
The settings catalog makes it easier to customize, set, and manage device and user policy settings. Many customers have shared that managing policy configuration through custom Open Mobile Alliance Uniform Resource Identifier (OMA-URI) policy is cumbersome, difficult to report on, and often unsupportable. Our 2105 service release supports your move from Group Policy Objects (GPO) or custom OMA-URI to cloud-based consolidated policies. We’ve added 5,000 settings to the settings catalog for Edge, Office, and OneDrive, including additional settings for macOS and Windows!
With settings catalog, we aim to close the gap on available configuration service providers (CSP) settings in Windows, standardize policy settings across the console (such as with a “not configured” policy option), and simplify the policy creation workflow. Try these new settings in a few ways:
- Start from an empty policy and simply select what you want from a library of available settings.
- Use one of several pre-created templates that will provide the security, user experience, and productivity settings most used by customers.
- Compare what you’ve set as your baseline with what’s configurable in the cloud through CSPs. This is a good option if you still have a number of GPO settings. Last month, we released a Group Policy analytics preview tool that makes it possible to compare your GPO settings with Mobile Device Management policy CSPs.
- Review your custom OMA-URI policies and compare them to the options in the settings catalog. Reporting and conflict resolution greatly improve when you move off custom OMA-URI policies.
- Add policies we’ve introduced this month into your existing already configured baselines.
Explore more detailed information on the settings catalog or watch a short demonstration of a few of the new settings:
We keep our customers’ needs top of mind. This month, we introduced several capabilities to improve your daily life. We listen to your feedback and make changes and investments aimed at improving the user experience as well as simplifying IT administration. Questions? Feedback? Comment on this post, connect with me on LinkedIn, or tag me @RamyaChitrakar on Twitter.
by Contributed | May 27, 2021 | Technology
This article is contributed. See the original author and article here.
Once again, the Microsoft CSM (Customer Success Manager) team representing State & Local Government customers has produced a new 4-week series on the topic of Meetings in Microsoft Teams.
The recordings can now be found online in a new YouTube playlist here, which complements our previous series.
Customers are getting great value from having these series done on a regular basis. Not only does it help to reinforce key meeting best practices, but it’s also important given the constant flow of innovation and features that roll out to Microsoft Teams every month. This series is also timely as we near the full deprecation of Skype for Business Online (SfBO), and many customers are working to make sure their users have a smooth transition from their use of SfBO meetings to now Teams meetings.
Here’s a description of the sessions you’ll find:
- Before the Meeting
- Introduction to Teams – Why Teams Meetings?
- Ways to Access Teams; Choosing How to Meet
- Setting Meeting Expectations – Roles and Access
- Meeting Extensibility
- During the Meeting
- Meetings Features (Part 1 and Part 2)
- Sharing Assets During a Meeting
- After the Meeting
- Sharing Outcomes of the Meeting
- Post-meeting Collaboration & Learning Resources
- Use Cases for the Teams Mobile App
- Best Practices
- Accessibility in Teams
- Troubleshooting Common Teams Meetings Issues
- Teams Meetings GCC Roadmap
- Advantages of Teams as a Platform
Related Teams for Government articles: Notifs in GCC | Custom Apps in GCC | Gamification of Teams

by Contributed | May 27, 2021 | Dynamics 365, Microsoft 365, Technology
This article is contributed. See the original author and article here.
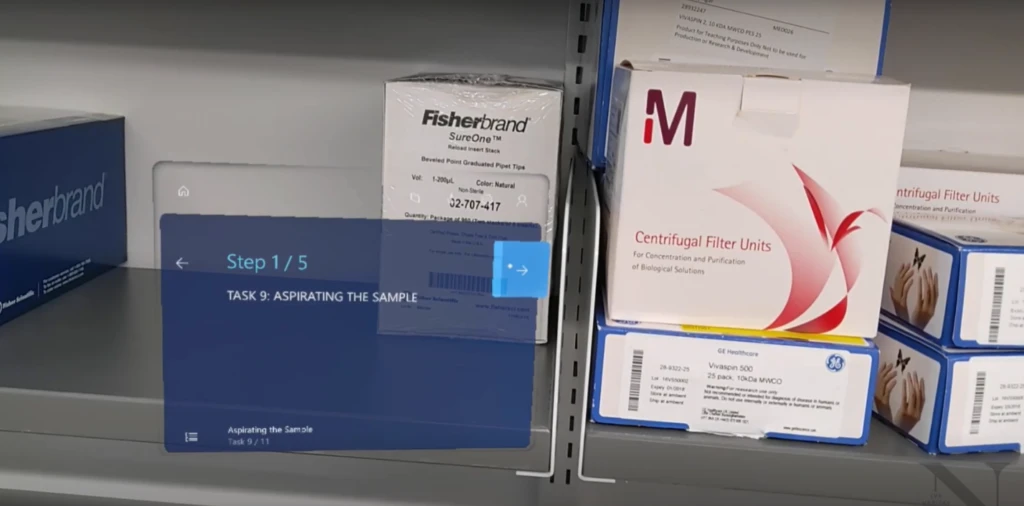
“What kind of cool opportunities are there in the research and education space and how can we leverage that technology?” These were the types of questions that educators at Northeastern University asked themselves when looking for solutions to provide unique, immersive experiences for their students. Education and experiential learning have seen incredible value in the development of virtual reality, augmented reality, and mixed reality technology and content, according to Statista.1 Traditional, more passive learning methods are failing to meet the needs of modern education, and institutions like Northeastern University are rapidly exploring and adopting more innovative and impactful solutions.
Students need a tactile, active, and hands-on experience that helps them retain information longer and apply acquired knowledge in real-world situations, even while learning. Microsoft Dynamics 365 Guides and HoloLens 2 give professors and leaders in learning and development a game-changing approach to experiential and hands-on learning.
Move from traditional to experiential learning
The biotech department at Northeastern University knew it needed to expand its traditional learning model to provide students with more experiential learning opportunities. They discovered Microsoft’s mixed reality solutions and immediately saw the value of applying this technology to lectures, classroom training, and research.
The value of mixed reality became even more clear after the COVID-19 pandemic shutdown university facilities and sent students home. Northeastern University started using mixed reality as part of their pandemic response, working to ensure students didn’t miss out on their education even while at home. Using Dynamics 365 Guides and HoloLens 2 the students at Northeastern University received an immersive learning experience despite the challenges of the coronavirus lockdown.
“The HoloLens really emphasized the power of visual learning in a specific space, but not actually having to be there.”Jared Auclair PhD, Director of Executive Training and Biotechnology Programs, Northeastern University

Reduce training time with Dynamics 365 Guides
Before Northeastern University introduced mixed reality to the training process, it took three hours for Dr. Auclair to teach a relatively simple technique inside the lab. Working closely with his students, Dr. Auclair often spent time in person to help them get it right. Now, using Dynamics 365 Guides, Northeastern University has cut training time by 83 percent. Students can now acquire the technique required in no more than 30 minutes and discovered a new-found independence.
“We can get them into HoloLens 2, and they can go through a program by themselves being guided by the guides. It’s a beauty of it that I don’t have to be there. And then, we can bring them in the lab and ensure they’ve been trained properlyI think Dynamics 365 Guides has the potential to be a game-changer in the training realm of biotech.”Jared Auclair PhD, Director of Executive Training and Biotechnology Programs, Northeastern University
Empower students to do more with mixed reality
In addition to reducing training time, mixed reality has freed up critical time for specialists who no longer need to be present during in-classroom training. They can spend this extra time giving feedback and preparing the student for more complex techniques. At Northeastern University, students using mixed reality can quickly apply their skills in the real world and appreciate the independence and flexibility this learning method provides, particularly during such an uncertain time.
“We’re excited about exploring the new possibilities of using this kind of technology for experiential learning in whatever kind of setting, given that this technology is now more widely available.”Nick Wilson, Associate Director, Center for Advancing Teaching and Learning Through Research, Northeastern University
Get started with Dynamics 365 Guides
1-“XR/AR/VR/MR technology investment directions worldwide 2016-2019″, Lionel Sujay Vailshery, March 16, 2021, Statista.
The post Northeastern University uses Dynamics 365 Guides mixed reality to deliver experiential learning appeared first on Microsoft Dynamics 365 Blog.
Brought to you by Dr. Ware, Microsoft Office 365 Silver Partner, Charleston SC.

by Contributed | May 27, 2021 | Dynamics 365, Microsoft 365, Technology
This article is contributed. See the original author and article here.
We have made the decision not to invest in transitioning the Russian payroll capabilities in Dynamics AX 2012 R3 over to Dynamics 365.
However, we’ll continue to support existing Russian payroll capabilities for organizations on an Enhancement Plan during the mainstream support and extended support through October 12, 2021 and January 10, 2023, respectively. For more information about Dynamics AX 2012 R3 lifecycle, read this article.
Although we do not recommend it, organizations can continue using Russian payroll capabilities with the knowledge that all regulatory updates and non-security hotfixes for Dynamics AX 2012 R3 will end on October 12, 2021, and security hotfixes will end on January 10, 2023.
Here are answers to some common questions for organizations impacted by this decision.
Why is support of Dynamics AX 2012 R3 Russian payroll capabilities not being continued in future releases?
Payroll is not included in the global strategic focus of the Dynamics 365 portfolio. Partners and ISVs are best positioned to provide payroll functionality that is compliant with local regulations and tax updates.
What Russian payroll solution is recommended when I move to Dynamics 365 Finance?
We recommend that organizations work with their implementation partner to determine the best local payroll solution based on their specific needs.
Does being active on a support or service plan ensure continued support for the Dynamics AX 2012 R3 solution?
Yes. Organizations active on an Enhancement Plan will receive mainstream support and extended support. The mainstream support for Dynamics AX 2012 R3 ends on October 12, 2021. Extended support for Dynamics AX 2012 R3 ends on January 10, 2023. For more information about Dynamics AX 2012 R3 lifecycle, read this article.
Can I continue to use the Russian payroll capabilities included in Dynamics AX 2012 R3?
Yes, but regulatory updates and non-security hotfixes for the Russian Payroll feature for Dynamics AX 2012 R3 will be discontinued on October 12, 2021.
Is support for Dynamics AX 2012 R3 Russian payroll capabilities being retired?
No. Dynamics AX 2021 R3 is included in mainstream support until October 12, 2021, which means Microsoft provides security hotfixes, non-security hotfixes, and regulatory updates. After the end of mainstream support, it will be included in extended support from October 13, 2021 to January 10, 2023. Microsoft will continue to provide security hotfixes only. There won’t be additional support for non-security hotfixes nor will there be regulatory updates. Dynamics AX 2012 R3 will be out-of-support starting on January 11, 2023. For more information about Dynamics AX 2012 R3 lifecycle, read this article.
Will the Russian payroll capabilities of Dynamics AX 2012 R3 be available in Dynamics 365 on-premises deployments?
Russian payroll capabilities of Dynamics AX 2012 R3 won’t be available in Dynamics 365 as a cloud service or for on-premises deployment. We suggest you work with your implementation partner to determine the best option for you.
What if I want to continue to use the Russian payroll capabilities after the end of the mainstream support for Dynamics AX 2012 R3?
Organizations using Russian payroll capabilities in AX 2012 R3 are welcome to use it after it is discontinued. However, we do not recommend doing this, as payroll regulations are continuously changing, and the existing product will not be compliant.
Will out-of-the-box integration be provided with any payroll solution for Russia, similar to integration with some US solutions, such as Ceridian or ADP?
Microsoft works with ISVs on enabling seamless integration with payroll providers for different geographies. Monitor Microsoft AppSource and other communication channels for alternative solutions.
Next steps
We recommend that you contact your implementation partner to determine the best payroll solution to meet your needs and build a plan to migrate to a new solution.
Send email to RUPayrollInquiry@microsoft.com with any questions about these changes. Find more information about the Russian payroll capabilities in the documentation.
The post Update for our customers using Russian payroll capabilities of Dynamics AX 2012 R3 appeared first on Microsoft Dynamics 365 Blog.
Brought to you by Dr. Ware, Microsoft Office 365 Silver Partner, Charleston SC.
by Contributed | May 27, 2021 | Technology
This article is contributed. See the original author and article here.
We are happy to announce that Office Scripts in Excel for the web is now generally available for all eligible users!
What is Office Scripts?
Office Scripts is an automation feature-set in Excel for the web that allows users with all levels of programming experience to automate their repetitive workflows.
“Office Scripts not only enabled the workbook to be located in the cloud, it also replaced all the pre-existing manual updating and maintenance process. It became 100% fully autonomous!” – Leslie Black, Developer, Analysis Cloud Limited.
|
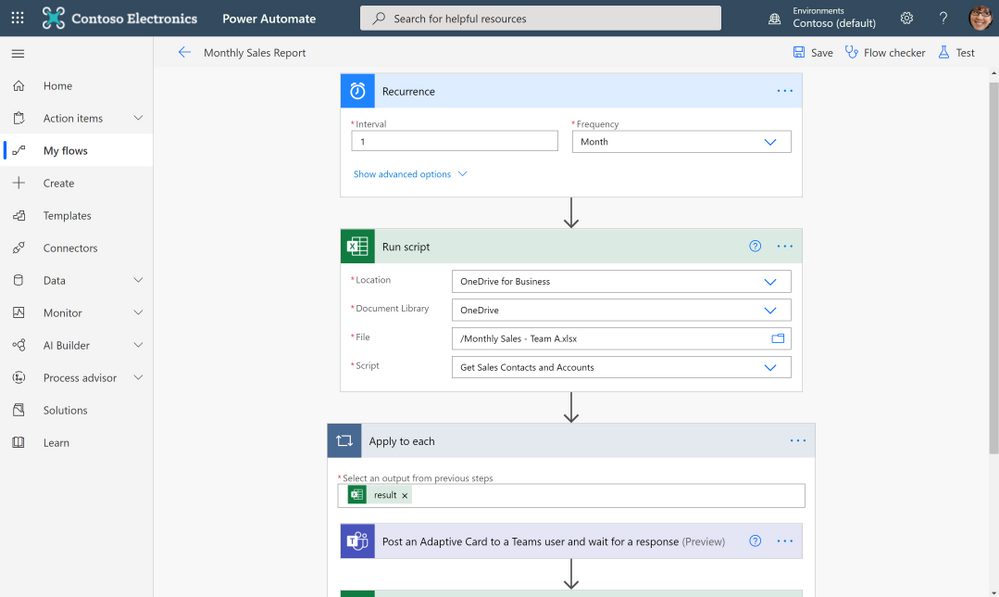
To get started, use the Action Recorder to record the actions you take in Excel. These actions are then translated into a script that you can run at any time. No programming experience required! Need to modify your scripts? Use the Code Editor! It’s a TypeScript-based editor directly within Excel for the web. Use it to edit your existing scripts or to create new ones using the Office Scripts API.
https://www.microsoft.com/en-us/videoplayer/embed/RWEBYs
Want to run a script on a schedule? Use Power Automate and create a Flow to schedule your Office Script to run at a certain time. Or maybe you want to trigger a script to run based on the creation of a new file in a SharePoint site? Power Automate also allows you to trigger scripts based on events from other applications and services to create cross-application workflows.
“Since creating the solution and publicizing it internally, I have been asked and have implemented it for another two areas in our Intranet, so they also have an automated process. In total, it saves us around six hours effort per month and consequently we have many colleagues (IT and non-IT) starting to use Office Script to help make their work lives easier.” – Gareth Naylor, Group Wide Architect/Strategist, Uniper
|
What licenses include Office Scripts?
Office Scripts is currently available for all users that have a commercial or EDU license that gives access to the Microsoft 365 office desktop apps (e.g., Office 365 E3 and E5 licenses). If you have an eligible license, you’ll find the Office Scripts feature-set in the Automate tab in the ribbon. Please note that if you do not have the Automate tab in Excel for the web, your admin may have disabled the feature.
Learn More
Get started scripting with our numerous sample scripts based on real-world scenarios. These samples cover a wide variety of automated solutions from the fundamentals of the Office Scripts API to how to create cross-workbook and cross-application automated workflows with Power Automate.
You can also learn more about Office Scripts from these resources:
Learn from the Office Scripts community:
Next steps
Please reach out to us as you try out the Office Scripts feature! Your input is critical to make Office Scripts better.
- Ask questions on Microsoft Q&A under the ‘office-scripts-dev’ tag if you get stuck or have questions about how to automate a workflow.
- Have feedback on Office Scripts? Send us a smile or a frown. You can also send us feedback by selecting the Send Feedback button located in the overflow menu of the Code Editor.
by Scott Muniz | May 27, 2021 | Security, Technology
This article is contributed. See the original author and article here.
Drupal has released security updates to address a vulnerability affecting Drupal 8.9, 9.0, and 9.1. An attacker could exploit this vulnerability to take control of an affected system.
CISA encourages users and administrators to review Drupal Advisory SA-CORE-2021-003 and apply the necessary updates or mitigations.
by Contributed | May 26, 2021 | Technology
This article is contributed. See the original author and article here.
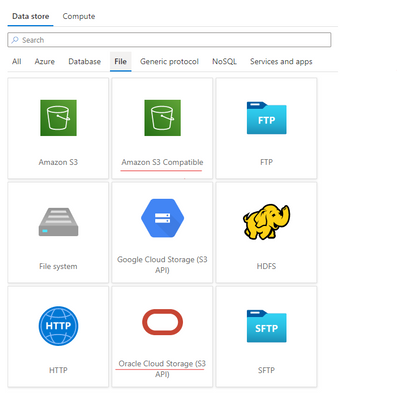
Azure Data Factory is continuously enriching the connectivity to enable you to easily integrate with diverse data stores. We recently released two new connectors: Oracle Cloud Storage; Amazon S3 Compatible Storage, with which you can seamlessly copy files as is or parsing files with the supported file formats and compression codecs from Oracle Cloud Storage or Amazon S3 Compatible Storage for downstream analysis and consumption. Both of the connectors are supported in copy activity as source. You can now find the Oracle Cloud Storage connector and Amazon S3 Compatible Storage connector from ADF connector gallery as below.
Learn more from ADF Oracle Cloud Storage connector and Amazon S3 Compatible Storage documentation. For a full list of data stores that are supported in ADF, see this connector overview article.
by Contributed | May 26, 2021 | Technology
This article is contributed. See the original author and article here.
SQL Server does not sniff for variable, it just simply uses the fixed value.
I’m going to use AdventureWorks 2019 in this post.
——————–Please run this script—————
use AdventureWorks2019
go
IF exists(select 1 from sys.tables where name=’SalesOrderDetail’ and schema_id=schema_id(‘dbo’))
drop table SalesOrderDetail
go
select * into SalesOrderDetail from [Sales].[SalesOrderDetail]
go
create statistics iProductID ON SalesOrderDetail(productid) with fullscan
go
dbcc traceon(3604,2363)—trace flag 2363 displays more detail about the selectivity
go
——————–Please run this script—————
Equality(=): all density
DECLARE @pid INT = 0
SELECT * FROM SalesOrderDetail WHERE ProductID = @pid
456=‘All density’*card=0.003759399*121317

DBCC execution completed. If DBCC printed error messages, contact your system administrator.
———————————-trace flag 2363 output———————————-
Begin selectivity computation
Input tree:
LogOp_Select
CStCollBaseTable(ID=1, CARD=121317 TBL: Sales.SalesOrderDetail)
ScaOp_Comp x_cmpEq
ScaOp_Identifier QCOL: [AdventureWorks2019].[Sales].[SalesOrderDetail].ProductID
ScaOp_Identifier COL: @pid
Plan for computation:
CSelCalcHistogramComparison(POINT PREDICATE)
Loaded histogram for column QCOL: [AdventureWorks2019].[Sales].[SalesOrderDetail].ProductID from stats with id 3
Selectivity: 0.0037594
Stats collection generated:
CStCollFilter(ID=2, CARD=456.079)
CStCollBaseTable(ID=1, CARD=121317 TBL: Sales.SalesOrderDetail)
End selectivity computation
———————————-trace flag 2363 output———————————-
Non-Equality(<>): 0.9
DECLARE @pid INT = 0
SELECT * FROM SalesOrderDetail WHERE ProductID <> @pid

121317*0.9=109185.3, is rounded down to 109185
———————————-trace flag 2363 output———————————-
Begin selectivity computation
Input tree:
LogOp_Select
CStCollBaseTable(ID=1, CARD=121317 TBL: SalesOrderDetail)
ScaOp_Comp x_cmpNe
ScaOp_Identifier QCOL: [AdventureWorks2019].[dbo].[SalesOrderDetail].ProductI
ScaOp_Identifier COL: @productid
Plan for computation:
CSelCalcFixedFilter (0.9)
Selectivity: 0.9
Stats collection generated:
CStCollFilter(ID=2, CARD=109185)
CStCollBaseTable(ID=1, CARD=121317 TBL: SalesOrderDetail)
End selectivity computation
———————————-trace flag 2363 output———————————-
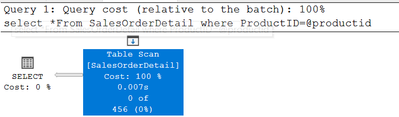
Inequality(>,>=,<,<=):0.3
declare @productid int=0
select *From SalesOrderDetail where ProductID>@productid

121317*0.3=36395.1, is around down to 36395
Please try >=,< and <=, they all use the same selectivity.
———————————-trace flag 2363 output———————————-
Begin selectivity computation
Input tree:
LogOp_Select
CStCollBaseTable(ID=1, CARD=121317 TBL: SalesOrderDetail)
ScaOp_Comp x_cmpGt
ScaOp_Identifier QCOL: [AdventureWorks2019].[dbo].[SalesOrderDetail].ProductID
ScaOp_Identifier COL: @productid
Plan for computation:
CSelCalcFixedFilter (0.3)
Selectivity: 0.3
Stats collection generated:
CStCollFilter(ID=2, CARD=36395.1)
CStCollBaseTable(ID=1, CARD=121317 TBL: SalesOrderDetail)
End selectivity computation
———————————-trace flag 2363 output———————————-


.png")


 CMMS-EAM Mobility Suite.png")


.png")


Recent Comments