by Scott Muniz | Jul 7, 2021 | Security, Technology
This article is contributed. See the original author and article here.
CISA continues to respond to the recent supply-chain ransomware attack leveraging a vulnerability in Kaseya VSA software against multiple managed service providers (MSPs) and their customers. Kaseya has released guidance specifically for customers returning to their VSA software-as-a-service (SaaS) instance after the Kaseya SaaS servers are brought back online. Note: See Kaseya’s Security Notice for the status of their SaaS servers being brought back online.
CISA strongly recommends SaaS Kaseya customers read and implement the Kaseya’s VSA SaaS Best Practices published in Kaseya’s Security Notice before returning to their Kaseya VSA SaaS instance. These mitigations include:
- Review system configurations to confirm administrative user accounts leverage multi-factor authentication (MFA). Note: Kaseya enables MFA by default.
- Implement:
- The principle of least privilege on key network resources admin accounts. Restrict VSA SaaS instances to authorized users based on the principal of least privilege.
- Network segmentation between the SaaS and on-premises environments.
- Allowlisting to limit communication with remote monitoring and management (RMM) capabilities to known IP address pairs, and/or place administrative interfaces of RMM behind a virtual private network (VPN) or a firewall on a dedicated administrative network.
- Configure logging to ensure that all Kaseya SaaS product audit logs—including System logs and Remote Control/Live ConnectVSA logs— and associated network logs are captured and stored —for at least 180 days—in a separate, centralized log aggregation capability.
For additional information about this incident, see the White House statement and the joint CISA-FBI guidance.

by Scott Muniz | Jul 7, 2021 | Security, Technology
This article is contributed. See the original author and article here.
Official websites use .gov
A .gov website belongs to an official government organization in the United States.

Secure .gov websites use HTTPS A
lock ( )
) or
https:// means you’ve safely connected to the .gov website. Share sensitive information only on official, secure websites.
by Contributed | Jul 7, 2021 | Technology
This article is contributed. See the original author and article here.
Azure Arc and the Azure control plane enables Cloud Solutions Architects to build hybrid and mutlicloud architectures. Taking advantage of the Azure control plane to manage infrastructure and allows to deploy Azure services anywhere. This allows customers to build cloud solutions and applications architectures consistently, independent of where the application is running.
Azure Arc Overview
In this blog post, we will have a look at Azure Arc for Cloud Solutions Architects. Azure Arc allows you to extend Azure management and Azure services to anywhere. Meaning that you can deploy, manage and govern resources running across hybrid and multi cloud environments, and bring services such as Azure SQL Database and Azure PostgreSQL Hyperscale to your on-premise datacenter, edge location, or other cloud providers. Since Azure Arc can help in many different scenarios.
Azure Arc
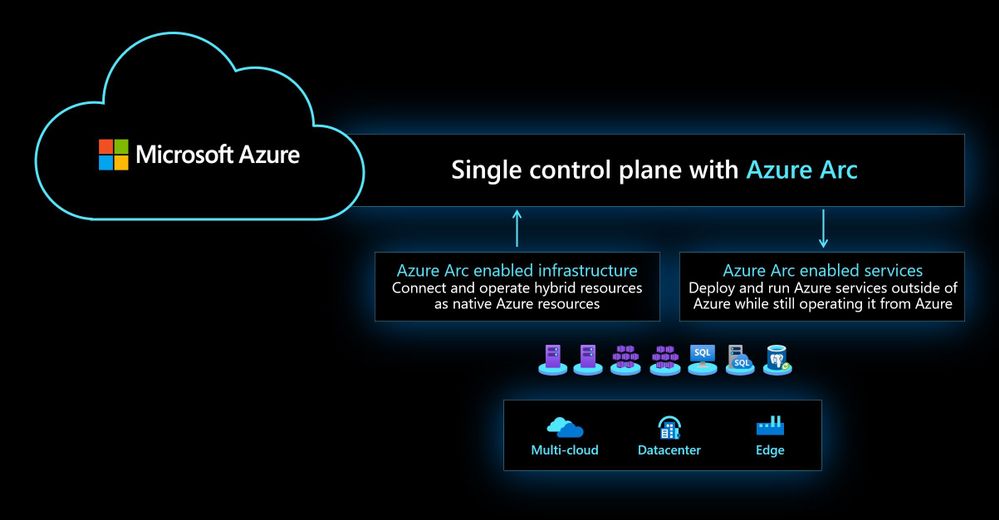
Azure Arc simplifies governance and management by delivering a consistent multi-cloud and on-premises management platform. Azure Arc enables you to manage your entire environment, with a single pane of glass, by projecting your existing resources into Azure Resource Manager. You can now manage virtual machines, Kubernetes clusters, and databases as if they are running in Azure. Regardless of where they live, you can use familiar Azure services and management capabilities. Azure Arc enables you to continue using traditional ITOps, while introducing DevOps practices to support new cloud-native patterns in your environment.
 Azure Arc Architecture Single Control Plane
This provides you with a single control plane for your hybrid and multicloud environment.
Azure Arc for Cloud Solutions Architects
Let’s have a look at some key Azure Arc scenarios for Cloud Solutions Architects.
Use the Azure Portal to gain central visibility
In hybrid and multicloud environments, it can be difficult for Cloud Solutions Architects to get a central view of all the resources they need to manage. Some of these resources are running in Azure, some on-premises, branch offices, or even at other cloud providers. By connecting resources to the Azure Resource Manager using Azure Arc, Security Engineers can get central visibility of a wide range of resources, including Windows and Linux servers, SQL server, Kubernetes clusters, and Azure services running in Azure and outside of Azure.
 Azure Arc and Azure resources in the Azure Portal
Organization and Inventory
The single control plane using Azure Resource Manager lets you organize and inventory assets through various Azure scopes, such as management groups, subscriptions, resource groups, and tags.
 Azure Arc Tagging
Azure Resource Graph
Establish central visibility in the Azure portal and enable multi-environment search with Azure Resource Graph. This allows you to run queries against the Azure resource graph and provide a centralized view of all your resources running in Azure and outside of Azure.
Manage Access
As a Cloud Solutions Architect, you want to make sure that only people who need access can access these systems. You can delegate access and manage security policies for resources using role-based access control (RBAC) in Azure. With Azure Arc enabled servers, we are seeing customers removing the local access for administrators and only provide them access to the system in the Azure portal using Azure Arc and Azure Management services. If you run in multiple environments and tenants, Azure Arc also integrated perfectly in Azure Lighthouse. Azure Lighthouse is especially interesting for managed services providers.
 Role-based Access Control
Enable your custom deployment locations
Azure Arc enables you to create custom locations, so you can use the Azure Resource Manager not just to deploy to Azure Regions but also to your own custom locations. You can learn more about custom locations on Microsoft Docs.
 Azure Regions and custom locations
Run cloud-native apps on Azure PaaS anywhere
Azure Arc allows you to deploy Azure application services such as Azure App Service, Functions, Logic Apps, Event Grid, and API Management anywhere, on-premises, edge locations, or any other cloud provider. This is great if you are building and running cloud-native applications on Azure PaaS services and want them to run outside of Azure without rearchitecting them.
These are the new Azure Arc-enabled Application services announced at Microsoft Build 2021. These allow you to run Azure PaaS services on-premises and at other cloud providers.
- Azure App Service makes building and managing web applications and APIs easy with a fully managed platform and features like autoscaling, deployment slots, and integrated web authentication.
- Azure Functions makes event-driven programming simple, with state-of-the-art autoscaling, and triggers and bindings to integrate with other Azure services.
- Azure Logic Apps produces automated workflows for integrating apps, data, services, and backend systems with a library of more than 400 connectors.
- Azure Event Grid simplifies event-based applications with a single service for managing the routing of events from any source to any destination.
- Azure API Management provides a unified management experience and full observability across all internal and external APIs.
 Create App Service and select a custom location
Azure Arc enabled Data Services
Next to Azure Application services to run services like Web Apps and Logic Apps, you also want to leverage data services and databases. With Azure Arc enabled Data services you can run services like Azure SQL Managed Instances anywhere.
The applications services can be combined with the Azure Arc enabled Data services which include:
- Azure Arc enabled Azure SQL Managed Instance – Azure Arc enabled SQL Managed Instance has near 100% compatibility with the latest SQL Server database engine, and enables existing SQL Server customers to lift and shift their applications to Azure Arc data services with minimal application and database changes while maintaining data sovereignty. At the same time, SQL Managed Instance includes built-in management capabilities that drastically reduce management overhead.
- Azure Arc enabled Azure PostgreSQL Hyperscale – This is the hyperscale form factor of the Postgres database engine that is available with Azure Arc enabled data services. It is also powered by the Citus extension that enables the hyperscale experience. In this form factor, our customers provide the infrastructure that hosts the systems and operate them.
 Azure Arc enabled data services
CI/CD workflow using GitOps – Azure Arc enabled Kubernetes
Azure Arc brings DevOps practices anywhere. Modern Kubernetes deployments house multiple applications, clusters, and environments. With GitOps, you can manage these complex setups more easily, tracking the desired state of the Kubernetes environments declaratively with Git. Using common Git tooling to track cluster state, you can increase accountability, facilitate fault investigation, and enable automation to manage environments.
 Azure Arc enabled Kubernetes GitOps Flow
Deploy and run Azure Kubernetes Services (AKS) on-premises on Azure Stack HCI
With Azure Arc and Azure Stack HCI, you can run the Azure Kubernetes Services (AKS) on-premises in your own datacenter or edge location on top of Azure Stack HCI. This AKS cluster can be Azure Arc enabled, to allow management and deployment of applications to your Kubernetes clusters. You can learn more on Microsoft Docs.
Run Machine Learning anywhere
Azure Arc enabled machine learning lets you configure and use an Azure Arc enabled Kubernetes clusters to train and manage machine learning models in Azure Machine Learning.
Azure Arc enabled machine learning supports the following training scenarios:
- Train models with 2.0 CLI
- Distributed training
- Hyperparameter sweeping
- Train models with Azure Machine Learning Python SDK
- Build and use machine learning pipelines
- Train model on-premise with outbound proxy server
- Train model on-premise with NFS datastore
Learn more on Microsoft Docs.
Update Management
As a Cloud Solutions Architect, one of your jobs is to make sure that all the systems have the latest updates and patches installed to protect against vulnerabilities. Often customers spend hours orchestrating or deploying patched or building automation for their patch management. With Update Management, you can manage operating system updates for your Windows and Linux servers. In addition, it allows you to schedule and automates patching for your servers.
 Update Management
Monitoring
You do not just want to manage your systems; you also want to monitor them and make sure that you get alerted in case anything is happening which you disrupted your environment and applications. You can monitor your Kubernetes clusters and containers, Linux, and Windows Servers. Azure Monitor provides you with monitoring guest operating system performance and discover application components to monitor their processes and dependencies with other resources the application communicates using VM insights.
 Monitoring
One of the great features in Azure Monitor which can help Cloud Solutions Architects is the Microsoft Dependency agent. This provides you with information about the incoming and outgoing connections to a specific server.
 Azure Monitor Map
Log collection and analytics
Log collection and analytics can be very helpful to a Cloud Solutions Architect in many ways. With Azure Log Analytics you can collect, sort, filter, and analyze your logs centrally. It allows Security Engineers to get a central view of all the security logs of the systems they manage. These logs can also be used for thread hunting using Azure Sentinel.
Microsoft Azure Sentinel is a scalable, cloud-native, security information event management (SIEM) and security orchestration automated response (SOAR) solution. Azure Sentinel delivers intelligent security analytics and threat intelligence across the enterprise, providing a single solution for alert detection, threat visibility, proactive hunting, and threat response.
Change Tracking and Inventory
With change tracking and inventory, you can get an overview of the changes happening in your environment and get an inventory of software installed on your Windows and Linux servers.
 Change Tracking and Inventory
Certificate Management
You might have managed certificates on your servers using Active Directory and Group Policies for your local environment. In hybrid cloud or mutlicloud environments, servers are often not even domain joined. That can make managing certificates a challenge. With a combination of the Azure AD Managed Identity assigned by the Azure Arc agent and Azure Key Vault you can easily and securely deploy and manage certificates to your Windows and Linux servers.
Security Center
Making sure that your servers and Kubernetes clusters are secured is often a challenging task, especially in a hybrid or multicloud environment. With Azure Security Center you get threat detection and proactively monitor for potential security threats for your Azure Arc resources. It allows you to deploy Azure Defender for servers and Azure Defender for Kubernetes to your hybrid and multicloud resources.
 Security Center
Get compliance state
As a Cloud Solutions Architect, you want to know if your servers or Kubernetes clusters are compliant with the company policies. Or you are even in charge to make sure that all your systems are configured correctly and secure. This is where Azure Policy Guest Configuration on your Azure Arc enabled servers can help you to make sure that everything is compliant.
 Azure Policy
Manage your Azure Stack HCI
Azure Stack HCI is a new hyperconverged infrastructure (HCI) operating system delivered as an Azure service that provides the latest security, performance, and feature updates. Azure Stack HCI has Azure Arc build-in and can be managed through the Azure Portal.
 Azure Stack HCI Native Integration in to Microsoft Azure
Next steps
Learn more about Arc enabled servers, see the following overview
Learn more about Arc enabled Kubernetes, see the following overview
Learn more about Arc enabled data services, see the following overview
Experience Arc enabled services from the Jumpstart proof of concept
Also, check out my video on how to manage your hybrid cloud using Azure Arc on Microsoft Channel 9.
https://channel9.msdn.com/Shows/IT-Ops-Talk/Manage-your-hybrid-cloud-environment-using-Azure-Arc/player?WT.mc_id=modinfra-23500-thmaure
Conclusion
Azure Arc enables Cloud Solutions Architects and others to build hybrid and multicloud solutions and with the right tooling to manage and operate hybrid and multicloud resources such as Windows and Linux servers, Kubernetes clusters, and other resources. If you have any questions, feel free to leave a comment below.
by Contributed | Jul 7, 2021 | Technology
This article is contributed. See the original author and article here.
The COVID-19 pandemic has led to unprecedented measures and is also changing the way we work. In addition to restricting travel and canceling large events, a growing number of companies are encouraging to work remotely. In order to continue working efficiently and creating value under these new circumstances, organizations need to adopt different applications with different scenarios, e.g., web conference, remote collaboration, etc. The real-time whiteboard is one of the tools to help you build remote collaboration and bring your teams together, anytime, anywhere, e.g., running productive and engaging online meetings and workshops, building and developing ideas with distributed teams, explaining complex process and system with visual map or diagram, etc. The Azure Web PubSub (AWPS) which is a fully managed service could help you build the real-time whiteboard application. Let’s learn how to build a whiteboard demo together.
What’s the whiteboard demo?
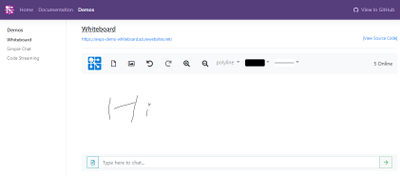
This whiteboard demo demonstrates how to build a web application for real time collaboration using Azure and other related technologies. The fundamental feature of this application is allowing anyone painting on it and synchronizing the paint to others in real-time. The user could paint with the basic paint tool, touching on mobile devices or uploading images.
Before we start digging into details, you can first play with this demo online. Open this site and input your username, then draw anything you like in the whiteboard. Open another browser window you’ll see your changes are synchronized in real-time.
You can also find the source code of this demo here.
Synchronize real-time data between client applications
One of the key features in this whiteboard is its ability to synchronize the drawing between multiple client apps in real-time. This is implemented by using WebSocket technology, which is commonly used in web applications for bidirectional communication. If you’re already familiar with WebSocket and look into the implementation in server.js, you’ll notice it’s very different than a typical WebSocket server. In a typical WebSocket application, server needs to manage all client connections and handle data transfer between clients. So you can imagine in a whiteboard app, server will receive the drawing from one client and broadcast it to all other clients, which will generate huge traffic when everyone is drawing and processing all those data will be a big burden to the server.
If you look at our whiteboard server, you’ll see it’s a standard express.js server application (we don’t go through details about how to use express.js here, you can refer to its official docs to learn more). Instead of having code to handle WebSocket connections, it creates a WebPubSubEventHandler and use it as a middleware in the express app.
let handler = new WebPubSubEventHandler(hubName, ['*'], {
  path: '/eventhandler',
  handleConnect: ...
  onConnected: ...
  onDisconnected: ...
  handleUserEvent: ...
});
app.use(handler.getMiddleware());
By using this Web PubSub event handler, we’re leveraging Azure Web PubSub service to manage the client connections for us.
In the event handler there’re some callbacks like onConnected and onDisconnected, which are similar to open and close events in WebSocket, but the key difference here is when using Azure Web PubSub service, the connection is connected to the service, your server just gets a notification when this happens but does not need to manage the lifetime of the connection. This is usually challenging in real scenarios where you need to handle things like connection routing and load balancing. In Azure Web PubSub they’re all taken care of by the service.
Also in the server code you’ll notice there is no code to pass the data from one client to another, this is purely done at client side. Look at the client you’ll see code like this:
this._webSocket.send(JSON.stringify({
  type: 'sendToGroup',
  group: group,
  dataType: 'json',
  data: data
}));
This code sends a message to the WebSocket connection but there is no code at server side to handle it! This is because it is processed at service side. Azure Web PubSub can understand message from client (in this case it’s asking service to send this message to a group) and send the message to the corresponding clients (which is called publish/subscribe pattern). So you can see by using Azure Web PubSub you can save a lot of server resources (like CPU and network bandwidth) by offloading WebSocket connections to the service.
Maintain state at server side
Even Azure Web PubSub helps us deliver real-time updates between clients, client still needs to send drawing data to server so it can be saved at server side. So next time when a new user opens the whiteboard, they can see all paintings others draw before.
This is done by sending an event from client to server. Event is another communication pattern (comparing to publish/subscribe pattern we use for sending real-time updates) in Azure Web PubSub for clients to send data to server.
In client, there is code like this:
this._webSocket.send(JSON.stringify({
  type: 'event',
  event: 'message',
  dataType: 'json',
  data: data
}));
This code sends an event to server and there is corresponding server code to handle it:
let handler = new WebPubSubEventHandler(hubName, ['*'], {
  path: '/eventhandler',
  ...
  handleUserEvent: async (req, res) => {
    let message = req.data;
    switch (message.name) {
      case 'addShape': ...
      case 'removeShape': ...
      case 'clear': ...
    }
    res.success();
  }
});
You can see the code above handles three types of events (when user adds a new shape, removes an existing shape or clears the whiteboard) and save the data to a local diagram object (for demo purpose, in a real application you should use a persistent storage to store this diagram).
You can see there is still data communication between client and server, but comparing to the real-time updates between clients (which happens whenever a user moves their mouse on the screen), this only happens when a user finishes drawing a shape, so the amount of data is much less than the real-time updates.
Besides user events, Azure Web PubSub also supports some system events like connected and disconnected so server can know the status of client connections. You can see in the server code, they’re used to track the total number of clients online.
Use WebSocket API in client
Azure Web PubSub uses WebSocket API for its client programming interface. As long as your programming language supports WebSocket, you don’t need to install any third-party library. You already see how to send messages through WebSocket in previous sections, but there are a few more things you need to be aware before using it.
Authenticate with service
Azure Web PubSub doesn’t support anonymous connection, so in order to connect to the service each client needs to authenticate with it using a JWT token. Azure Web PubSub SDK already provides an API to generate the token from connection string. A recommended implementation is to expose a Web API (usually called negotiate) at server to return this token (the API itself can be protected by your own authentication mechanism). In the demo app it’s implemented like this:
app.get('/negotiate', async (req, res) => {
  let token = await serviceClient.getAuthenticationToken({
    roles: ['webpubsub.sendToGroup.draw']
  });
  res.json({
    url: token.url
  });
})
In the negotiate you can also control the permission of client (like which group it can send message to).
Create connection
Create connection is really simple but you need to specify a subprotocol if you want to directly send messages between clients.
let res = await fetch('/negotiate');
let url = res.json().url;
let ws = new WebSocket(url, 'json.webpubsub.azure.v1');
With json.webpubsub.azure.v1 subprotocol, you’ll be able to join, leave and publish messages from client (more details can be found here).
If you don’t specify subprotocol you can still connect, but all messages you send will be treated as events and be sent to server.
Handle reconnect
It’s very common that WebSocket connection will drop due to things like network glitches, long time inactivity at client side, etc. So to improve the stability of the client app you should always consider reconnect when it disconnects.
In Javascript if a WebSocket connection is closed you need to create a new WebSocket object to reconnect, which means for all callbacks you registered on the old object you need to re-register in the new one. In this demo we created a simple WebSocketClient class to wrap the raw WebSocket object so it will automatically reconnect and re-register all callbacks. Check out the source code to see how it works.
Next Steps
Now, we already go through the key points to build the real-time whiteboard application with Azure Web PubSub service. If you are looking for more details about this demo, you can refer to the whiteboard application on Github where the code is hosted, along with information and docs on how to deploy and run it yourself.
If you are trying to build your first real-time application with Azure Web PubSub, you could also get more helpful resources from the getting stared contents. We are looking forward your feedback and ideas to help us become better via Azure Feedback Forum!
by Contributed | Jul 7, 2021 | Technology
This article is contributed. See the original author and article here.
py-spy is a sampling profiler for Python programs. It lets you visualize what your Python program is spending time on without restarting the program or modifying the code in any way. py-spy is extremely low overhead: it is written in Rust for speed and doesn’t run in the same process as the profiled Python program. This means py-spy is safe to use against production Python code.
py-spy works on Linux, OSX, Windows and FreeBSD, and supports profiling all recent versions of the CPython interpreter (versions 2.3-2.7 and 3.3-3.9).
This article shows a demonstration of how to use py-spy to run sampling profiler for your Python application running in Linux App Service.
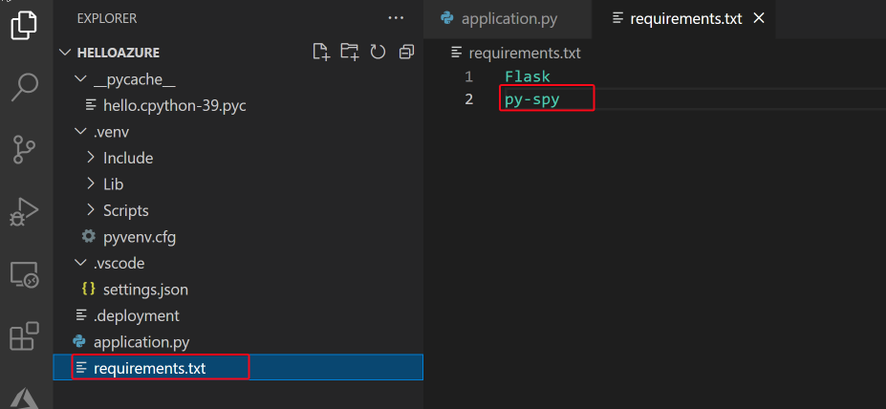
Step 1: Install py-spy for your Python application
In your Python application project, find your requirements.txt file. Add “py-spy” in the file.
This is the only change we need to make. No other code changes are required.
Step 2: Deploy your application to Azure Web App.
When deploying the code, Azure orxy build will help us install the py-spy package.

Step 3: Run live performance monitor for your application
Py-spy allow us attach to a running Python process, and monitor its performance.
The tool is similar to the Unix top command, it shows a live view of what functions are taking the most time in your python program, . Running py-spy with:
- Login to your Linux App Service WEBSSH, https://<webapp-name>.scm.azurewbsites.net/
- First use “ps aux | grep python” command to find your python process ID.

- Run “py-spy top –pid <python process id>”

Here is my sample Python code. When I access http://<webapp-name>.azurewebsites.net/test2, I can see a lot cpu time consumed by my runjob2() function.
import time
from flask import Flask
app = Flask(__name__)
@app.route("/")
def hello():
runjob()
return "Hello Azure, from Flask!"
@app.route("/test1")
def test1():
return "Hello Test1!"
@app.route("/test2")
def test2():
runjob2()
return "Hello Test2!"
def runjob():
counter = []
for i in range(0,5):
test()
counter.append(i)
print (counter)
def runjob2():
for i in range(0,10):
i = i+1
time.sleep(1)
def test():
print(">>>>>start test")
time.sleep(1)
print("<<<<<<<done")
Step 3: Use record command to record profiles to a flame graph file
by Contributed | Jul 7, 2021 | Technology
This article is contributed. See the original author and article here.
Hello readers,
Today I am back with another post to discuss one of the common needs that customers have: retrieving data in a given business interval. The interval could one or more days, one or more hours as well as the combination of both. Let’s see how to do it.
As first step let’s identify the scenario in which this filter can be of help. Say that the IT department must only take care of data (and notification) which are inside the following interval:
- Monday to Friday.
- 9 a.m. to 6 p.m.
According to above scenario, the IT department needs to retrieve the events occurred during the last 60 days according to the business interval defined above.
Now that we know the scenario and the business interval, what else do we need? Of course, an existing workspace containing data, then the knowledge of the data we will going to query, a lookup table and, finally, the query we use to retrieve data.
As far as the lookup table goes, we will create it inside the query. It will be a simple step. In the Azure portal, got to the relevant workspace, open the query page and paste the code below:
// Defining business day display names and business hours lookup table
let businessInterval = datatable(dayOfWeekTimespan:int, dayOfWeekDayDisplayName:string, firstH:int, lastH:int)
[
0, "Sunday", 9, 18,
1, "Monday", 9, 18,
2, "Tuesday", 9, 18,
3, "Wednesday", 9, 18,
4, "Thursday", 9, 18,
5, "Friday", 9, 18,
6, "Saturday", 9, 18
];
The code above defines a multidimensional array, containing 7 rows, with the following schema that will be used as dimension table:
- dayOfWeekTimespan:int à the timespan value used to convert the result of dayofweek function. This function will return the integer number of days since the preceding Sunday, as a timespan.
- dayOfWeekDayDisplayName:string à the display name to convert the timespan value to.
- firstH:int à the lower boundary of the business hours.
- lastH:int à the upper boundary of the business hours.
Given the schema, you can also define different business hour interval on different days.
NOTE: The lookup table does not honor the various locales. For non-English representation, feel free to change the value in the dayOfWeekDayDisplayName column accordingly. Same concept applies to the TimeGenerated which needs to be adapted using the relevant time zone. Records in Log Analytics are stored only in UTC. You can convert the time during the presentation in the portal or from within the query.
Moving on with the query, let me first explain why I called the multidimensional array “Lookpup table”. The reason is inside the query code. It will use, in fact, the lookup operator. In short, the lookup operator performs an operation similar to the join operator with the following differences:
- The result does not repeat columns from the $right table that are the basis for the join operation.
- Only two kinds of lookup are supported, leftouter and inner, with leftouter being the default.
- In terms of performance, the system by default assumes that the $left table is the larger (facts) table, and the $right table is the smaller (dimensions) table. This is exactly opposite to the assumption used by the join operator.
- The lookup operator automatically broadcasts the $right table to the $left table (essentially, behaves as if hint.broadcast was specified). Note that this limits the size of the $right table.
With the lookup operator clear in mind, let’s assemble the query considering the following:
- Customer needs to query the last 30 days of data.
- Customer is interested on data occurred inside the business interval.
Right after the lookup table code, we will define 2 variables to set the Time Range interval according to the 60 days requirement expressed by the customer. Paste the following after the last line of the table code:
// Defining timerange interval
let startDate = ago(60d);
let endDate = now();
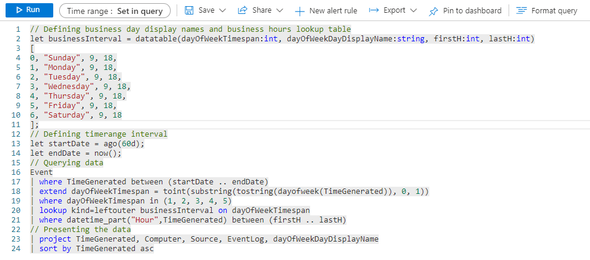
Now, let’s go ahead querying and presenting the data using the lookup table for the defined time range interval. The remaining part of your query, which you can write right after the time range interval lines above, could be similar to the sample one reported below:
// Querying data
Event
| where TimeGenerated between (startDate .. endDate)
| extend dayOfWeekTimespan = toint(substring(tostring(dayofweek(TimeGenerated)), 0, 1))
| where dayOfWeekTimespan in (1, 2, 3, 4, 5)
| lookup kind=leftouter businessInterval on dayOfWeekTimespan
| where datetime_part("Hour",TimeGenerated) between (firstH .. lastH)
// Presenting the data
| project TimeGenerated, Computer, Source, EventLog, dayOfWeekDayDisplayName
| sort by TimeGenerated asc
The complete code will look as follow:
The results will be shown according to the project operator:

As you can understand from the query code, the relevant part for the filtering concept is represented by the lookup table and by the lines from 18 to 21 in the screenshot:

You can use this approach in your workbook, in your alerts and in all your queries. Of course, the charts will show some blank or missing values, but this is in line with the filter.
Hope that this is going to help taking care of or analyzing the data only during the desired business interval.
Thanks for reading 
Disclaimer
The sample scripts are not supported under any Microsoft standard support program or service. The sample scripts are provided AS IS without warranty of any kind. Microsoft further disclaims all implied warranties including, without limitation, any implied warranties of merchantability or of fitness for a particular purpose. The entire risk arising out of the use or performance of the sample scripts and documentation remains with you. In no event shall Microsoft, its authors, or anyone else involved in the creation, production, or delivery of the scripts be liable for any damages whatsoever (including, without limitation, damages for loss of business profits, business interruption, loss of business information, or other pecuniary loss) arising out of the use of or inability to use the sample scripts or documentation, even if Microsoft has been advised of the possibility of such damages.
by Scott Muniz | Jul 6, 2021 | Security, Technology
This article is contributed. See the original author and article here.
Microsoft has released out-of-band security updates to address a remote code execution (RCE) vulnerability—known as PrintNightmare (CVE-2021-34527)—in the Windows Print spooler service. According to the CERT Coordination Center (CERT/CC), “The Microsoft Windows Print Spooler service fails to restrict access to functionality that allows users to add printers and related drivers, which can allow a remote authenticated attacker to execute arbitrary code with SYSTEM privileges on a vulnerable system.”
The updates are cumulative and contain all previous fixes as well as protections for CVE-2021-1675. The updates do not include Windows 10 version 1607, Windows Server 2012, or Windows Server 2016—Microsoft states updates for these versions are forthcoming. Note: According to CERT/CC, “the Microsoft update for CVE-2021-34527 only appears to address the Remote Code Execution (RCE via SMB and RPC) variants of the PrintNightmare, and not the Local Privilege Escalation (LPE) variant.” See CERT/CC Vulnerability Note VU #383432 for workarounds for the LPE variant.
CISA encourages users and administrators to review the Microsoft Security Updates as well as CERT/CC Vulnerability Note VU #383432 and apply the necessary updates or workarounds. For additional background, see CISA’s initial Current Activity on PrintNightmare.
by Contributed | Jul 6, 2021 | Technology
This article is contributed. See the original author and article here.
Everyone loves a good home lab setup. The cloud is great, but buying and installing hardware in the comfort of your own home is something one can get addicted to :)
Don’t get me wrong – there are things I put straight into the cloud without even considering self-hosting. Even though I have been an Exchange Admin in a previous life I use Office 365, and I certainly trust OneDrive and Azure File Storage more than the maintenance of my own RAID/NAS. But running 30 virtual machines ain’t free and even if there is a cost to buying hardware it might come up cheaper over time.
The challenge is that these days you want things to be as cloud native as they can. So, you don’t want to install virtual machines where you install a web server that you subsequently have to configure. And even though you can install Docker on both Windows and Linux servers you want something more sophisticated than individual containers.
You want something like Kubernetes with all the fixings. No, Kubernetes is not the perfect option that you always want to use, but it’s certainly something you should have hands-on experience with these days. (I’m approaching this lab from the developer perspective. Running VMs has been a solved problem for years.) Sure, there’s options like Service Fabric as well since we’re dealing with the Microsoft tech stack, but I’m not diving into that right now.
If you set up an Ubuntu VM you can get going with Microk8s in minutes, but why stop there?
Microsoft announced Azure Stack HCI AKS a few months back, and it just went GA. (That’s hyper-converged servers that can plug into Azure and then you optionally put Azure Kubernetes Service on top.)
More info:
https://docs.microsoft.com/en-us/azure-stack/aks-hci/
I felt that not all my questions were easily answered in the docs. Do you need two nodes? What does it cost? How much hardware at a minimum?
Well, it’s not like the docs are bad, but they do kind of drive you towards a more enterprisey setup. The bigger problem is that all the info you need is spread across a number of sections in the docs and that’s why I wanted a more complete set of instructions (while not diving into all the technical details). So, inspired by what I could find on docs.microsoft.com and http://aka.ms/azurearcjumpstart as well as an amount of testing and validation on my own I put together a little guide for building this at home.
If you want a “proper” cluster you need at least two nodes (with the witness going in the cloud) , and you’ll want 2 NVMe drives + 8 SSDs for Storage Spaces Direct. (Well, you probably want all NVMe if money is no concern.) You’ll probably want minimum 64 gigs of RAM in each box as well.
Azure Stack HCI doesn’t have an up-front cost, but it will set you back 10$ a month pr core at the current pricing. So, it adds up if you’re on a budget. And that does not include the licenses for any Windows VMs you run on the cluster. You can trial it for free for 60 days so there’s no risk testing it though. It works nicely, but at the moment I don’t feel it’s quite worth it now as many of the features are still “Coming Soon”. Since there are new versions in preview this might change in the future, so this is not a permanent evaluation on my part.
Wait a moment, I first said “Azure Stack HCI AKS” and then “Azure Stack HCI” without the AKS term. Was that a spelling error? No. The AKS part is an additional installation after you get the HCI part working. (Which means that HCI doesn’t mean you must run Kubernetes. You can still do VMs in parallell.) Azure Stack HCI is an operating system you install yourself so you can install software on top of that. It shares a lot of the code base with Windows Server, but with some tweaks to become a cloud-connected evergreen OS.
You can however skip the cluster part and go single node, and for the sake of it I tested the latest build of Windows Server 2022 Preview instead of this purpose-built OS. This works like a charm.
For hardware I went with an HPE Microserver Gen 10 Plus with 32GB RAM and even if I stuffed in two SSDs I tested on a single HDD just to be sure. Storage Spaces and/or RAID is a recommendation, but not a hard prerequisite. (I can confirm the Microserver unofficially supports 64GB RAM as well, but it’s slightly expensive and tricky to chase down known good RAM sticks.) You can certainly make it work on different bits of hardware too – a configuration like this doesn’t have to break your bank account in any way. (I like the size of the Microserver as well as iLO, built in quad port NIC even if it is just gigabit, etc.)
Righty, I managed to install an operating system – now what? If you want a UI for management you’re driven towards Windows Admin Center (WAC) in general these days:
https://docs.microsoft.com/en-us/windows-server/manage/windows-admin-center/overview
Azure Stack HCI has the Server Core UI whereas with Windows Server 2022 you can still go full desktop mode.
Note: This isn’t an intro to Kubernetes as such; it’s about getting a specific wrapping of Kubernetes going. If you’re a k8s veteran there are parts you can skim through, and if you’re new to container orchestration you might want to research things in other places as well along the way. I try to hit a middle ground here.
There’s an AKS plugin for WAC that in theory will let you set it up through a wizard. I’m saying “theory” because I’m seeing inconsistency – sometimes I get an unhelpful CredSSP or WinRM error thrown in the face, and sometimes it works. And I’m not liking that. However, it is a great way to install the Powershell cmdlets and have a quick look if things in general are ok. (Screenshot from a two-node setup.)
 Windows Admin Center AKS Prereqs
There’s a quick start for using the Windows Admin Center (WAC) to set things up here:
https://docs.microsoft.com/en-us/azure-stack/aks-hci/setup
And for PowerShell here (you can install everything without involving WAC):
https://docs.microsoft.com/en-us/azure-stack/aks-hci/kubernetes-walkthrough-powershell
Step 2 & 3 (in PowerShell) is where things can get a little confusing. I did not feel the parameters where sufficiently explained. An example of what I basically went with follows. (I have a slightly different IP addressing scheme, but same same in the bigger picture).
Assuming you have a 192.168.0.0/24 subnet, and have already created a virtual switch on the server named “LAN”. Let’s say you use 192.168.0.2 – 192.168.0.99 (default gateway on .1) as your DHCP scope you’ll want to carve out a static space separately for AKS.
You will want a range for the nodes, and you will want a range for any load balancers you provision in the cluster. (Adjust to account for your specifics.)
$vnet = New-AksHciNetworkSetting -name aksvnet -vSwitchName "LAN" -macPoolName aksMacPool -k8sNodeIpPoolStart "192.168.0.101" -k8sNodeIpPoolEnd "192.168.0.110" -vipPoolStart "192.168.0.111" -vipPoolEnd "192.168.0.120" -ipAddressPrefix "192.168.0.0/24" -gateway "192.168.0.1" -dnsServers "192.168.0.1"

Set-AksHciConfig -vnet $vnet -imageDir C:ClusterStorageVolume01Images -cloudConfigLocation C:ClusterStorageVolume01Config -cloudservicecidr "192.168.0.100/24"

Set-AksHciRegistration -subscriptionId "guid" -resourceGroupName "rg-AKS"

Install-AksHci -Verbose
It might take a little while to provision, but with a bit of luck it will go through. Don’t worry about the Azure registration – this does not incur a cost, but is used for Azure Arc. (Azure Arc is a service for managing on-prem services from Azure and is not specific to AKS.)
After installation of the host cluster you might want to run the Update-AksHci cmdlet in case you didn’t get the newest release on the first go. (I have experienced this.)
This takes care of setting up the AKS host, but not the actual nodes for running workloads so you will want to create that next. I went with Linux nodes, but you can create Windows nodes as well if you like. This actually mirrors AKS hosted in Azure, but things have been abstracted away slightly there so you might not think much about this. (Which is OK.)
If you have a 32GB RAM server the New-AksHciCluster cmdlet without parameters will probably fail since you don’t have enough memory. And when scaling things down you’ll also want to account for upgrades – when upgrading the cluster a new instance of each virtual machine is spun up in parallel requiring you to have enough headroom for this. This should work:
New-AksHciCluster -Name aks01 -loadBalancerVmSize "Standard_A2_v2" -controlplaneVmSize "Standard_A2_v2" -linuxNodeVmSize "Standard_A2_v2"
(I attempted using “Standard_K8S_v1” for the worker node, but the memory peaked almost immediately resulting in a loop of creating new nodes that were also underpowered and never getting to a fully working state with the workloads described here.)
If you have 64GB or more you shouldn’t have to tweak this.
You can upgrade your workload cluster to a newer Kubernetes version independently of the host version. There are limits though – to run the newest versions of Kubernetes on the nodes you may have to upgrade the host to a newer version as well in some cases. Both clusters can be connected to Azure with Arc, but the workload cluster is the most important one here.
Connect the cluster you just created to Azure like this:
Connect-AzAccount
Enable-AksHciArcConnection -name aks01
At this point you should be good to verify things by putting some containers inside the cluster if you like.
I have a very simple frontend & backend setup here:
https://github.com/ahelland/HelloFoo
Since the images are on Docker hub you only need the /k8s/HelloFoo.yaml if you don’t feel like playing with the code or build your own images.
I wouldn’t call it fancy by any means, but it consists of two “microservices” you can test with a Kestrel-based image (dotnet run), Docker and Kubernetes.
While still on the server you can download kubectl as you will need that to proceed:
curl https://dl.k8s.io/release/v1.21.0/bin/windows/amd64/kubectl.exe -Outfile kubectl.exe
You also need credentials to access the cluster:
Get-AksHciCredential -name aks01
Apply with .kubectl.exe apply -f HelloFoo.yaml
Then you can run kubectl get -svc -A to give you the IP address (from the load balancer range you provided)
If you just want a plain cloud native setup you’re done now. (You can of course install kubectl on your desktop if you prefer.)
However I kinda like testing out “day 2” use cases as well.
GitOps and Flux is getting more popular as the option for installing configuration and services.
This is also slightly lacking in the docs. It’s actually quite simple (using the same repo):
Find the cluster through Azure Arc in the Azure Portal and go to the GitOps blade and “Add configuration”
 GitOps/Flux
For adding a public GitHub repo (like mine) it looks like this, but it’s also possible to add private repos. Note the use of the git-path parameter to point to the right folder (containing yaml):
 GitOps/Flux
For more background:
https://docs.microsoft.com/en-us/azure/azure-arc/kubernetes/use-gitops-with-helm
Once you have this working (you should probably have separate repos for config and apps) you can just go at it in your editor of choice and check in the results to do a roll-out. For an automated bootstrap scenario you can perform the setup with PowerShell as well. Which basically means – a script does all the work of setting up the Kubernetes cluster and then Git kicks in to deploy the essentials.
Since we’re at it we will of course need monitoring and tracing abilities too. Azure Monitor is decent, but it does have a cost so if you’re on a budget either skip it or keep an eye on it so it doesn’t run up a huge bill.
The combo of Prometheus and Grafana is a well known solution for Kubernetes, and that’s fairly easy to implement. Follow the instructions here:
https://docs.microsoft.com/en-us/azure-stack/aks-hci/monitor-logging
First enable Prometheus:
Install-AksHciMonitoring -Name aks01 -storageSizeGB 100 -retentionTimeHours 240
To load the config for Grafana:
kubectl apply -f https://raw.githubusercontent.com/microsoft/AKS-HCI-Apps/main/Monitoring/data-source.yaml

kubectl apply -f https://raw.githubusercontent.com/microsoft/AKS-HCI-Apps/main/Monitoring/dashboards.yaml
Then install Grafana (which will use the data source and the dashbord from the previous two yaml files). (Note that this requires the installation of Helm – https://helm.sh/docs/intro/install/ downloading the zip and extracting should work on Windows Server.)
helm repo add grafana https://grafana.github.io/helm-charts

helm repo update

helm install grafana grafana/grafana --version 6.11.0 --set nodeSelector."kubernetes.io/os"=linux --set sidecar.dashboards.enabled=true --set sidecar.datasources.enabled=true -n monitoring
Retrieve the Grafana secret (and have it ready for logging in to the dashboard afterwards):
kubectl get secret --namespace monitoring grafana -o jsonpath="{.data.admin-password}" | base64 --decode ; echo
(Note that the base64 option doesn’t work on Windows, so you would need to do that decode separately.)
 Grafana displaying Prometheus metrics
There’s one more thing we want to do in the monitoring and diagnostics department, but a small digression first.
For a small lab at home it’s not necessary to be super strict with security and policies inside the cluster, but if you want to practice production the term “service mesh” will come up. I’m not going to do a comparison of those, but Istio, Linkerd and Consul are popular choices that Microsoft provides instructions for as well:
https://docs.microsoft.com/en-us/azure/aks/servicemesh-osm-about
For more info on meshes you can also check out https://meshery.io
I wanted to test “Open Service Mesh” as that is available as an add-on for AKS. I found these instructions clearer:
https://docs.microsoft.com/en-us/azure/azure-arc/kubernetes/tutorial-arc-enabled-open-service-mesh#install-arc-enabled-open-service-mesh-osm-on-an-arc-enabled-kubernetes-cluster
Since I didn’t want to bother with making sure I had the right version of Azure Cli installed locally I just did it in Azure Cloud Shell :) (Point being that you don’t need to be on-prem to perform this step.)
There is a snag at the time of writing this. The instructions point to version 0.8.4, but I wanted to use 0.9.0 (newer) which required me to use this cmdlet:
az k8s-extension create --cluster-name aks01 --resource-group ARC-AKS-01 --cluster-type connectedClusters --extension-type Microsoft.openservicemesh --scope cluster --release-train staging --name osm --version 0.9.0
Since I’m using OSM I will also follow the MS instructions for installing the bookstore app:
https://docs.microsoft.com/en-us/azure/aks/servicemesh-osm-about?pivots=client-operating-system-windows#deploy-a-new-application-to-be-managed-by-the-open-service-mesh-osm-azure-kubernetes-service-aks-add-on
Note that you should not use the instructions for Grafana and Prometheus from this page – these instructions are for “cloud AKS” not “on-prem AKS”. (Prometheus will fail to run due to permissions issues.)
You can however use the yaml from this page to install a popular tracing tool called Jaeger. Copy the yaml on the page and save to a file while adding the namespace on top:
apiVersion: v1
kind: Namespace
metadata:
  name: jaeger
  labels:
    name: jaeger
---
And apply:
kubectl apply -f jaeger.yaml
Another quick note about the instructions here. It is referred to a configmap for the settings – this is not used in 0.9.0 any more so to read the config you will need to run the following command:
kubectl get meshconfig osm-mesh-config -n arc-osm-system -o yaml
We need to make two small adjustments (enable tracing and change the address for Jaeger) to this meshconfig which can be done by patching the meshconfig:
kubectl patch meshconfig osm-mesh-config -n arc-osm-system -p '{"spec":{"observability":{"tracing":{"enable":true,"address": "jaeger.jaeger.svc.cluster.local","port":9411,"endpoint":"/api/v2/spans"}}}}' --type=merge
On Windows you will probably see an error about invalid json so you have to do an extra step:
$jsonpatch = '{"spec":{"observability":{"tracing":{"enable":true,"address": "jaeger.jaeger.svc.cluster.local","port":9411,"endpoint":"/api/v2/spans"}}}}' | ConvertTo-Json

kubectl patch meshconfig osm-mesh-config -n arc-osm-system -p $jsonpatch --type=merge
More info:
https://docs.openservicemesh.io/docs/concepts_features/osm_mesh_config/
 Jaeger
For testing you can port-forward to the pods and this makes sense for the bookstore apps, but it’s probably better to set up load balancers for this when you want it more permanent so create a file like this to expose Grafana, Jaeger and Prometheus:
apiVersion: v1
kind: Service
metadata:
  namespace: monitoring
  name: grafana
  labels:
    app.kubernetes.io/instance: grafana
    app.kubernetes.io/managed-by: Helm
    app.kubernetes.io/name: grafana
    app.kubernetes.io/version: 7.5.5
    helm.sh/chart: grafana-6.11.0
spec:
  externalTrafficPolicy: Cluster
  ports:
  - port: 80
    protocol: TCP
    targetPort: 3000
  selector:
    app.kubernetes.io/instance: grafana
    app.kubernetes.io/name: grafana
  sessionAffinity: None
  type: LoadBalancer
---
apiVersion: v1
kind: Service
metadata:
  namespace: jaeger
  name: jaeger
spec:
  externalTrafficPolicy: Cluster
  ports:
  - port: 80
    protocol: TCP
    targetPort: 16686
  selector:
    app: jaeger
  sessionAffinity: None
  type: LoadBalancer
---
apiVersion: v1
kind: Service
metadata:
  namespace: monitoring
  name: prometheus
spec:
  externalTrafficPolicy: Cluster
  ports:
  - port: 80
    protocol: TCP
    targetPort: 9090
  selector:
    app: prometheus
  sessionAffinity: None
  type: LoadBalancer
It would actually be even better to set up ingresses and DNS names, etc. but for the purpose of getting your lab up and running in a basic form this is out of scope.
Sure, I skipped some parts you might want to look into here:
- The docs refer to Prometheus scraping metrics from OSM, which you kind of want, but I left that out for now.
- The service mesh is set to permissive which means you don’t get all that mesh goodness.
- I have not touched upon network policies or plugins.
- Since I didn’t do ingress and didn’t do DNS it follows that https isn’t part of the picture either.
- While GitOps is part of the CI/CD story we have not explored a setup with pipelines and repos so you might want to tinker with GitHub Actions to automate these pieces.
I will be exploring these features as well (don’t know if I’ll put out some instructions on that or not), and I encourage you to do the same. With the risk of repeating myself – this is intended to get an AKS cluster going so it can be used for a basic cloud native setup. What you make of it is up to you :)
And the disclaimer – I know that this works and seems to be an acceptable way to use the software at the time of writing, but I cannot predict if Microsoft will change anything on the technical or licensing side of things.
by Contributed | Jul 6, 2021 | Technology
This article is contributed. See the original author and article here.
According to the Verizon 2020 Data Breach Investigative Report, most malware attacks originate through email attachments, many with embedded malicious content. With the constant threat of ransomware, zero-day attacks, and state-sponsored hackers, managed service providers (MSPs) and cloud service providers (CSPs) need effective solutions to mitigate risks to themselves and their customers.
Azure Marketplace partners such as odix provide an essential complementary security layer that purges email-based attacks before they reach end users. FileWall for Exchange Online from odix uses content disarming and reconstruction (CDR) technology to prevent attacks delivered via email attachment, supplementing Microsoft 365 Exchange Online security capabilities.
Yehudah Sunshine, Head of PR & Chief Evangelist at odix explains how its CDR technology adds defense in depth to Microsoft 365 technology, empowering system administrators and users:
The threat of file-based attacks is on the rise
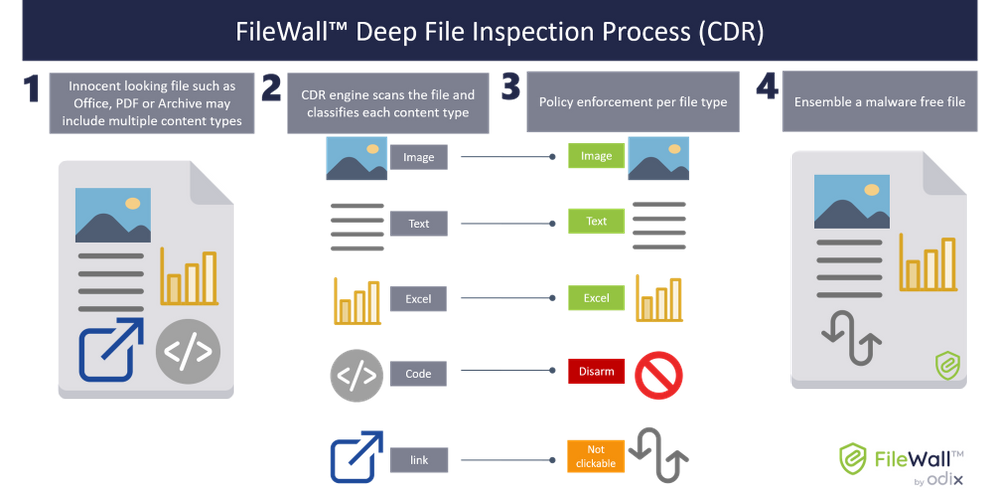
Originally designed for military needs, CDR technology has been adapted for civilian use to provide strategic protection against malware attempting to enter an organization’s network through email attachments. A 2018 Gartner report found that CDR effectively defends against new and unfamiliar threats that traditional cybersecurity solutions, such as antivirus, sandbox, and extended detection and response (EDR), are unable to stop.
CDR relies upon comprehensive deep file inspections to inspect, strip, and neutralize incoming files, removing malicious attachments and embedded dynamic content before a user has access to the email attachment. The clean and secure files are reconstructed and uploaded via the mail server to the intended recipient. The entire process takes seconds.
Policy management combines with file inspection to provide fine-grained control for system administrators, resulting in exacting coverage to all users and access levels. System administrators can provide a high level of protection against malware through customizable settings.
FileWall for Exchange Online, odix’s dynamic CDR-based security add-in, stops the threat of file-based attacks in its tracks. Purging malicious code embedded in all common file types and dozens of other file types, FileWall for Exchange Online is an ideal complementary product that amplifies Microsoft Exchange Online Protection and Windows 365 defender to provide malware prevention to users across sectors and business sizes.
odix has been at the cutting edge of CDR technology for several years and stops distributed malware attacks (DMAs), encrypted malware attacks (EMAs), zero-day attacks, and advanced persistent threats (APTs).
Supporting native Microsoft security provides critical benefits
FileWall for Exchange integrates with Exchange Online through single-click deployment and onboarding. Administrators gain enhanced protection and visibility into malware threats without changes to infrastructure. FileWall facilitates continuous mail flow to mailboxes without any loss of security capabilities.
Catering to Microsoft 365 users through a range of cloud-based solutions, odix’s solutions have successfully been integrated into the energy, banking and finance, utility, healthcare, and IT sectors, among others.
Who is odix?
odix is an Israel-based cybersecurity company with offices in the United States and Europe, a Microsoft Intelligent Security Association (MISA) member, and a Microsoft partner. odix has designed native-level security solutions for the Microsoft 365 Exchange Online ecosystem.
By developing solutions from the ground up using the Graph API, optimizing reporting capabilities to Microsoft Sentinel, and utilizing the ethos that complementary solutions must fully support Microsoft Exchange Online Protection and Microsoft 365 Defender deployment, odix’s security solutions provide an added protection layer for Microsoft 365 users.
To learn more and get a free trial of FileWall for Exchange Online, visit its page on the Azure Marketplace.
by Contributed | Jul 6, 2021 | Technology
This article is contributed. See the original author and article here.
The Azure Purview product glossary is now live!
Our team is building out a comprehensive glossary defining the product terms and concepts customers encounter in the UI. As we approach GA, we’re continuing to add terms, but we need your help to make the glossary even better.
Share your feedback with us on Yammer or via the MS docs site.


Recent Comments