This article is contributed. See the original author and article here.
This is the next segment of our blog series highlighting Microsoft Learn Student Ambassadors who achieved the Gold milestone and have recently graduated from university. Each blog in the series features a different student and highlights their accomplishments, their experience with the Student Ambassadors community, and what they’re up to now.
Today we meet Rogerio Rodrigues who is from Brazil and recently graduated from the Universidade Federal de São Paulo with a master’s degree in computer science.
Responses have been edited for clarity and length.
When you joined the Student Ambassador community in 2012 as an undergraduate student at Universidade Federal de São Paulo, did you have specific goals you wanted to reach?
I had some goals like learning to speak in public because I was very shy but wanted to contribute to public events in the Student Ambassador program. I also wanted to go deeper into Microsoft technologies like Azure, DevOps, and Mobile Development with Xamarin. I had a dream to work at Microsoft as an employee. The community helped me a lot with these goals. I learned public speaking and became an MBA technical training teacher. I learned a lot about Microsoft technologies, received recognition in the technical community, and became a Microsoft Most Valuable Professional (MVP). I am pleased to have been part of the community, which undoubtedly contributed the most to my professional career.
As a Student Ambassador, what were the accomplishments that you’re the proudest of and why?
In 2018 and 2019, together with other Student Ambassadors and Microsoft MVPs , we created an initiative called Natal Nerd where we collected gifts, toys, and cash as donations to help orphans and at-risk children for Christmas. Several Student Ambassador events and lectures about Microsoft technologies were held at universities with companies in São Paulo, and the entry fee was a toy to donate to Natal Nerd. We presented at 23 universities in the country and reached more than 2,500 students and professors, disseminating and sharing knowledge about Microsoft technologies and the Imagine Cup. We were able to collect gifts to improve Christmas for more than 800 children.
In 2019, another Student Ambassador and I delivered 4 talks at 11 technical events at the Microsoft Student Partners Tech Days at eight universities in Brazil with the help of MVPs [Editor’s note: Microsoft Student Partners is the former name of the Microsoft Learn Student Ambassadors program]. We delivered another four talks in countries such as Peru, Nicaragua, Colombia, and Mexico with the help of other Student Ambassadors.
In 2019 and 2020, I was chosen to go to the Microsoft Student Partner Summit and the Imagine Cup Final because of my contributions. The events in 2019 were amazing – opportunities that I will never forget because they was very valuable to me. Even though the events in 2020 were virtual, I was very happy to have received the recognition.
My dream was to become a Microsoft employee. I had already tried twice and didn’t pass the interviews, but last year I became a Customer Engineer at Microsoft and was assigned to serve large public sector banking clients. I’ve also started my part-time doctorate program in computer science with a focus on environmental science and weather satellites. After completing my doctorate, I plan to do a post-doc in my line of research, continue to teach at universities, and contribute to science.
If you could redo your time as a Student Ambassador, is there anything you would have done differently?
The only thing I would have done differently would be to study more English right away when I joined in order to communicate more easily with other Student Ambassadors around the world. Learning to speak English better made a big difference for me in 2019 when I was at the Student Partner Summit for the first time because in addition to learning new technical content, I met many other Student Ambassadors from other cultures and the amazing Student Ambassador Program Team.
If you were to describe the community to a student who is interested in joining, what would you say about it to convince him or her to join?
If you desire to be a unique professional, you should apply to the Student Ambassadors program. In addition to receiving special treatment in the community, you will have access to a lot of technical information, you will have the opportunity to network with people from all over the planet, and you will have contact with Microsoft professionals where you can find excellent opportunities.
Furthermore, the community helps you have a much broader view of technology than just Microsoft technologies, as you will have contact with different areas and the opportunity to work on fantastic projects.
What advice would you give to new Student Ambassadors?
Actively participate in the community. Join other Student Ambassadors in Leagues or groups to create initiatives. It’s fantastic, and you learn a lot. Make contact with other Student Ambassadors as you will experience different cultures, practice languages, learn more technology, and perhaps share your knowledge with other Student Ambassadors. Actively contribute to your local community and promote content at your university. These actions will help you to secure further knowledge and develop new skills. The community provides a sea of opportunities.
What is your motto in life, your guiding principle?
My motto in life is “Be different. Help lift but not drop”. Helping those we can help will bring us great experiences, and we will be doing our part in making the world better.
What is one random fact about you that few people are aware of?
I’m a big fan of Star Wars. I have a big tattoo on my back that’s the design of an X-Wing spaceship with the 3 characters I like–Luke, Leia, and Rey Skywalker.
This article is contributed. See the original author and article here.
Juniper Networks has released security updates to address vulnerabilities affecting multiple products. An attacker could exploit some of these vulnerabilities to take control of an affected system.
CISA encourages users and administrators to review the Juniper Networks security advisories page and apply the necessary updates.
This article is contributed. See the original author and article here.
Citrix has released security updates to address vulnerabilities in Hypervisor. An attacker could exploit these vulnerabilities to take control of an affected system.
CISA encourages users and administrators to review Citrix Security Update CTX335432 and apply the necessary updates.
This article is contributed. See the original author and article here.
Apple has released security updates to address a vulnerability affecting iOS 15.2.1 and iPadOS 15.2.1. An attacker could exploit this vulnerability to cause a denial-of-service condition.
CISA encourages users and administrators to review the Apple security page for iOS 15.2.1 and iPadOS 15.2.1 and apply the necessary updates.
This article is contributed. See the original author and article here.
As digital transformation drives innovation and transforms the way we work, we see business operations and traditional internal processes being disrupted daily. To adapt and scale changes across their business, many organizations are overwhelmed and faced with digitizing thousands of manual checklists, paper forms, documents, and more. The good news is today’s Microsoft solutions make this transition easier than ever before. With Microsoft’s suite of low-code development solutions (e.g., Microsoft Power Platform, Power Automate, and AI Builder), employees of all skill levels can create and customize business applications and processes. By combining these solutions with Microsoft Dynamics 365 Guides, a mixed reality application that offers step-by-step, hands-free work instructions and collaboration, you can convert your existing 2D manuals into 3D holograms, rather than transferring manually. Once converted, organizations can use Dynamics 365 Guides to provide immersive, on-the-job guidance that will increase efficiency, increase knowledge retention, and enable your organization to adapt at the speed of change.
Better together: Dynamics 365 Guides, AI Builder, and Power Automate
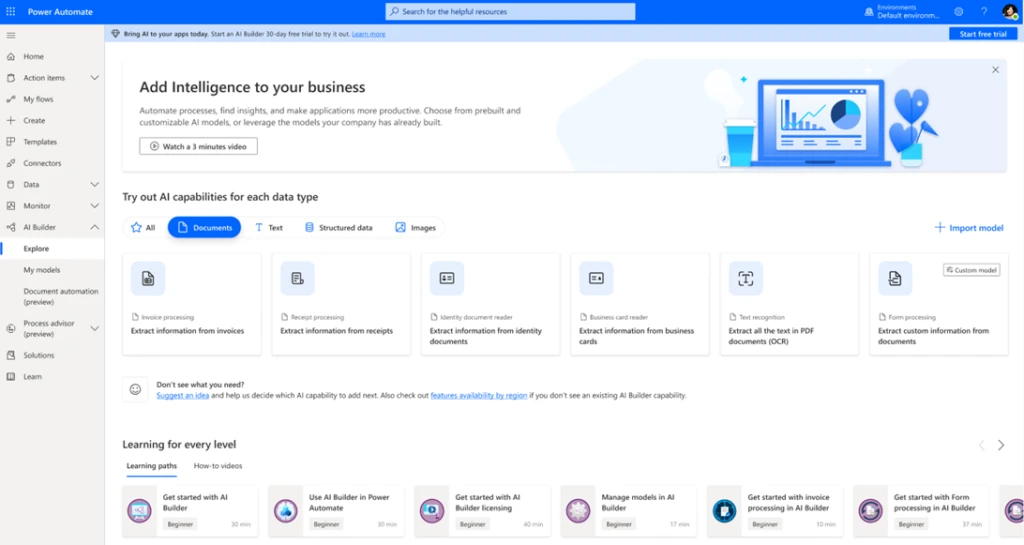
With Dynamics 365 Guides, authoring instructions is as simple as creating a presentation in Microsoft PowerPoint. Using the Guides PC and HoloLens apps, you create and edit instructions by dragging and dropping 2D and 3D content into your real-world environment to show users how and where to complete tasks. However, converting an existing multi-page manual by copying the information from scratch makes the authoring process feel time-consuming and daunting. This is where Microsoft Power Platform AI Builder comes in. AI Builder empowers anyone to build, train, and publish AI models, enabling you to infuse AI into your regular processes. You can create and train a custom AI model to extract text information from a variety of paper manuals in minutes, or use one of the pre-built models.
Using Power Automate, you save the extracted information to Microsoft Dataverse (an enterprise-grade intelligent scalable data platform that powers business applications like Dynamics 365 Guides). By storing the data in a format readable by Dynamics 365 Guides, users can simply open the Dynamics 365 Guides PC and HoloLens apps and add 3D content on top of the text instructions extracted from existing manuals.
In this blog, we’ll focus on how to use the AI Builder form processing model to extract and convert information and create a guide. Every organization has work instructions that come in different formats, such as checklists for inspections, training documentation, and standard operating procedures. By using the form processing model, you can read and save information from existing documents such as images or PDF files.
When you automate this process, you save valuable time by reviewing, extracting, organizing, and saving the data automatically by using Power Automate and Power Apps.
Overall process
Creating a guide using a custom AI model and Power Automate requires three simple steps:
Train an AI model with AI Builder to extract text from a .PDF file or image.
Take extracted information from the AI model and create a guide using Power Automate.
Enhance the guide further and author in the Dynamics 365 Guides PC and HoloLens apps.
For a closer look at each step below, follow along with a team at Toyota Motors North America in this video, at the 2:40 min mark.
Step one: Train an AI model with AI Builder to extract text from a .PDF file or image
Create your AI model: Choose “form processing” (under the “Documents” area of the AI Builder homepage) and go through the step-by-step wizard.
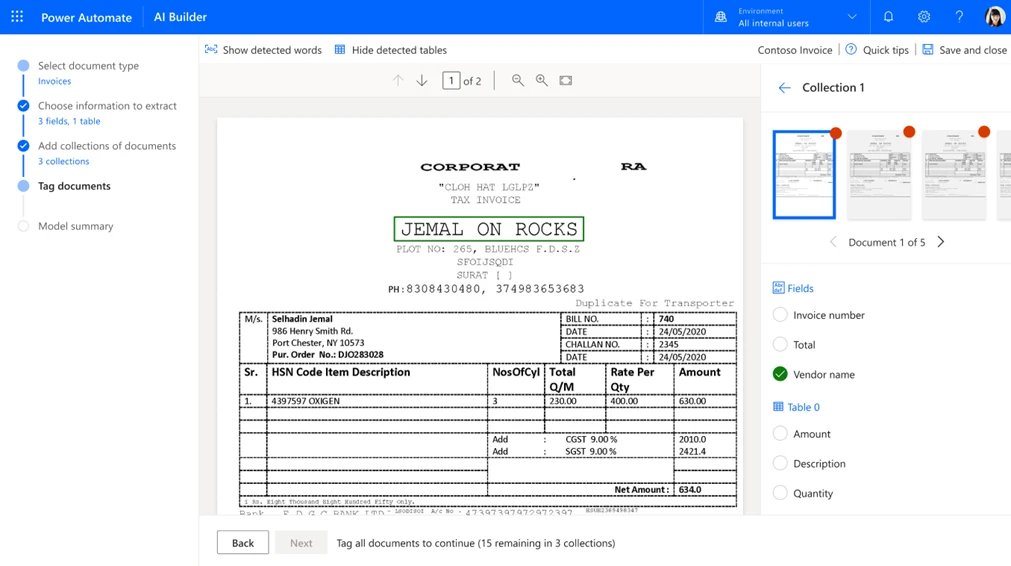
Define the data you want to extract: Define the fields, tables, and checkboxes you want to teach your model to extract. See the create a form processing custom model documentation for more details.
Upload your documents: Upload at least five different versions of the same basic document. AI Builder also supports collections of documents that have different layouts. See the AI Builder form processing models blog for more details.
Select important areas, and then train your AI model: Teach your model areas it should learn aboutand then train it. Training is an automatic process where AI Builder “teaches” your AI model to understand a specific instruction type, such as a PDF checklist.
Publish and use your new AI model: Now you can automate document processing in apps and flows.
Step two: Take extracted information from the AI model and create a guide using Power Automate
Extract the data: Create a Power Automate flow to take the extracted information from AI Builder and create a guide with step-by-step instructions. You can do this in minutes and no coding skills are required.
Create a Power Automate flow and convert data into steps: Build each piece of data as a “step” for your instructions with easy-to-follow drag-and-drop functionalities. This is where you reference the Dynamics 365 Guides data in Microsoft Dataverse. By harnessing Dataverse, we can connect data so that your instructions are now editable from the Dynamics 365 Guides PC app.
Step three: Author in the Dynamics 365 Guides PC and HoloLens apps
Make edits in the PC and HoloLens apps: Once content for your guide is in the right spot, you can author in the Dynamics 365 Guides PC and HoloLens apps to make edits and changes.
Optimize for 3D experience: Customize the steps to better suit hands-free needs based on a 3D, mixed-reality experience. Add links, photos, reports, 3D models, and other resources.
Whether creating a single manual or hundreds, AI Builder and Dynamics 365 Guides can transform instructions and training, making your processes easier, smarter, and faster. Seamlessly capture, translate, and extract information to unlock a new way of working and save your teams hours of time.
“Customers have been able to save months of deployment time by using AI Builder and Guides, allowing them to quickly integrate mixed-reality work instructions into their daily workflows without any development expertise. They’re able to update content they already have into 3D holographic instructions for a variety of scenarios, including assembly, changeovers, training, and service and maintenance, resulting in improvements to safety, efficiency, and reduced onboarding time.”Shirley Ho, Senior Designer, Dynamics 365 Guides.
Getting started
Ready to design a guide using AI Builder, Power Automate, and Dynamics 365 Guides today? Here’s how to get started.
Power Apps: A Power Apps or Power Automate license is required to start using AI Builder. For more details about Power Apps and Power Automate licensing, see the licensing guide.
AI Builder: Models in preview do not require an AI Builder trial or license nor consume credits. Anybody can test AI Builder and start a free trial today.
Other resources
AI Builder in Power Automate
Learn more about AI Builder and get your questions answered using AI Builder documentation. Make sure to see these topics:
This article is contributed. See the original author and article here.
By Erin Boris, Idan Basre and Yoann Mallet
One of the latest app connectors to be added to Microsoft Defender for Cloud Apps is for Smartsheet.
As we have in the past for other protected apps, we would like to share a few examples of how to use it to secure your Smartsheet deployment.
Why Connect Smartsheet?
As with other apps, connecting Smartsheet to Defender for Cloud Apps allows you to leverage some of the built-in features of your favorite CASB, such as:
Benefit
Description
Policy or template
Threat and Anomaly Detection
Detect cloud threats, compromised accounts, and malicious insiders
The following built-in Threat detection policies automatically apply when Defender for Cloud Apps is connected to Smartsheet:
Use the audit trail of activities for forensic investigations
Leverage Advanced Hunting Queries as part of the Microsoft 365 Defender Portal to audit the use of Smartsheet and create policies
How to connect Smartsheet?
Let’s start with connecting Smartsheet.
Detailed instructions are available here, and if you prefer our video, check it out below:
Leverage Microsoft Defender for Cloud Apps with Smartsheet
The best way to get quick value from Defender for Cloud Apps when protecting Smartsheet, is to use the Advanced Hunting feature in the Microsoft 365 Defender portal.
If you have not used that portal just yet, simply visit http://security.microsoft.com and you will be redirected to it.
Once there browse to advanced hunting. This will enable you to write your own KQL queries to gather relevant information from the Defender for Cloud Apps activity logs.
Here are two relevant examples:
Scenario 1: New user invited, has an external email address
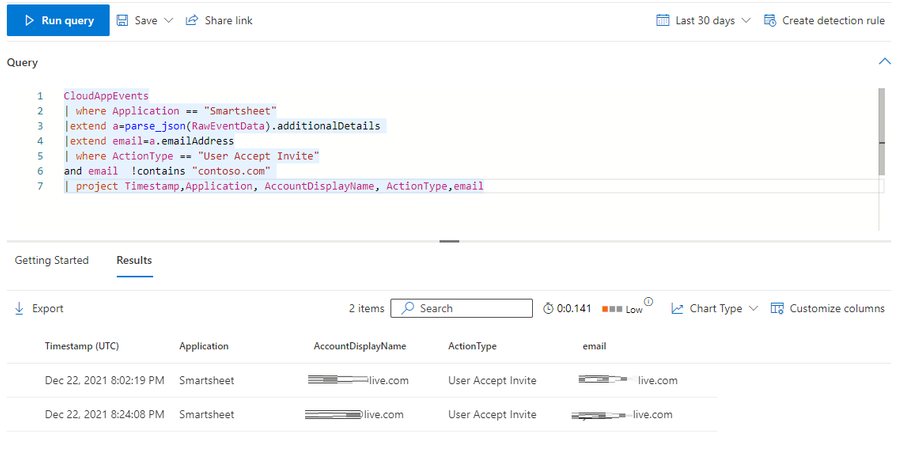
Having a new user invited to Smartsheet with an external email address may be suspicious. In order to detect this, you can leverage the following KQL Query:
CloudAppEvents
| where Application == "Smartsheet"
|extend a=parse_json(RawEventData).additionalDetails
|extend email=a.emailAddress
| where ActionType == "User Accept Invite"
and email  !contains "contoso.com"
| project Timestamp,Application, AccountDisplayName, ActionType,email
Below is an example of the result of that query in Advanced Hunting:
This can potentially help you detect any attempt to exfiltrate data or identify a malicious user enabling an external account.
Another option to view all accounts with external email addresses that currently have access to Smartsheet, is from the API connector properties in Defender for Cloud Apps.
A filter can be used to see all external accounts that have accepted an invitation.
Scenario 2: File sent as attachment to external email address
When files are sent as an attachment from Smartsheet directly, to an external email address, this can be a sign of data exfiltration.
In order to identify such activities, you can leverage the following KQL Query:
CloudAppEvents
| where Application == "Smartsheet"
|extend a=parse_json(RawEventData).additionalDetails
|extend Recipient=a.recipientEmail
| where ActionType =="Sheet Send As Attachment"
and Recipient  !contains "contoso.com"
| project Timestamp,Application, AccountDisplayName, ActionType,Recipient
Creating alerts from these queries
In addition to detecting these actions, Microsoft 365 Defender also allows you to create your own custom detections, and identify when these occur in near real-time, as described here.
As you can imagine, when using such powerful queries, the sky is the limit! Feel free to share any relevant KQL query you have identified for Smartsheet in the comments below.
Resources:
For more information about the features discussed in this article, please read:
We welcome your feedback or relevant use cases and requirements for this pillar of Cloud App Security by emailing CASFeedback@microsoft.com and mentioning the area or pillar in Cloud App Security you wish to discuss.
Learn more
For further information on how your organization can benefit from Microsoft Cloud App Security, connect with us at the links below:
This article is contributed. See the original author and article here.
The two billion frontline workers, which represent 80 percent of the world’s workforce, have weathered risk, exhaustion, and ongoing disruption throughout the pandemic. From shutdowns to new safety protocols to increased workloads and dwindling inventory, the frontline is constantly facing challenges. Today we are releasing a set of technology innovations and partnerships to reduce stress on the frontline and empower the way they work and interact.
This article is contributed. See the original author and article here.
Adobe has released security updates to address vulnerabilities in multiple Adobe products. An attacker could exploit some of these vulnerabilities to take control of an affected system.
CISA encourages users and administrators to review the following Adobe Security Bulletins and apply the necessary updates.
This article was originally posted by the FTC. See the original article here.
As you may have heard, the U.S. Department of Education announced another extension of the flexibilities offered to federal student loan borrowers. Understanding these options can help you make more informed decisions about paying your bills and prioritizing your debts.The benefits have been extendedthrough May 1, 2022.
You don’t need to hire a company to help you get this student loan payment relief. The program is already in place and there’s nothing you need to do to enroll. Anyone who tells you they can help you sign up for this program for a fee is a scammer.
So, just to recap, what does this mean for you if you have a federal student loan?
This program gives temporary payment reliefto borrowers with qualifying federal student loans. But some federal student loans don’t qualify – for example, older Family Federal Education Loan (FFEL) program loans or Perkins Loans that are owned by the school you attended. Contact your federal loan serviceronline or by phone to find out if your loans are eligible.
If your federal loans are covered, the U.S. Department of Education has automatically placed your loans into what’s called “administrative forbearance.” That means you can stop making payments on those loans right away, up through May 1, 2022. If your payments automatically come out of your bank account, check if any payments have been processed since March 13, 2020. If they have, you may be able to get a refund as part of administrative forbearance.
If you want to keep making payments on your qualifying federal student loan through May 1st, the interest rate is now 0%. So any payments you make during the forbearance period may help you pay off your debt faster. If you’re on an income-based repayment program and/or a forgiveness program, you should check out Federal Student Aid’s Coronavirus pageto see which option makes sense for you.
If your federal student loans are in default, the U.S. Department of Education has stopped making collection calls, and sending letters or billing statements through May 1, 2022. And if your federal loans were in default and your employer continues to garnish your wages, you’ll get a refund.
This program only applies to federal student loans. Not sure what kinds of student loans you have? Here are two things you can do to find out:
Get a complete list of your private and federal student loans by pulling your credit report. (In fact, you can get your report for free every weekthrough April 20, 2022.) Read through itand find your student loans, taking note of the companies that are your lenders or loan servicers. Compare it to the full list of federal loan servicers found here.
Confirm which of your loans are federal. Log into FSAor call the Federal Student Aid Information Center (FSAIC) at 1-800-433-3243.
Brought to you by Dr. Ware, Microsoft Office 365 Silver Partner, Charleston SC.
This article is contributed. See the original author and article here.
At Microsoft Ignite, Microsoft Dynamics 365 Marketing announced a range of new AI features. We strongly believe in the power of AI to help businesses and their customers grow. We also recognize that these new technologies have the potential for misuse and harm.
That’s why in Dynamics 365 Marketing, we are taking an intentional and rigorous approach to upholding Microsoft’s responsible AI principles. AI requires scrutiny, thoughtfulness, and research to first understand potential impacts on people and society, and then seek solutions that mitigate harm.
As Satya Nadella says, Microsoft runs on trust. And trust must be earned in the short term as well as the long term. In Dynamics 365 Marketing, we see responsible AI as an opportunity to demonstrate trustworthiness as well as a path for innovationa way to minimize harm and expand our capacity to provide useful and delightful experiences for our customers and their customers.
Let’s take a closer look at some of the work we’re doing on a new AI feature called Content ideas.
What is Content ideas and how does it work?
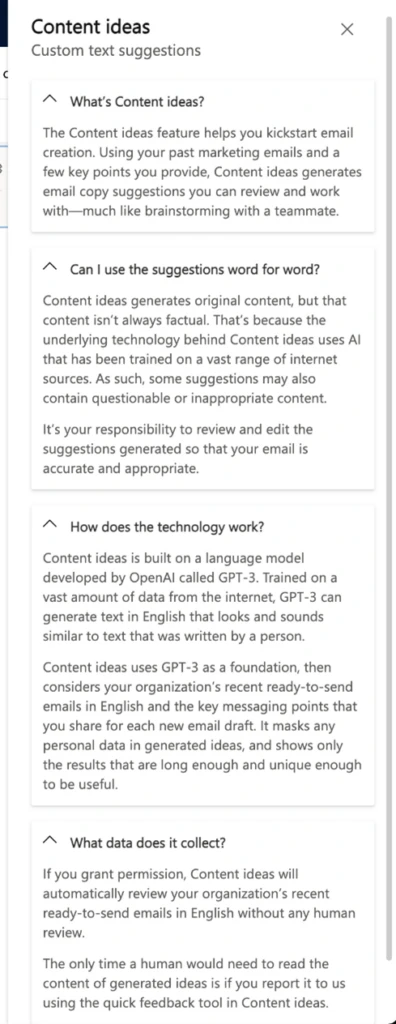
The Content ideas feature in Dynamics 365 Marketing helps marketers get inspiration for emails and create their best content faster. Marketers can type in a few key points, and Content ideas will generate original content based on those key points. Under the hood, Content ideas also references the customer’s past marketing emails so it can generate ideas that are similar in tone, structure, and style. This is a powerful advancement I’m very excited about, where marketers never have to start from a blank slate when writing content.
The AI technology behind this feature is a large language model called GPT-3, developed by OpenAI and currently available in an invite-only preview as part of Microsoft’s Azure OpenAI Service as well as through OpenAI’s API. GPT-3 can perform a wide range of natural language tasks, including summarizing text, analyzing text for sentiment, andas it’s applied in Content ideasgenerating original text that looks like a human wrote it. GPT-3 is one of the leading examples of the type of AI model the industry is moving toward, rapidly accelerating AI capabilities that bring value to customers.
But large language models such as GPT-3 come with risks, including generating content that isn’t factual or content that reflects the biases of the dataset used for trainingwhich, in the case of GPT-3, was approximately 45TB of text from the internet. To mitigate such risks, OpenAI and Microsoft are committed to helping customers identify potential safety issues that could arise from using GPT-3 and providing best practices for safety. And at Microsoft, as we incorporate these kinds of technologies into our products, we’re also investing deep thought into how risks might show up for our customers in our specific scenarios, and how we can address those challenges.
Here, we’ll zoom in on one area we’re looking at closely for Content ideas: the user experience (UX).
UX questions for a responsible AI approach
Dynamics 365 Marketing has focused on human-centered research to deeply understand the needs and aspirations of marketing content creators, as well as explorations in UI design and data science, to translate responsible AI principles into a powerful UX that elevates and empowers human expertise.
As Charles Lamanna, Corporate Vice President of our Business Applications and Platform says, “An emerging technology like GPT-3 is such an exciting breakthrough in innovation. I’m proud of products like Dynamics 365 Marketing, where teams are working across engineering and design to intentionally think about how we responsibly bring AI to our customers.”
Early research leads us to these key questions:
1. How might we build transparency around how Content ideas works, so people can use the feature to meet their specific needs?
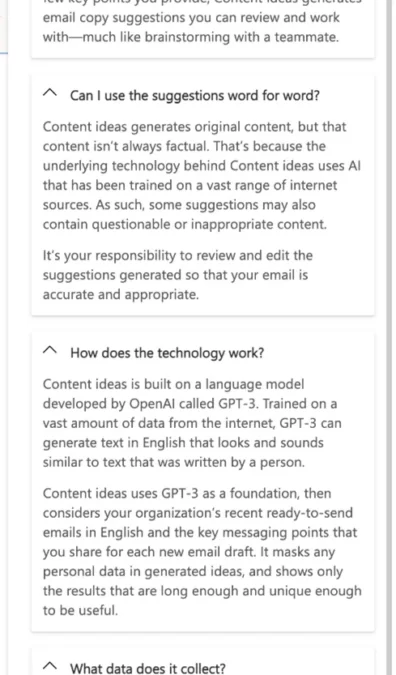
Setting clear expectations about Content ideas’ capabilities and limitations is essential, both to help people achieve their goals and to prevent people from using it in a way that isn’t intended. The more people understand how GPT-3 uses their key points to generate original content, the easier it is for them to craft key points that will get them helpful suggestions. In the current UX for Content ideas, we offer a “Learn more” panel from multiple points during onboarding. This panel is structured similar to a FAQ, addressing top questions about what the feature does and how the technology works. We’re also using design principles such as progressive disclosure to give people relevant information at just the moment they need it. For example, after marketers have submitted their key points and are waiting for Content ideas to generate suggestions, the loading screen sets expectations around potentially seeing unexpected results and offers tips for what to do next if none of the suggestions are a good fit. We’re continuing to explore ways to help people better understand how their choices affect the system outputs.
2. Once people understand how the technology works, how might we give people more control over the system?
A foundational pillar in human-AI collaboration is making sure people have meaningful oversight and control. The right amount of control helps people make the system work for their goals and context, and helps them build confidence in the system. With Content ideas, we want to empower content creators’ expertise and give them the right levers and buttons so they can use the system in ways that work for them, while automating parts of the process that don’t require human judgment. For example, we frame the feature as a brainstorming and writing partner, rather than a magical tool that does all the writing for you. In the end, the author is in chargeContent ideas makes suggestions that they can choose to use, edit, or ignore. Our research has also shown that content creators want more granular control over generated suggestions, such as being able to copy and paste smaller sections from different suggestions, and the ability to instruct the system on additional attributes such as audience and tone. We’re exploring how to integrate these potential interactions and others along these lines.
3. Once people understand how the technology works and how they can influence it, how might we help them understand their accountability and feel confident about their responsibility for the final content?
Large pre-trained language models like GPT-3 are general purpose and don’t always produce perfectly accurate results, particularly for tasks that require specific knowledge like the latest pricing data for a product. This means that even with detailed key points to start with, Content ideas might include color variations, prices, or sale dates that could look realistic but might not be correct. We want to make sure content creators feel confident in their responsibility as final owners of the content, making sure they have robust opportunities throughout the experience to check for accuracy and edit as appropriate. Additionally, in our “Learn more” panel, we directly answer the question, “Can I use the suggestions word for word?” (The short answer: Yes, as long as you review carefully for accuracy and appropriateness.) As we move forward, we’re exploring ideas such as a reminder to check for accuracy before someone adds a suggestion to their draft, or a feature to flag details that might benefit from a close read.
4. How might we measure the success of our UX to capture how well we are building trust, supporting creativity, and empowering user confidence in using Content ideas to meet their goals?
Success in UX is often measured by things like: Were we able to help someone accomplish a task more quickly? Was the task done at a higher quality? And are people satisfied with the result? Content ideas invites us to consider additional ways in which people might have a successful experience. For example, since the feature can offer a range of possible ideas for a content creator to consider, if someone is looking for multiple avenues of inspiration, creativity might look like generating many ideas and then building new ideas from thererather than copying and pasting a single idea. In our research for Content ideas, we’re considering how to qualitatively assess people’s experiencessuch as how much they felt that the feature helped them become more creative, and how confident they were over having control over the final textso that we have a more holistic understanding of where we can improve the experience to support a range of user goals. We’re also exploring ways of gathering feedback in the UI to help us understand the usefulness of generated ideas.
These are hard questions, and we don’t have all the answers yet. But we are committed to developing solutions that minimize harm and empower human expertise, while always providing our customers and our users an amazing experience. Ultimately the goal is to build high-quality experiences that establish appropriate trust, bringing sustainable value to people and businesses. We’re educating ourselves and trying to learn quickly so that we can achieve this vision for our future and yours. I’m proud that Content ideas is one of many areas Microsoft is looking at when it comes to responsibly implementing AI technologies like GPT-3, such as the recently launched Ten Guidelines for Product Leaders to Implement AI Responsibly and the new responsible AI dashboard.
And to learn more about how your organization can elevate your customer experiences, visit the Dynamics 365 Marketing webpage and sign up for a free Dynamics 365 Marketing trial to explore real-time customer journey orchestration and the other rich capabilities offered in Dynamics 365 Marketing.


Recent Comments