2022 release wave 1 brings true mobility to field service management
This article is contributed. See the original author and article here.
The pandemic has greatly influenced the way we work. For many of us, the option to work from home was a relatively smooth transition. Video calls, instant messaging, and other digital tools filled the colleague collaboration gapreplacing in-person meetings and chats around the water cooler. Office-based workers overcame a few technological speed bumps; however, business continued to hum along at a decent pace.
But what if the focus of your job is to physically interact with the customer and their equipment on site? This level of interaction is dependent on a whole new set of digital tools, and nowhere is this more important than in the delivery of field service. In fact, the most crucial aspect of field service is mobility.
For there to be true mobility, there must be complete and seamless functionality across any and all devices at the same time. These mobile devices keep the technician digitally tethered to operations by providing real-time access to dataincluding updated schedules, recommended travel routes, and key customer information. With the right technology and devices, offline mobile capabilities provide frontline workers what they need when they need it, even in the most remote locations.
On a mobile device (phone, tablet, or laptop), technicians can access knowledge articles, work orders, and task lists from anywhere. They can also add notes and images, which sync to the back office. If a problem is outside of his or her expertise, the technician can leverage videos and product guides, and even consult with experts by connecting with Microsoft Teams or via mixed reality tools like Microsoft Dynamics 365 Remote Assist and HoloLens 2.
About 75 percent of field service businesses that utilize mobility tools have observed increased employee productivity, while the rest have seen customer satisfaction rates rise.1
True mobility transforms the customer into a knowledgeable partner and enhances the customer experience with transparency into all facets of service delivery. Information is available for customers in real-time using an easy-to-use portal to navigate the service history and on-demand appointment scheduling. Customers can even track and trace the route of the technician enroute on any mobile device.
Connecting people, places, and things to consistently deliver customer-centric experiences is at the core of Dynamics 365 Field Service and is the foundation in transforming service delivery. And within this transformation is the art of true mobility through the Dynamics 365 Field Service mobile app.
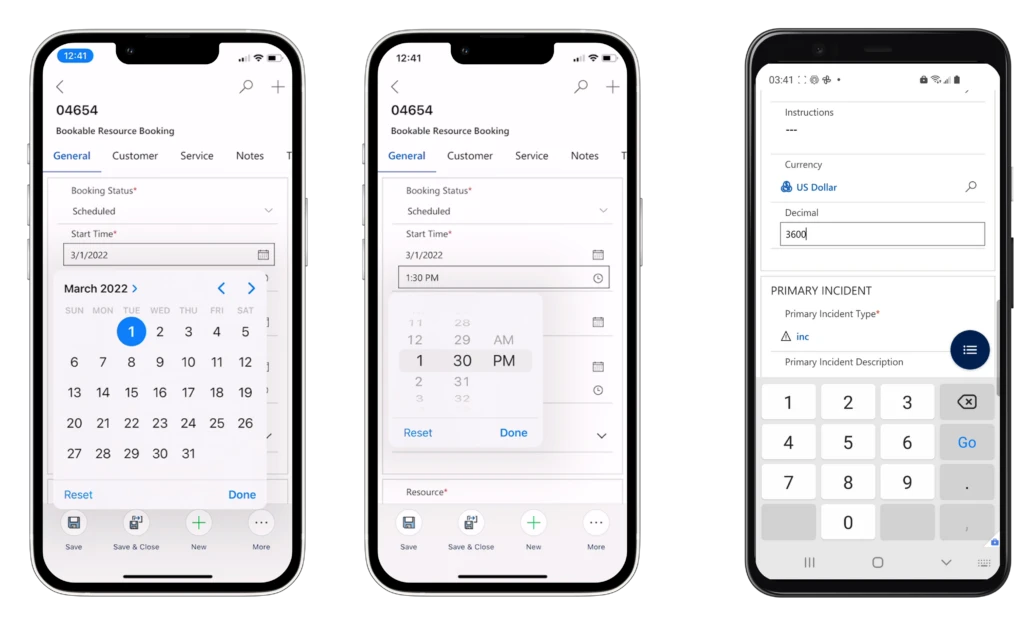
With the 2022 release wave 1, we have made notable enhancements in the Field Service mobile app. First, we improved how frontline workers perform actions, view, and update data to increase productivity and usability. These usability enhancements include:
- Date and time input fields will leverage default input controls provided by the device operating system.
- Mobile optimized device keyboards will be shown when interacting with numeric, phone, email, and URL input fields.
- Large format devices (such as tablets and PCs) will have a streamlined agenda view available as part of their booking calendar.
- Customers’ primary account phone numbers will be accessible directly on the Bookable Resource Booking Customer tab.
In addition to usability enhancements, we have continued to invest in core functional and performance improvements such as:
- Offline sync notifications to alert users when the offline-enabled application is downloading data from the cloud. This will provide clarity on the app status and feedback to the user when data is refreshing.
- Offline Profile (Preview)configuration that will be available in the modern app designer and offer an improved experience to makers. The new offline profile can be assigned to an app module, removing the need to manually add users to the offline profile. This will greatly simplify app user management for makers and admins.
Mobility on every device
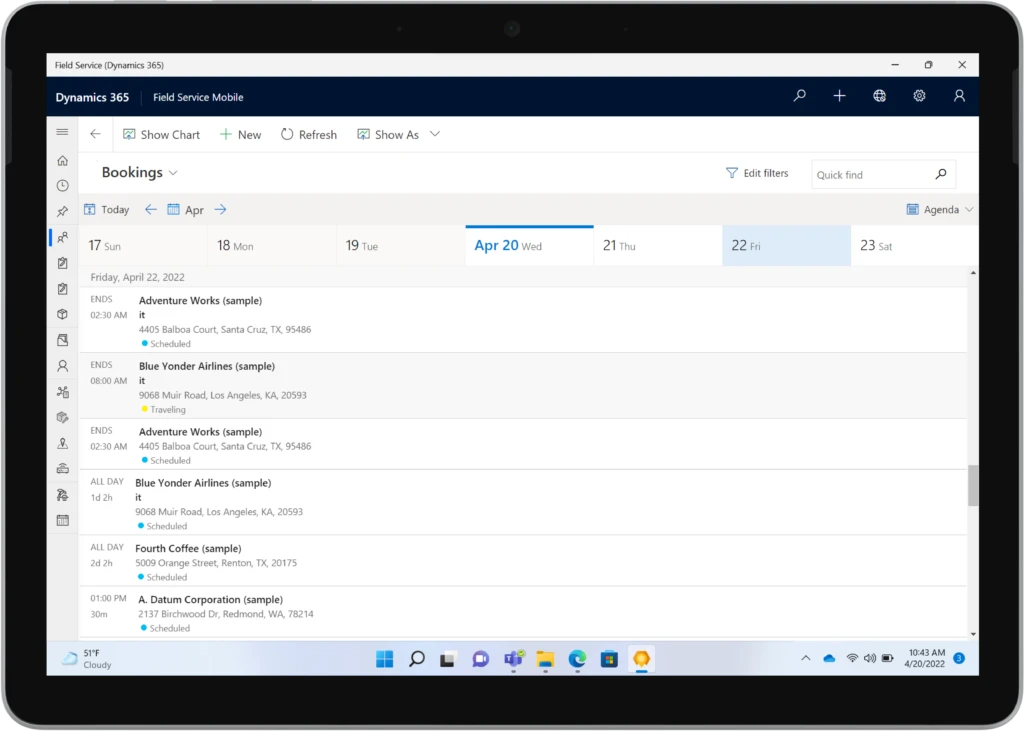
Not every frontline worker wants to perform work using their mobile device or carry multiple devices from location to location. For frontline workers that prefer working on a single tablet or laptop, or are required to use a PC for their business needs, we are pleased to announce the general availability of the Windows Dynamics 365 Field Service app. Technicians can do all of their work tasks on the same Windows device, such as a Microsoft Surface Go, without having to carry multiple devices. Technicians will be able to fulfill end-to-end scenarios without losing context or switching devices. They can view their bookings, manage their work orders, and perform inspections with this rich application that is deeply integrated with the rest of their Dynamics 365 applications.
The Field Service mobile app is now available on Windows laptops to enable seamless mobility across all devices.
This Windows Field Service app includes:
- Offline support to keep the frontline worker productive even without internet access. While using the app offline, data is stored in the local device database and uploaded to the server when network access is restored.
- Outlook-style calendar for bookings, with intuitive user interface which gives the frontline worker visibility into active and upcoming workincluding key information like scheduled times, duration, customer name, and address as well as the type of work to be done. The calendar can be further extended to include additional fields giving at-a-glance information a frontline worker needs to prepare for their day, such as assets they may be working on or the customer contact’s name.
- Tailored user experiences available with Power Apps component framework with hundreds of powerful controls out of the box.
- Access to device camera to take pictures and scan barcodes.
- Deep-link support into the Dynamics 365 Field Service mobile app.
Improve customer experiences with Dynamics 365 Field Service
The focus of this release was to further extend customer and worker mobility while acknowledging different work requirements and work styles. These enhancements come together to create a seamless workflow by enhancing the tools that increase productivity and optimize system operations. Our goal is to develop features to overcome barriers frontline workers experience every day when delivering superior serviceon or offsite. We will continue to laser focus on the customer experience by arming technicians with the right technology at the right time to do their job better, faster, and more efficiently.
For more on this release, visit our Dynamics 365 Field Service documentation.
Learn more by visiting the Dynamics 365 Field Service website.
Get started with a free Dynamics 365 Field Service trial.
Download the Field Service app for Windows.
Sources:
The post 2022 release wave 1 brings true mobility to field service management appeared first on Microsoft Dynamics 365 Blog.
Brought to you by Dr. Ware, Microsoft Office 365 Silver Partner, Charleston SC.
.png")


Recent Comments