This article is contributed. See the original author and article here.
Join Microsoft at Hannover Messe 2023 to learn how the latest enhancements to Microsoft Teams help frontline workers streamline communication and increase productivity.
This article is contributed. See the original author and article here.
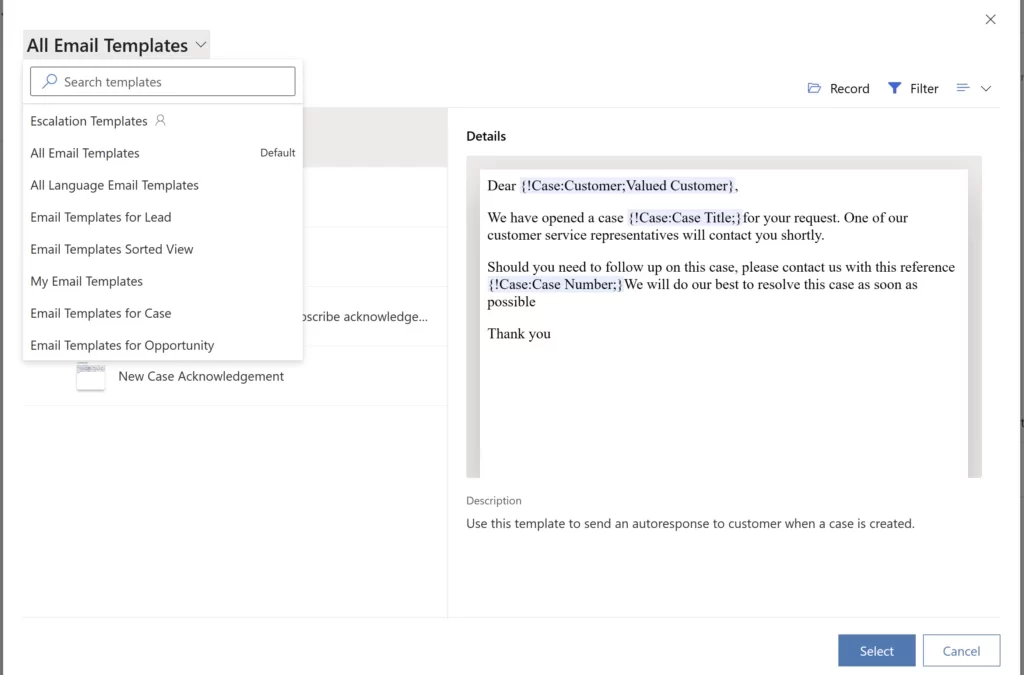
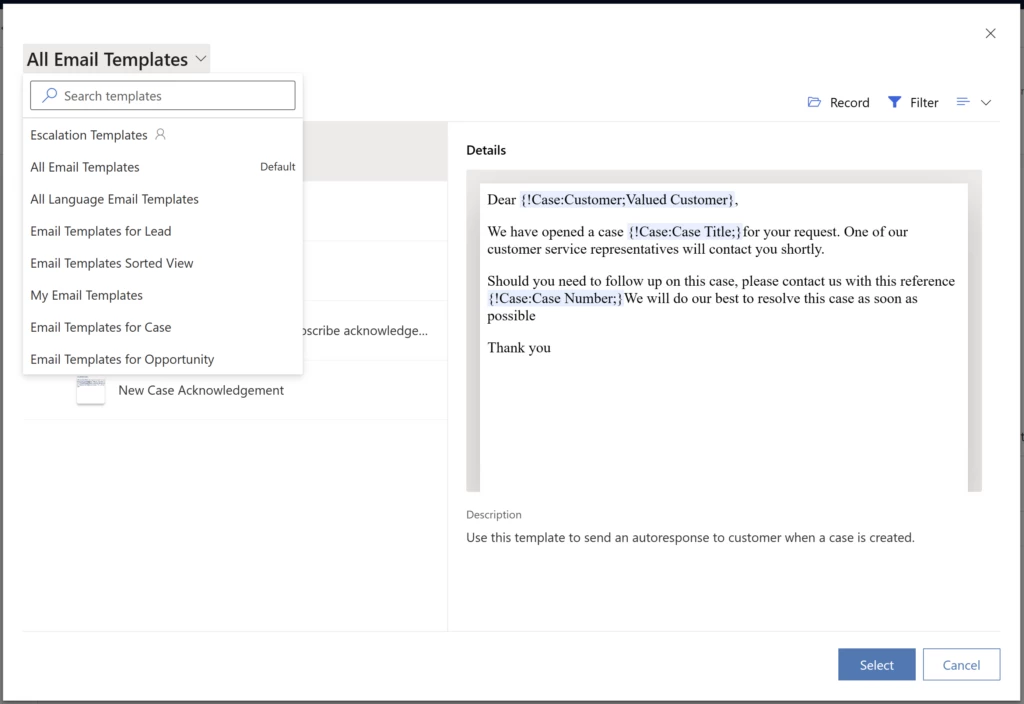
If you are a customer service agent, you know how important it is to respond to your customers quickly and effectively. You also know how frustrating it can be to waste time searching for the right email template to use for each situation. That is why you need to use email template views while selecting an email template.
We have upgraded enhanced email template selection to help agents efficiently use email templates. With integrated record selection and email template views, finding the right email template is easier than before.
With email template views, just create a view with your choice of filters and then have it available when selecting the templates. Creating a view with your favorite or most used templates will help save a lot of time when working with emails.
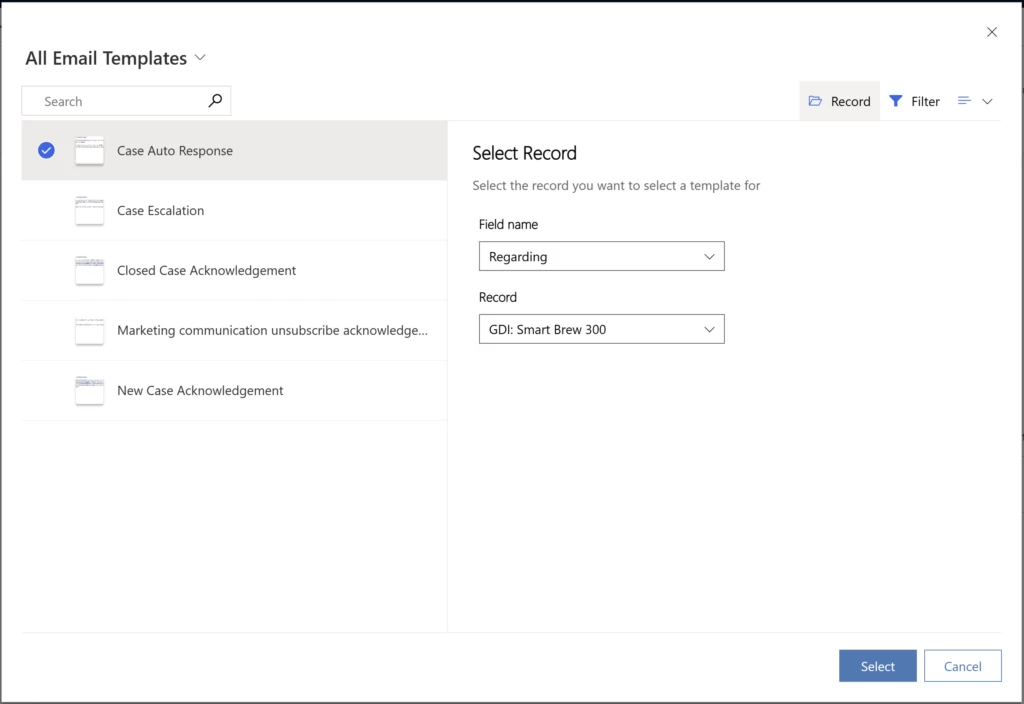
In Customer Service workspace and Customer Service Hub, the enhanced template dialog is enabled by default. Administrators can disable the enhanced email template selection option if they want to display the default email selection dialog. When using enhanced email template selection, admins can determine whether to show the record selection within the email template selection window. This saves the agent extra clicks when selecting a template. Regarding is selected by default and can be easily changed by navigating to the record tab. The list of templates will automatically get refreshed when Record is changed.
In short, when agents use email template views, they can use preconfigured views to find the right templates quickly, switch between views of templates that have persisting filters, and save time with the integrated record selection in the template selection dialog box.
This article is contributed. See the original author and article here.
As a result of the March 1st order from the Government of Egypt, Daylight Saving Time (DST) in the Arab Republic of Egypt will resume from the last Friday of April. Hence, clocks will be set forward by an hour at 12:00 AM on April 28, 2023.
The April 2023 Monthly quality update for Windows includes the following time zone update for Egypt:
Clocks will be set forward by an hour at 12:00 a.m. on April 28, 2023, for the Egypt time zone.
Here are the KB article numbers that contain the Egypt DST fix for different versions of Windows:
This article is contributed. See the original author and article here.
This week at the HIMSS Global Health Conference and Exhibition (HIMSS23), we’re thrilled to be showcasing tailored frontline solutions designed to transform patient care with virtual visits, empower care team collaboration, streamline the clinician experience, and strengthen security and compliance.
This article is contributed. See the original author and article here.
You asked for it and we’re delivering: With 2023 release wave 1, Microsoft Dynamics 365 Business Central will expand the non-deductible value-added tax (VAT) feature to our customers worldwide. It’s required by almost all countries where VAT is used and was previously available only to our customers in Belgium, Italy, and Norway. We’re excited to make it available everywhere our Business Central customers are.
VAT is a tax that businesses must pay when they buy things. They can usually recover the tax by buying goods and services relating to their business activities. However, there are some situations in which a business incurs VAT that can’t be recovered and isn’t deductible.
The expanded functionality covers the most common scenarios and can be easily extended if you need more features.
Non-deductible VAT options
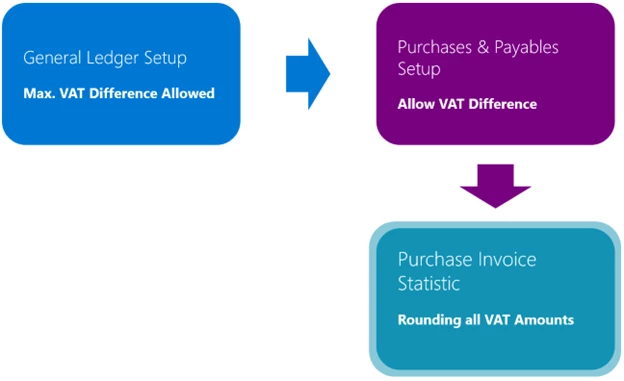
You can use proportional VAT to calculate VAT when you have both deductible and non-deductible VAT. Non-deductible VAT is included in purchase documents only. Depending on your settings, you can use fully or partly non-deductible VAT or a combination with different deductible percentages per line. You can use it configured as Normal VAT, Full VAT, and Reverse Charge VAT with or without deferrals. Before posting the purchase document, you can adjust the VAT amounts if VAT rounding in the external system and Business Central differ.
Workflow for VAT Amounts rounding
Reporting non-deductible VAT
After posting, the VAT Entry table shows separate details for deductible and non-deductible amounts and bases. When it’s time to report VAT amounts to your authorities, the Amount Type column in the VAT Statements view offers options for non-deductible and full amount or base. The Day Book VAT Entry report features new columns as well. Other reports will be updated in later releases based on our customers’ feedback.
Setting up to use non-deductible VAT
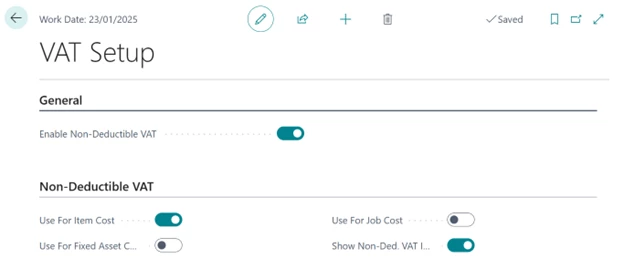
Non-deductible VAT is included in the base application but isn’t enabled by default. To use this feature, you must enable it on the VAT Setup page.
VAT Setup page
After enabling the feature, configure VAT posting group combinations for use as non-deductible VAT. Enable them and add a percentage for deduction.
If needed, you can fine-tune the settings for better results. You can choose to configure the impact of non-deductible VAT on the item cost, fixed asset acquisition cost, or job cost. You can also configure how to treat non-deductible amounts. If you want these amounts to be posted only in General Ledger entries but use them as an additional cost in purchase, you can add it in the setup.
We added all the non-deductible VAT logic and events to the Non-Deductible VAT Management codeunit. If you need to get the non-deductible VAT percentage not just from the VAT posting setup, use the OnBeforeGetNonDeductibleVATPctForPurchLine integration event and return the Non-Deductible VAT % based on the purchase line.
Deprecating existing functionalities
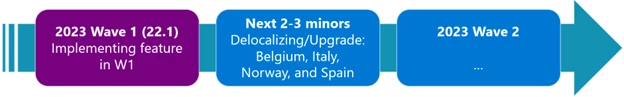
As part of expanding the non-deductible VAT feature worldwide, we’re deprecating the specific solutions for Belgium, Italy, and Norway starting with Business Central 2023 release wave 2 (version 23). You’ll have three releases after version 23 to adjust your extensions to the W1 solution.
Non-deductible VAT will be available in May with 2023 release wave 2 for all countries/regions using the W1 base app and all countries/regions using local base apps other than Belgium, Italy, Norway, and Spain.
Roadmap for activating non-deductible VAT feature
Next steps
If you see some obstacles in this process, please get in touch with us. The best channel for communication is our Yammer group for partners, https://aka.ms/BCYammer (requires partner credentials to log in).
To learn more, watch the on-demand session “What’s new: Non-deductible and partly deductible VAT” at the latest Business Central launch event. Register and watch here: https://aka.ms/BCLE.
This article is contributed. See the original author and article here.
Today, I worked on a service request that our customer is trying to change ALLOW_SNAPSHOT_ISOLATION to OFF, during this process we found that this process is taking too much time and I would like to share my lesson learned here.
Based on the documentation that we have sys.dm_db_wait_stats (Azure SQL Database) – SQL Server | Microsoft Learn , DISABLE_VERSIONING “Occurs when SQL Server polls the version transaction manager to see whether the timestamp of the earliest active transaction is later than the timestamp of when the state started changing. If this is this case, all the snapshot transactions that were started before the ALTER DATABASE statement was run have finished. This wait state is used when SQL Server disables versioning by using the ALTER DATABASE statement.”
So, I understand that if I have a previous transaction open before running the alter database [jmjuradotestdb2] SET ALLOW_SNAPSHOT_ISOLATION off even if the transaction is ocurring in another database in the same Elastic Pool.
In order to reproduce the issue, let’s try to run a transaction but without closing it in the database jmjuradotestdb1.
begin transaction
create table table1 (id int)
insert into table1 (id) values (1)
In another session, we are going from master to execute the following query to change to off the snapshot.
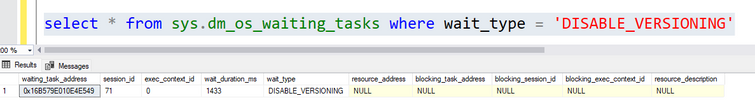
alter database [jmjuradotestdb2] SET ALLOW_SNAPSHOT_ISOLATION off
Once, I executed the second query, I started seeing running the query select * from sys.dm_os_waiting_tasks where wait_type = ‘DISABLE_VERSIONING’
This article is contributed. See the original author and article here.
The connections established to Azure SQL Database from applications or client tools may be unexpectedly terminated and impact user environments due to internal (System) maintenance work, client networking, application related or other health related issues. In this blog post, we will cover recommended steps to identify connection failures to your database and best practices to handle these failures using resources & tools available for Azure SQL Database.
Understanding the connection Problem!
When it comes to understanding a problem, we need to know where the issue is occurring, whether this is happening on the client side, or it is an issue specific to the network layer or on the SQL database itself. Most of the time, the error messages the customer receives will tell exactly where the problem is and that’s the best place to start.
When you have issues related to accessing database, the best place to start with is the Azure Resource heath blade. Resource Health gives you a personalized dashboard of the health of your resources including your SQL Database. Currently, Resource Health for your SQL Database resource examines login failures due to system errors.
The health of a resource is displayed as one of the following statuses.
A status of Available (informational) means that Resource Health has not detected login failures due to system errors on your SQL resource.
This is an informational message. It doesn’t indicate a problem but provides interesting information to an operator, such as successful completion of a regular process.
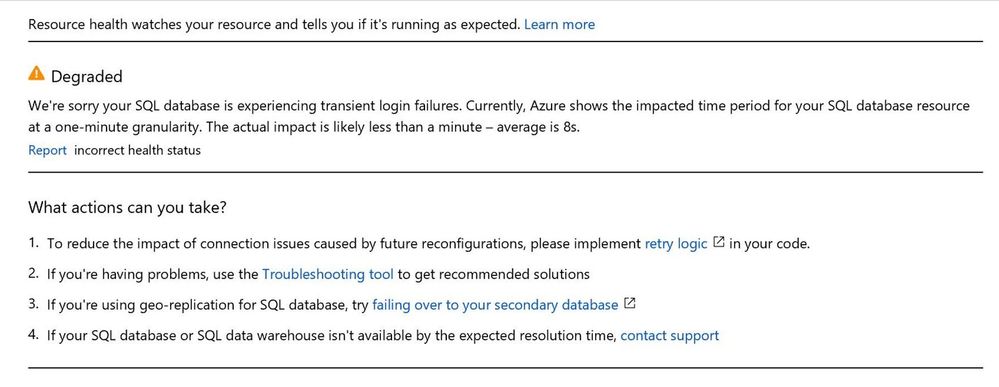
A status of Degraded (warning) means that Resource Health has detected many successful logins, but some failures as well. These are most likely transient login errors.
The health status of Unknown (warning) indicates that Resource Health hasn’t received information about this resource for more than 10 minutes. Although this status isn’t a definitive indication of the state of the resource, it is an important data point in the troubleshooting process. If the resource is running as expected, the status of the resource will change to Available after a few minutes. If you’re experiencing problems with the resource, the Unknown health status might suggest that an event in the platform is affecting the resource.
Degraded and Unknown status are warnings and should be ignored if availability is not impacted for customers.
A status of Unavailable (Critical) means that Resource Health has detected consistent login failures to your SQL resource. If your resource remains in this state for an extended period, contact support.
This is a critical message indicating loss of service or application availability or severe degradation of performance. Requires immediate attention.
Below image is an example of what you see if the database is reported as degraded in the Resource health blade.
SQL Connectivity Issues
Looking at the SQL side of connectivity issues, we often see customers not able to reach their database because of an availability issue.
This situation manifests itself in the form of the following error message.
Database x on server y is not currently available (Error 40613)
Most of the time, these issues are transient, meaning the underlying cause soon resolves itself. An occasional cause of transient errors is when there are unexpected events, such as software crash or a hardware failure that might cause failover or if the Azure system quickly shifts hardware resources to better load-balance various workloads. Most of these reconfiguration events finish in less than 60 seconds. During this reconfiguration time span, you might have issues with connecting to your Azure SQL Database.
Other common causes include planned maintenance to deploy software upgrades and other system enhancements. This usually occurs fewer than two times a month. One can enable Advance Notifications (preview) to be sent up to 24 hours before any planned event.
Applications that connect to your database should be built to expect these transient errors. To handle them, implement Retry Logic in the code instead of surfacing them to users as application errors.
In some situations, the customer uses the retry logic, but still sees the error messages. The reason is that they do not follow the principles of retry.
Principles for retry
SQL SELECT statement should be retried after a fresh connection has been established.
Logic must ensure that either the entire database transaction completed, or rolled back
Applications using 3rd party middleware – confirm that the retry logic is enabled by vendor.
Minimum 5 secs interval between retries. *
* When connection pooling is enabled, and if a timeout error or other login error occurs, an exception will be thrown and subsequent connection attempts will fail for the next five seconds, the “blocking period”. If the application attempts to connect within the blocking period, the first exception will be thrown again. Subsequent failures after a blocking period ends will result in a new blocking period that is twice as long as the previous blocking period, up to a maximum of one minute.
Sometimes the transient issues can also become non transient where we lose connections for a few minutes or a few hours.
For example: A plannedunplanned event interrupted a long running transaction (such as large bulk insert operations or index build operations against a large table). The chances are it takes longer time for performing the recovery operations. The longer the recovery operation, the longer the availability issue the customer is going to face. Connectivity can only resume after the recovery is completed.
Another scenario, which customers experience is resource limit being reached, where the request hits the threshold limit assigned for the service tier.
This is usually seen in the DTU based service tiers where Azure SQL Database limits the number of concurrent sessions to the database and one has an increased workload.
We can monitor the session count using Azure Metrics as shown below
If your application uses connection pooling, a slowdown in query response time might cause a constant rate of front-end requests to require more back-end database connections. If a live incident is ongoing where the worker limit has been approached or reached, you may receive Error 10928 when you connect using SQL Server Management Studio (SSMS) or Azure Data Studio. One session can connect using the Diagnostic Connection for Database Administrators (DAC) even when the maximum worker threshold has been reached.
DAC was built to help you connect and run basic troubleshooting queries in cases of serious performance problems. It allows us to connect to the database despite the limit has been reached.
Note: Only one Dedicated admin connection is available for us to log in and check the database.
You should not try connecting to DAC using the object browser in SSMS because it creates multiple connections for getting the graphical view of an instance.
In the SSMS, go to File -> New -> Database Engine Query and try specifying the DAC connection.
Prefix server name with ADMIN: as shown below
Click on Options -> Connection Properties and specify the database that you are connecting to.
Click on connect, and you can connect to Azure SQL DB with a DAC connection. In the connection bar, you can see, we are connected to Azure SQL Server using Admin: prefix, i.e. DAC connection. Now you can run dmv’s for any diagnostic information.
To remediate from this issue,
One can scale the database to a larger service tier that can handle the workload. Switch to an elastic pool or vCore-based purchasing models, which removes the session limit (increasing it to 30000)
Another issue that we observe is Dropped connections to Azure SQL database:
When you connect to an Azure SQL Database, idle connections may be terminated by a network component (such as a firewall) after a period of inactivity. There are two types of idle connections, in this context:
Idle at the TCP layer, where connections can be dropped by any number of network devices.
Idle by the Azure SQL Gateway, where TCP keepalive messages might be occurring (which makes the connection not idle from a TCP perspective), but not had an active query in 30 minutes. In this scenario, the Gateway will determine that the TDS connection is idle at 30 minutes and terminates the connection.
To avoid the Gateway terminating idle connections, you can use the Redirectconnection policy instead of proxy to configure your Azure SQL data source.
Note: The recommendation is to use redirect connection policy for improved performance.
To avoid dropping idle connections by a network component, set the following registry settings or their non-Windows equivalents on the operating system where the driver is loaded:
Restart the computer for the registry settings to take effect.
Also have the latest client drivers ( JDBC, OLEDB and so on ) installed.
We also see communication link failures on the network side. It usually manifests like the errors below.
A connection was successfully established with the server, but then an error occurred during the login process. (provider: SSL Provider, error: 0 – An existing connection was forcibly closed by the remote host.)
A connection was successfully established with the server, but then an error occurred during the pre-login handshake. (provider: TCP Provider, error: 0 – An existing connection was forcibly closed by the remote host.)
We get this situation when customers are not using the updated drivers. The recommendation for this situation is to have the updated driver, Which would support the TLS 1.2 version that’s just default for the SQL database.
We do also have an option for customers to use the lower version of TLS, but it is not recommended. We always recommend to use the updated version of the driver.
We also see this error if your administrator restricted certain algorithms on the client. The TLS protocols match between the client and the server but there are no matching TLS cipher suits.
Another common issue that we see is customers getting confused between a connection timeout and query timeout. The connection or login timeout occurs when the initial connection to the database server reaches a predefined time-out period. At this stage, no query has been submitted to the server. Understanding the error messages and exceptions in this case, checking the class, if it is a SQL connection class or it’s a SQL command class would tell us whether this is a performance related issues or a connection timeout issue and then take necessary steps onward.
In the below screenshot, we can observe the difference in error messages between a connection timeout vs query timeout.
For troubleshooting query timeouts in Azure SQL Database, refer to the links below.
The checker is a PowerShell script that automates a series of checks for the most common connectivity issues. It performs an end-to-end connection check. It checks for your certificates, gateway connections and then connects to your master database, user databases and then also performs pre-login checks and in addition, it also allows us to capture the network trace for it. This gives us a clear idea of where the connection is failing and if I’m not sure what to do, I can do the network capture and give it to the support team to handle this efficiently.
Most issues it detects come with recommended solutions. Instructions to run the script can be found in the above link.
This article is contributed. See the original author and article here.
In this post, we’ll dive into the impressive results at Mural, and share four ways other ISVs can attract customers, win more deals, and scale business on Microsoft Teams.
Microsoft Graph APIs have improved consistently over the years.
In 2021, one highly demanded feature, Application Only or granular access to individual site instead of whole tenant, was implemented, this scope is called “Sites.Selected”.
Initially, for this scope, there are two permission levels that can assigned to the Applications, “read” and “write.”
Some customers found there are management tasks cannot be executed with even “write” permission level. To address that, “fullcontrol” and “manage” permission level was added this year.
Here are the steps to implement App Only Sites.Selected permissions:
Step I, Register AAD Application in Azure Portal, https://portal.azure.com, and let’s call this Application “Target Application”.
Once you registered the Target Application, copy below information to a text file: Display name: Contoso Time Manager App Client Id: d806f38b-a107****-1ec8e90c8ccc Client Secret: XZW8Q*****855JDEw1cxP Directory(tenant) ID: 31********95c59c1b
POST https://graph.microsoft.com/v1.0/sites/{sitesId}/permissions
Content-Type: application/json{
 "roles": ["write"],
 "grantedToIdentities": [{
    "application": {
      "id": "89ea5c94-7736-4e25-95ad-3fa95f62b66e",  //Target Application’s Client Id
      "displayName": "Contoso Time Manager App"       //Target Application’s Display name
    }
  }]
}
The import thing is, to do that, you need to have another Application which has Sites.FullControl.All permission for Graph API, then you get an App Only AccessToken with this Application’s identity and you can make above call with Authorization Header, the value is “Bearer {tokenvalue}”.
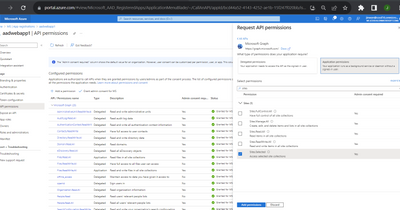
Below is Fiddler Trace of the Graph API call to assign permission for the target Application:
POST https://graph.microsoft.com/v1.0/sites/fb1e20f2-56fc-4eb7-ae1d-a97804d224e2/permissions HTTP/1.1
Authorization: Bearer eyJ0eXAiOiJKV8CJY2R……………qtlW1WoBXu3fdR8G7R-
Accept: application/json
User-Agent: NONISV|SharePointPnP|PnPCore/1.11.2.0 (Microsoft Windows NT 10.0.22621.0)
Content-Type: application/json
Host: graph.microsoft.com
Content-Length: 132

{"roles":["write"],"grantedToIdentities":[{"application":{"id":"ea5f05ef-2a5c-418b-b679-0380b3e83fd3","displayName":"aadAppOnly"}}]}
Now, your Target Application has been given the permission to the specific site successfully!
If you have chosen Graph API Sites.Selected Application permission, you can use Graph API to access the site.
If you have chosen SharePoint Sites.Selected Application permission, you can use SharePoint Rest API or CSOM to access the site.
NOTE, For SharePoint APIs, you cannot use just client secret to do the authentication, you have to setup certificate to gain Access Token.
#AAD AppOnly for Graph API
$tenantId="{tenantId}"
$aadClientId = "{clientId}"
$aadClientSecret = "{clientSecret}"

$scopes =  "https://graph.microsoft.com/.default"
$loginURL = "https://login.microsoftonline.com/$tenantId/oauth2/v2.0/token"
$body = @{grant_type="client_credentials";client_id=$aadClientId;client_secret=$aadClientSecret;scope=$scopes}

$Token = Invoke-RestMethod -Method Post -Uri $loginURL -Body $body
$Token.access_token  #expires after one hour
$headerParams  = @{'Authorization'="$($Token.token_type) $($Token.access_token)"}
$headerParams

#Graph API call to get site
Invoke-WebRequest -Method Get -Headers $headerParams -Uri "https://graph.microsoft.com/v1.0/sites/contoso.sharepoint.com:/sites/demo"
Response:
If you try to access another site that permission has not been given to, you will get error (403) Forbidden.:
B. SharePoint API Access:
To make App only SPO REST and CSOM calls, you will need to generate certificates and upload the public key (.cer file) to Azure – App Registration – App – Certificates & secrets:
This article is contributed. See the original author and article here.
Microsoft aims to make mixed reality accessible and intuitive for frontline workers everywhere. With Dynamics 365 Guides, deskless workers use step-by-step holographic instructions to ensure process compliance, improve efficiency, and learn on the job.
In 2022 Teams capabilities were integrated into Guides, allowing users to collaborate with anyone anywhere in the world seamlessly. This enabled calling through the HoloLens 2 – allowing the remote participant (or participants, if on a group call) to “see-what-I-see” through the HoloLens user’s eyes. They can see what is happening in real-time, annotate in their colleagues’ 3-dimensional space, and share relevant files easily.
We’ve just released another set of features in Guides to make this new experience even more intuitive and reliable.
Draw anywhere with better annotations!
Imagine being able to point anywhere in your plant or facility and draw on any object, any surface, or anywhere in space to instantly show someone not only where to look but also how a physical object might look in that space. The possibilities for this feature don’t stop there.
On Dynamics 365 Guides and Remote Assist, an expert (working on a PC or mobile device) can draw in your world in 3D. As the frontline worker wearing the HoloLens, you can also draw on your space in digital ink. Traditionally, the HoloLens user could draw on a flat or semi-flat surface some ways off in the distance. With our recent annotation improvements, the HoloLens user can now draw anywhere in space in 3D. These drawings stick where they are added in the space and remain still. Users can walk around them and view them from different angles. We’ve brought similar improvements to annotating on surfaces so that the ink stays where intended, regardless of whether the user changes location or position. This means that for the HoloLens user, your entire world is now inkable, allowing you to annotate and share in real time.
Mixed Reality Teams calls
With Dynamics 365 Guides, the HoloLens user now has more pre-join settings when joining a Teams call. Before entering the call, the user can opt to toggle on/off video and can choose whether to mute themselves. As before, users can also toggle these settings once they are in the meeting. In spaces where confidentiality is core, this allows the frontline worker to use the HoloLens as their main calling device – without compromising on security.
We’ve also recently added restricted mode features, which enable your admin to restrict who can log on to the device and make calls, further driving our efforts to help you keep your company and your information secure.
Linking to Guides from within a Guide
Navigating through the steps of a guide is as intuitive as paging through a document or scrolling through a file, but what about links to jump from one file to another? We’ve added the ability to link directly from one guide to another by linking the new guide in an action step. This makes navigating between different sets of training materials or guides as easy as jumping to a new web page from a hyperlink. Learn the details of all our recent additions in Guides release notes.
What’s Next?
Stay tuned for more updates coming soon as we continue to build on the intuitive and frontline worker-focused features for Dynamics 365 Guides!


Recent Comments