This article is contributed. See the original author and article here.
Overview
There are many reasons that may cause timeouts on Redis client side, due to client, network or server side causes, and the error message also may differ based on Client library used.
Timeouts in Azure Cache for Redis occurs on client side when client application cannot receive the response from Redis server side timely.
Anytime, when client application doesn’t receive response before one of the timeout value expire, a timeout will occur and will be logged on client application logs as Redis timeout error message.
There are some causes on Azure Cache for Redis server or on the VM hosting it, that can also cause Redis timeouts on client side. If the cause of the delay is on Server side, the client application will not receive the response from Redis server timely and a timeout may happen.
Order by most common issues, below are the most common Server side causes:
1- Server Update / Patch
2- Long Running Commands
3- Server High CPU Load
4- Server High Memory Usage
5- Redis Server Bandwidth Limit Exceeded
For Client or Network side Redis timeout causes, please see these Tech Community articles:
Azure Redis Timeouts – Client Side Issues
Azure Redis Timeouts – Network Issues
| 1- Server Update / Patch |
When any Redis Server update occurs, some Redis timeouts may happen on client side.
This is expected and by design as described below.
Standard/Premium Tiers of Azure Cache for Redis are made up of two Redis nodes. Each node running a single Redis server process and having a dedicated VM.
One instance is the “primary” node and other is the “replica” node. The primary node replicates data to the replica node more or less continuously.
If the primary node goes down unexpectedly, the replica will promote itself to primary, typically within 10-15 seconds. When the old primary node comes back up, it will become a replica and replicate data from the current primary node.
In the case of any update/patch, replica is proactively promoted to primary and the client should be able to immediately reconnect without any significant delay.
Basic tier cache has only one node, with no replica to take over during patching, so during update/patch the Basic tier Redis instances will go down and not be accessible during the patching process.
This is one of the reasons why Basic caches are good for test/development environments but not recommended for production.
Redis updates:
On Azure Redis service, there are three types of updates:
- Redis updates/patches applied to the binaries used by Redis service;
- Host updates/patches applied to each Redis node VM. The VM reboots after any Host update;
- Host OS updates/patches applied to operating system used by each Redis node VM. The VM reboots after any Host OS update.
If Azure Redis is in a Standard or Premium Tier, Redis Updates/patches, Host OS or Guest OS updates should not have any impact on the Redis availability.
Failover:
Every time a Redis Updates/patches occur an Redis failover is initiated.
When the failover occurs, the current connections on the primary node will be broken and will timeout on client application side – this is expected.
The number of errors seen by the client application depends on how many operations were pending on that connection at the time of the failover.
Any connection that’s routed through the node that closed its connections will see errors.
Many client libraries can throw different types of errors when connections break, including time-out exceptions, connection exceptions, or socket exceptions.
All the process is described in this documentation: How does a failover affect my client application?
How to verify Server Updates or Patch, from client side:
Currently there are no way to verify Redis, Host or Host OS updates/patches on client side or on Azure Portal. This is something currently in roadmap.
How to mitigate Server Updates or Patch:
As per Microsoft best practices, the application should retry to reconnect and when the retry happen, will reconnect to the new primary node without any impact on the service or to the end users.
Stackexchange.Redis:
Stackexchange.Redis have retry policy configured by default. With that some timeouts may be seen on client side, but with client retry policy, Redis service should be always available.
StackExchange.Redis client library has a setting named AbortConnect that controls how it handles connectivity errors like this. The default value for this setting is “True”, meaning that it will not reconnect automatically in some cases. Microsoft recommendation is to set AbortConnect to false, to let the ConnectionMultiplexer reconnect automatically.
Scheduling Redis updates:
Currently there’s feature available to allows schedule Redis updates. However, it does not cover platform updates (host or host OS updates), which happen much more often.
So at the moment, it’s not possible to specify the update time for all types of updates.
Please see this documentation showing how to Schedule updates
| 2- Long Running Commands |
Some commands are more expensive than others to execute, depending on their complexity.
Because Redis is a single-threaded server side system, the time needed to run some more time expensive commands may cause some latency or timeouts on client side, as server can be busy dealing with these expensive commands.
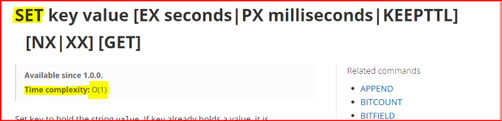
Based on Redis.io documentation there are some well-known commands with higher time complexity, as described on top of each command description, on Redis.io page.
Time complexities:
O(1) – the command will be applied to only one specific key.
O(N) – with N being the number of keys in the database – this means the command will be applied to (or will read) each one of keys in the database – these commands should be avoided to use. When that is not possible, these type of commands should be used carefully.
These types of complex commands should be avoided, as described here:
Also, Eval commands used to run LUA scripts on Redis side may need some time to finish.
Because Redis command processing is single-threaded, a command that takes time to run will block all others that come after.
How to verify Long Running Commands, from client side:
Redis-cli command line console can be used to run the SlowLog command, to measure expensive commands being executed against the server. This command is used to read or reset the Redis slow queries log, and the output is shown in microseconds. More information about SlowLog command: https://redis.io/commands/slowlog
Also, “Max CPU” and “Server Load” metrics on Azure Portal can be used to see how much server-side bandwidth is being used, usually corelated to long-running commands:

For that, Max aggregation should be used on the chart.
“Max CPU” and “Server Load” metrics are available to the Redis instance or per shard, in case of Redis clustered instances. On that case you may need to investigate each shard “Max CPU” and “Server Load” usage to be able to identify any overload specifically in some shard.
How to mitigate Long Running Commands running:
To avoid having long running commands, time complex commands should be avoided and replaced by O(1) time complexity commands.
For instance, the KEYS command is often used without knowing that it’s an O(N) operation. Avoid KEYS can be done doing some more requests using SCAN O(1) to reduce CPU spikes.
Also, complex scripts should be reviewed to understand their performance impacts, and replaced by simple scripts. Having many simple scripts are preferable as having only few complex scripts.
| 3- Server High CPU Load |
High server load or CPU usage means the server can’t process requests in time. The server may be slow to respond and unable to keep up with request rates.
When server takes more time to respond as expected, this not means forcibly an issue on Server performance. Specially on Standard and Premium Redis tiers, Redis service have a dedicated VM with full resources available to Redis service, on each Redis node: primary and replica.
If something wrong is detected on primary node, failover happen and the replica node can be promoted to new primary and take care of all work requested by client application.
Usually, server taking more time to respond than the expected are caused by client application requesting long-running commands or scripts, using large key values or using a cache size tier lower than the needed to deal with all the work requested by client application.
Also, high memory pressure can cause high number of page faults, and managing page faults can cause high CPU usage on Server side. Please see below on topic 4 how to investigate high memory pressure on Server side.
How to verify High Server CPU usage, from client side:
The “CPU” or “Server Load” metrics on Azure Portal can be used to find CPU usage and Server load.

For that, Max aggregation should be used on the chart.
“CPU” or “Server Load” metrics are available to the Redis instance or per shard, in case of Redis clustered instances. On that case you may need to investigate each shard individually to identify high “CPU” or “Server Load” in some specific shard.
How to mitigate High Server CPU usage:
There are several changes you may make to mitigate high server load:
- Investigate long running commands used as described above on topic 2.
- Scale to a larger cache size with more CPU capacity.
- Create alerts on metrics like CPU or server load to be notified early about potential impacts.
| 4- Server High Memory Usage |
Memory pressure on the server side may cause some kinds of performance issues that can delay processing of requests, and when memory pressure occurs, the system may page data to disk.
This page faulting causes the system to slow down significantly.
There are some possible causes of this memory pressure:
- The cache is filled with data near its maximum capacity.
- Redis is seeing high memory fragmentation. This fragmentation is most often caused by storing large objects, since Redis is optimized for small objects.
How to verify High Server Memory usage, from client side:
- The “used_memory” and “used_memory_rss” metrics on Azure Portal can be used to see how much memory is being used:

For that, Max aggregation should be used on the chart.
- Any Redis console can be used to run Info command. This command may be used to identify memory usage looking for “Used Memory” and “Used Memory RSS“ section in the command output. Please see more about using Info command.
How to mitigate High Server Memory usage:
There are several possible changes to help keep memory usage healthy:
- Configure a memory policy and set expiration time on keys – this policy may not be sufficient if having fragmentation.
- The default eviction policy is volatile-lru – this evict keys by trying to remove the less recently used (LRU) keys first, but only the keys that have an expire set. so, using volatile-lru, set expiration time on keys is highly recommended.
- Configure a maxmemory-reserved and maxfragmentationmemory-reserved value this should be large enough to compensate for memory fragmentation. Microsoft recommendation is to use 5% of the size of the cache (or higher) to each one of these reserved values, when using large key sizes.
For the points above, please see how to Configure Memory Policies. - Review client application logic and split large cached objects into smaller objects.
- Scale to a larger cache size with more memory capacity.
- Create alerts on metrics like used_memory and/or used_memory_rss to be notified early about potential impacts.
| 5- Redis Server Bandwidth Limit Exceeded |
Redis Server Network Bandwidth exceeded and some other network causes for Redis timeouts are explained on this Tech Community article: Azure Redis Timeouts – Network Issues
Conclusion:
Despite having different reasons to have Redis timeouts on connections to Azure Cache for Redis, some different causes on Client, Server or Network side can cause Redis timeouts.
For Client or Network side Redis timeout causes, please see these Tech Community articles:
Azure Redis Timeouts – Client Side Issues
Azure Redis Timeouts – Network Issues
Related documentation:
How to Scale Azure Cache for Redis
Creating Alerts on Azure
1- Server Update / Patch
How does a failover affect my client application?
2- Long Running Commands
3- Server High CPU Load
4- Server High Memory Usage
Eviction policies
Configure Memory Policies
I hope this can be useful !!!
Brought to you by Dr. Ware, Microsoft Office 365 Silver Partner, Charleston SC.

Recent Comments