This article is contributed. See the original author and article here.
Integration with Application Insights
As we have seen in an earlier post, your Logic App is integrated with Application Insights giving you access to all telemetry data in the form of tables in a database. Workflow execution specific logs are available under the traces table.
Select Logs under Monitoring in your Application Insights.
Application Insights provides a query language for extracting, manipulating, and visualizing the data.
Within each Application Insights table, some of the Functions or Logic App event data is in a field named customDimensions. For example, the following query retrieves all traces that have log level set to Error:
traces
| where customDimensions["Category"] == "Host.Triggers.Workflows"
| where customDimensions.LogLevel == "Error"
Alongside a severity level, each event type is assigned an Id and a name. This table shows some notable Event Ids and names associated with the workflow and job activity related events:
Event Id | Event Name | Event description |
50 | JobDebug | Job debug messages |
51 | JobWarning | Job warning messages |
52 | JobError | Job related errors |
53 | JobCritical | Job critical messages |
54 | JobOperation | Job operation messages |
55 | JobHistory | Job history messages |
201 | WorkflowRunStart | Workflow run starts |
202 | WorkflowRunEnd | Workflow run ends |
203 | WorkflowTriggerStart | Workflow trigger starts |
204 | WorkflowTriggerEnd | Workflow trigger ends |
205 | WorkflowActionStart | Workflow action starts |
206 | WorkflowActionEnd | Workflow action ends |
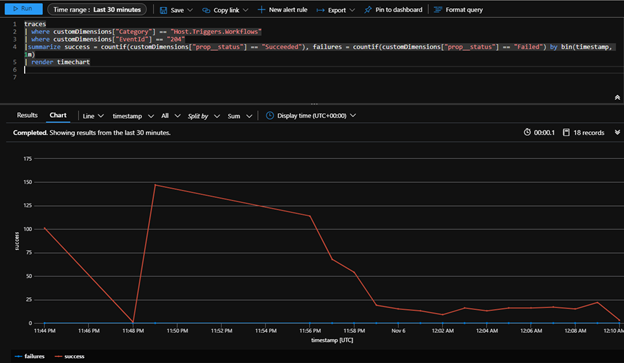
Using the EventName property in customDimensions,
here’s a query example that shows the workflow trigger success rate over time:
traces
| where customDimensions["Category"] == "Host.Triggers.Workflows"
| where customDimensions["EventName"] == "WorkflowTriggerEnd"
|summarize success = countif(customDimensions["prop__status"] == "Succeeded"), failures = countif(customDimensions["prop__status"] == "Failed") by bin(timestamp, 1m)
| render timechart
Tracked Properties
You can use tracked properties to augment the WorkflowActionEnd events with the outputs from the actions. Below example shows how we can set the header content from an http action outputs as a tracked property.

We can then query for this property in the WorkflowActionEnd event as follows:
traces
|where customDimensions["EventName"]=="WorkflowActionEnd"
and customDimensions["prop__flowRunSequenceId"]=="08585933276440232737734257234CU00"
and customDimensions["prop__actionName"]=="HTTP"
|extend prop=customDimensions["prop__properties"]
|project extractjson("$.trackedProperties.trackedProperty.Date", dynamic_to_json(prop), typeof(string))

Application map (preview).
With the recent major update of the portable Logic Apps runtime, we have enabled Application Insights advanced scenarios such as the Application map.
In Application Insights, select Application map under the Investigate section.
Workflow events interacting with external dependencies such as Event Hubs or HTTP endpoints are tracked as dependency operation and the corresponding node is visible in the Application map.
Each Logic App trigger or action being executed is reported as a request operation and mapped as a call in the Application map.
Consider the following workflow with an http trigger followed by various actions such as an outgoing http calls, a compose action, an event sent to Event Hub, and finally a blob written to Azure Storage using a Logic App connector:

The corresponding application map would include the following components, tracking the number of actions executed as well as their external targets:

You can click through from any component to more detailed diagnostics, such as the list of triggers or actions executed, the number of executions or the average duration.
Each action map to an operation executed in Application Insights. Select investigate performance to list all the operations as well as a set of associated metrics:

Live metrics stream.
In Application Insights, select Live metrics Stream under the Investigate section. Sampled log entries are displayed under Sample Telemetry.
Live metrics stream is used to get a near real time overview of the performance and behavior of your Logic App. This includes a holistic view of all the compute environment, such as the CPU and memory usage of each cloud instance as well as the evolution of the number of cloud instances with each autoscaling event.
What’s next?
We continue improving how workflow events integrate with Application Insights and your feedback can be submitted in our Gitub repository.
Brought to you by Dr. Ware, Microsoft Office 365 Silver Partner, Charleston SC.

Recent Comments