This article is contributed. See the original author and article here.
Brad Watts here to talk about a solution that I’ve implemented with several organizations in my role as a CSA. Azure Cost Management is a powerful way to visualize and report on your Azure spend but it doesn’t currently give you the ability to detect when you have cost anomalies. Below we will walk through how to load cost data into Log Analytics to detect anomalies.
This walkthrough uses a template to deploy a complete environment. If you want details on the template or would like a copy of the Azure Function being used, then you can visit App Service Template Repo.
Deploying the Solution
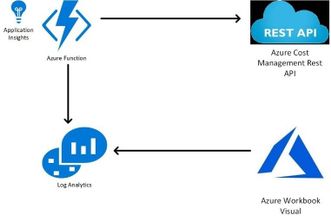
This architecture is made of the following resources:
- Azure Function App with System Managed Identity
- Azure Log Analytics
- Azure Storage Account
The below deployment will deploy these to the resource group that you define in Azure.
The meat of this solution is an Azure Function that makes an API call to the Azure Cost Query API. It then takes those results and ingest them into Log Analytics workspace that is created by the template. The function is scheduled to run each afternoon at 2pm EST.
Note There are two parameters that you need to supply when deploying the solution:
- deploymentPrefix: this will prefix the name of all the resources created.
- scope: this defines the scope or scopes for the Cost Management API.
- ex: subscriptions/5f1c1322-cebc-4ea3-8779-fac7d666e18f
- ex: subscriptions/5f1c1322-cebc-4ea3-8779-fac7d666e18f, subscriptions/718c1322-cebc-4ea3-8779-fac7d666e18f
Use the link below to deploy this solution to your Azure Subscription!
Post Deployment Steps
After deploying this solution, you must give the App Service System Assigned Managed Identity “Read” permissions at the scope or scopes that you are querying. The system assigned managed identity will have the same name as your function app.
If you want to load historical data into Log Analytics you can utilize the function named PreLoadLogAnalytics.
- Get the function url by opening the Function and clicking on Get Function URL. Note that it may take a little bit to light up.
- Use a tool like PostMan or Curl to send the request. Below is an example using curl.
**Note: You could also use the “Code + Test” tab within the function to run it.

Visualizing
Azure Workbooks are a great option to get insights from the data in the csv file. We’ll generate a Workbook that looks for anomalies in the cost per Resource Group. Once imported you will be able to select the Resource Group in the workbook to look at the details on what resources are causing the anomalies.
1) Open Azure Monitor and open the Workbooks tab

2) In the main pain click on “New” at the top:

3) On the top toolbar click on Advanced Editor

4) In the editor past the content of CostWorkbook.json in this repo
https://raw.githubusercontent.com/microsoft/CSACostAnomalies/main/CostWorkbook.json

5) Click on Apply to enter the editing Windows.
- Go ahead and select a Log Analytics Workspace from the drop down. Make sure you select the Log Analytics workspace created by the template.
- Click on the Save button. Give your workbook a name and place it in a resource group. If you want others to be able to see it save it as a Shared workbook.

6) You can now click on Done Editing and start to utilize the workbook.

Alerting
We can now work on setting up alerting on anomalies. In the below example we’ll utilize Logic App to execute once a day and look for any Resource Group that had an anomaly.
Our workflow for alerting will follow this pattern:
- Run on a schedule
- Run Log Analytics Query to see if we have any Resource Groups with an anomaly in the last day.
- If no anomalies, then end Logic App
- If anomaly detected then create a HTML report of the last 7 days for those Resource Groups
- Create a second HTML report showing the cost by resources for more details
- Send both HTML Reports as attachments in an email
Now lets walk through the steps to create the Logic App!
1) Create a new Logic Apps and select “Blank Logic App” Template

2) The Logic App Designer will open with the trigger selection available. Select Recurrence

3) For the Recurrence trigger you’ll want to configure this to run every 1 day and you need to add the Start Time Property

4) Below your trigger click on Add New Step and look for Azure Monitor. You’ll select the Azure Monitor Logs

5) Select the Run Query and Visualize Results action

6) Fill in the Properties:
- Subscription: Subscription where the Log Analytics Workspace is located
- Resource Group: Resource Group where the Log Analytics Workspace is located
- Resource Type: Log Analytics Workspace
- Resource Name: Name of Log Analytics Workspace
- Query:
let ids=AzureCostAnamolies_CL
| extend UsageDateTime = todatetime(Date_s)
| order by UsageDateTime
| where PreTaxCost_d >= 5
| make-series Cost=sum(PreTaxCost_d) on UsageDateTime in range(startofday(ago(90d)), endofday(ago(1d)), 1d) by ResourceGroup
| extend outliers=series_decompose_anomalies(Cost)
| mvexpand outliers, UsageDateTime
| summarize arg_max(todatetime(UsageDateTime), *) by ResourceGroup
| where outliers>=1
| distinct ResourceGroup;
AzureCostAnamolies_CL
| extend UsageDateTime = todatetime(Date_s)
| where ResourceGroup in (ids)
| where UsageDateTime >= ago(7d)
| summarize PreTaxCost=sum(PreTaxCost_d) by ResourceGroup, UsageDateTime
| order by ResourceGroup, UsageDateTime desc
- Time Range: 90d
- Chart Type: HTML Table

7) Click on New Action below the Run Query and Visualize Results. Search for Condition and select Control.

8) In the Control actions choose Condition

9) In the Condition use the following properties:
- Dynamic Field: Attachment Content
- Not Equal to
- PGJvZHk+VGhlIHF1ZXJ5IHlpZWxkZWQgbm8gZGF0YVRhYmxlLjwvYm9keT4=

10) In the If true section click on Add an Action

11) Repeat steps 6-8 but this time use the below query
let ids=AzureCostAnamolies_CL
| extend UsageDateTime = todatetime(Date_s)
| order by UsageDateTime
| where PreTaxCost_d >= 5
| make-series Cost=sum(PreTaxCost_d) on UsageDateTime in range(startofday(ago(90d)), endofday(ago(1d)), 1d) by ResourceGroup
| extend outliers=series_decompose_anomalies(Cost)
| mvexpand outliers, UsageDateTime
| summarize arg_max(todatetime(UsageDateTime), *) by ResourceGroup
| where outliers>=1
| distinct ResourceGroup;
AzureCostAnamolies_CL
| extend UsageDateTime = todatetime(Date_s)
| where ResourceGroup in (ids)
| where UsageDateTime >= ago(7d)
| summarize PreTaxCost=sum(PreTaxCost_d) by ResourceId, UsageDateTime
| order by ResourceId, UsageDateTime desc
12) Add a new action after the last step (but still in the if true section) and search for Outlook. Choose the Office 365 Outlook actions

13) In the actions windows search for Send email and choose Send an email (v2). Note: This action will send an email from your email account. For production you would want to setup a shared mailbox and choose the action Send an email from a shared mailbox (v2)

14) The first time using this connector it asks you to login to Office 365 to make the connection. Once you’ve done this fill in the following properties:
- Body: You can fill in whatever you want for the body. Below is an example of what I entered:
Cost Anomalies were detected for Resource Groups in your environment. Attached are the details on the Resource Groups causing the anomalies and the Resources in those Resource Groups. - Subject: You can fill in whatever you want for the subject. Below is an example of what I entered:
RG Cost Anomalies - To: Whoever you want to receive the emails. This can be a ; delimited list
- Click on Add new Parameter and click the check box next to Attachments. Click back in one of the other fields like To: to make the attachment parameters available.
- Click on Add new Item so that you have two attachments available. Fill in the following for the Attachment Parameters:
- Attachments Content – 1: From the Dynamic Content select the Attachment Content from Run Query and Visualize Results. It should be the second one in the list.

Attachments Content – 1: From the Dynamic Content select the **Attchment Content** from **Run Query and Visualize Results**. It should be the second one in the list.
Attachments Name – 1: RGCost7Days.html
Attachments Content – 2: From the Dynamic Content select the **Attchment Content** from **Run Query and Visualize Results 2**. It should be the first one in the list.
Attachments Name – 2: ResourceIdCost7Days.html
15) Save the Logic App and click on Run. The next time the csv file is updated on the blob this logic app should run and alert if there are any anomalies.

Conclusion
The above solution takes advantage of the Cost Management API along with the anomaly detection algorithms built into Log Analytics to help you quickly discovery cost spikes for dips in your environment. We focused on showing the anomalies based on Resource Group but once the data is in Log Analytics we could group and show anomalies in different ways. For instance, we could show it based on individual resources or resource types. I believe this is a common need for organizations and hopefully this can help some of you fill that requirement!
Disclaimer
The sample scripts are not supported under any Microsoft standard support program or service. The sample scripts are provided AS IS without warranty of any kind. Microsoft further disclaims all implied warranties including, without limitation, any implied warranties of merchantability or of fitness for a particular purpose. The entire risk arising out of the use or performance of the sample scripts and documentation remains with you. In no event shall Microsoft, its authors, or anyone else involved in the creation, production, or delivery of the scripts be liable for any damages whatsoever (including, without limitation, damages for loss of business profits, business interruption, loss of business information, or other pecuniary loss) arising out of the use of or inability to use the sample scripts or documentation, even if Microsoft has been advised of the possibility of such damages.
Brought to you by Dr. Ware, Microsoft Office 365 Silver Partner, Charleston SC.

Recent Comments