by Scott Muniz | Sep 18, 2020 | Uncategorized
This article is contributed. See the original author and article here.
Sysmon v12.0
In addition to several bug fixes, this major update to Sysmon adds support for capturing clipboard operations to help incident responders retrieve attacker RDP file and command drops, including originating remote machine IP addresses.
Process Monitor v3.60
This update to Process Monitor, a utility that logs process file, network and registry activity, adds support for multiple filter item selection, as well as decoding for new file system control operations and error status codes.
Procdump v10.0
This release of Procdump, a flexible tool for manual and trigger-based process dump generation, adds support for dump cancellation and CoreCLR processes.
ARM64 ports
In addition, several tools have been newly ported to and are now available for ARM64. These include: AdInsight v1.2, AutoLogon v3.1, Autoruns v13.98, ClockRes v2.1, DebugView v4.9, DiskExt v1.2, FindLinks v1.1, Handle v4.22, Hex2Dec v1.1, Junction v1.07, PendMoves v1.02, PipeList v1.02, Procdump v10.0, Process Explorer v16.32, RegDelNull v1.11, RU v1.2, Sigcheck v2.8, Streams v1.6, Sync v2.2, VMMap v3.26, WhoIs v1.21 and ZoomIt v4.52. Download all ARM64 tools in a single download with the Sysinternals Suite for ARM64.
by Scott Muniz | Sep 18, 2020 | Azure, Technology, Uncategorized
This article is contributed. See the original author and article here.
This blog post covers a new geo function and the basics of geospatial joins.
geo_polygon_to_s2cells
geo_polygon_to_s2cells takes a polygon or multipolygon and a S2 cell level as input and creates an array of all token strings which cover it. Be aware that covering a large-area polygon with small-area cells can lead to a huge amount of covering cells. As a result, the query might return null.
KQL-Query:
let polygon = dynamic({"type":"Polygon","coordinates":[[[0,0],[0,50],[100,50],[0,0]]]});
print s2_cell_token_count = array_length(geo_polygon_to_s2cells(polygon, 5));
Result:
Geospatial joins
This query pattern is oftentimes used in various mobility solutions (geospatial telemetry and static reference data), geospatial risk analysis and agriculture optimization using weather data. It is based on the three-dimensional S2 geometry and the functions geo_polygon_to_s2cells and geo_point_in_polygon. By use of this functionality a geospatial join consists of a coarse-grained join using the S2 cell coverage and the exact validation using the geo_point_in_polygon function.
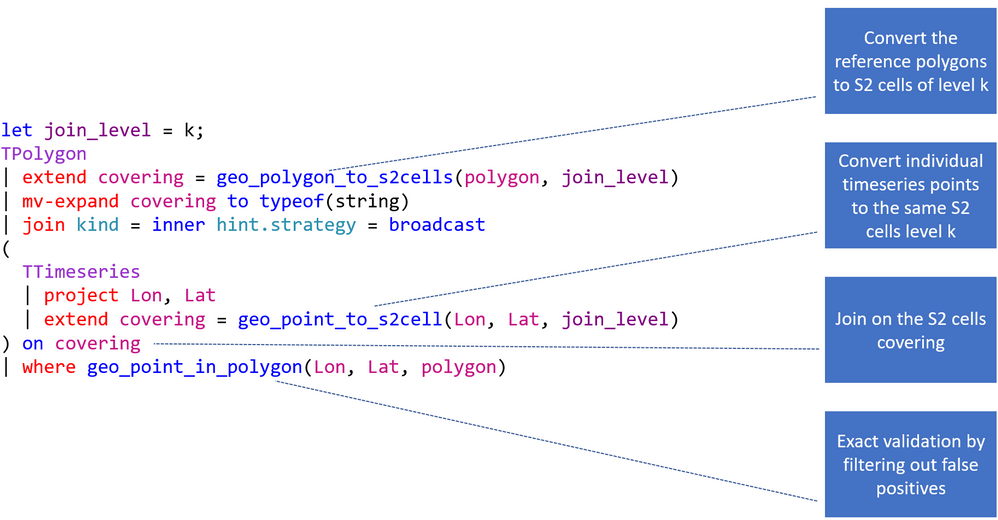
The four main steps:
- Converting polygons to S2 cells of level k,
- Converting points to the same S2 cells level k,
- Joining on S2 cells,
- Filtering by geo_point_in_polygon().
The following picture explains the flow of the entire KQL query. First you need to choose the right S2 cell level. It should not be too big and not too small (it is not recommended to use more than 10.000 cells, 65535 are possible in theory). Second you are creating the S2 cell tokens for the static dataset. Next you are joining the polygons with the timeseries based on the tokens. This provides you with a dataset which might still has some false positives (S2 cell overlap) and that is why you need to end the statement with a check if the actual point is in the polygon.

This is a concrete example of a geospatial join based on the StormEvents and US_States table located on the help cluster. It calculates the damage in $ by state.
KQL-Query:
let join_level = 4;
US_States
| project State = features.properties.NAME, polygon = features.geometry
| extend covering = geo_polygon_to_s2cells(polygon, join_level)
| mv-expand covering to typeof(string)
| join kind = inner hint.strategy = broadcast
(
  StormEvents
  | project BeginLon, BeginLat , DamageProperty
  | extend covering = geo_point_to_s2cell(BeginLon, BeginLat, join_level)
) on covering
| where geo_point_in_polygon(BeginLon, BeginLat, polygon)
| summarize CountOfEvents=count(), DamageInDollar=sum(DamageProperty) by tostring(State)
| top 3 by DamageInDollar desc
Result:
| State |
CountOfEvents |
DamageInDollar |
|
Kansas
|
2298
|
533352500
|
|
Texas
|
3889
|
488525500
|
|
Ohio
|
852
|
371630500
|
by Scott Muniz | Sep 18, 2020 | Uncategorized
This article is contributed. See the original author and article here.
My name is Susan Buchanan and today I’d like to discuss some basic troubleshooting for applications hangs using Task Manager, Resource Monitor, and WaitingOn outside of getting an application dump. A special shout out to Leo Fagundes for writing the WaitingOn application.
Troubleshooting application hangs is key to resolution. Getting an application dump will not always be a smoking gun and should be used as a last resort for various reasons as missing symbols for 3rd party applications or waiting on other processes.
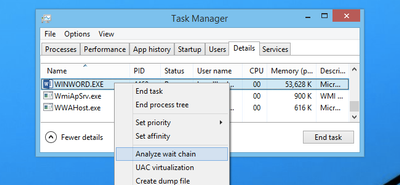
Task Manager & Resource Monitor – Analyze Wait Chain: Beginning with Windows 8, in 2014 we added new options into Task Manager as well as Resource Monitor was the “Analyze Wait Chain” option when you right-click on a task in the Details view. This allows you to see what processes are waiting for a resource that is being used by another process.
WaitingOn.exe a simple tool that helps troubleshoot hung applications and services.
WaitingOn.exe is available at https://github.com/leonardomsft/WaitingOn/releases/download/v1.1/WaitingOn.exe, and besides functional, it’s still experimental. Use it with caution. If you install it on a customer’s machine, please remove it at the end of the troubleshooting session.
WaitingOn.exe displays all the blocked threads from a process and what they are Waiting On. It can also display all blocked threads for all processes in the system.
WaitingOn.exe leverages the Wait Chain Traversal (WCT) API introduced in Windows 2008/Vista. The WCT API is the one behind the “Analyze Wait Chain” functionality in Task Manager and Resource Monitor.
Task Manager
One of the new options added into Task Manager in recent versions was the “Analyze Wait Chain” option when you right-click on a task in the Details view. This allows you to see what processes are waiting for a resource that is being used by another process.
What this means is that if you have an application hanging for some reason, you can analyze the wait chain to see whether it is waiting on something that is in use.

For instance, we printed from Word, and then used this option while the print process was happening to see what would happen. In this case, Word was waiting for splwow64.exe, which handles printing from 32-bit applications.

It’s worth noting that because Word is written properly, the GUI interface doesn’t actually hang while it is waiting for the other process.
In this case the process is working correctly and is not hung.
For 3rd party applications, it may show you other processes it is waiting on. If the selected process is waiting for another process, a tree organized by dependency on other processes will be displayed. (See screenshot above).
NOTE: Many system processes depend on other processes and services for normal operation. Both Task Manager and Resource Monitor will display wait chain information for any process.
In a second scenario BadApp.exe is not responding

We attempt to Analyze Wait Chain from within Task Manager

If the application is not waiting on anything, it will be empty:

If the application is waiting on something, it will show the process it is waiting for:

(In this example you can see that Perfmon is waiting on a svchost). We will dig deeper into this in a few moments.
Resource Monitor
Use case example: Badapp
Start Resource Monitor by either typing ResMon from the search box or starting the Resource Monitor icon from the Start Menu.

In Resource Monitor we see badapp.exe is not responding.

If a process entry in the table is not red, if the process status is Running, and if the program is operating normally, then no action should be required by you.
If a process entry in the table is red, if the process status is not running, and if the program is not operating normally, then you can try killing the process it is waiting on starting with the child processes in red first, then moving to the parent processes.
You can start a “wait chain analysis” from Resource Monitor as well, simply do a right click on the process you want to investigate.
Using WaitingOn.exe & it’s Advantages
WaitingOn.exe has the following advantages over Task Manager and Resource Monitor:
- It displays what type of object is blocking the thread.
- It displays the name of the object blocking the thread.
- It can be scripted.
- It can be run against a computer that you can’t logon (by using PsExec or Remote Powershell).
WaitingOn.exe was built on top of the sample WCF code available in the MSDN documentation.
Use case example: Badapp

As seen earlier, this process is the parent process that is hung and is not waiting on any other processes thread.
Use case example : Perfmon
In this example, we had a hung perfmon.exe window that was not responding to mouse clicks. Attempting to run the Analyze Wait Chain command from Task Manager produced the following results:

We can see that perfmon.exe (PID 3292) is waiting on an svchost process (PID 1564), but since it hosts many services, there is not much we can do.
<background information>
If you encounter a service host with multiple services, always consider isolating the services. In Windows 10 / WS 2016 we have introduced the change by default (if you have more than 4 GB RAM). To isolate a service, we use the sc.exe command line tool:
sc config <servicename> type= own
Important: there is a space between type= and own which is required!
https://docs.microsoft.com/de-de/windows-server/administration/windows-commands/sc-config
</background information>
Now, running WaitingOn.exe against the hung perfmon.exe revealed that Thread 7352 was blocked by an Alpc called “RPC ControlDNSResolver”, which was found in the svchost.exe handle list:

We then can use Process Explorer to further investigate or kill that object (which might result in unexpected behavior!)

In this case we decided to simply restart the associated service (DNS Cache service) which unfroze the perfmon.exe window.
Additional information:
Links within this article:

by Scott Muniz | Sep 18, 2020 | Uncategorized
This article is contributed. See the original author and article here.

We are just a few days away from our first ever digital Microsoft Ignite. Microsoft 365 Government will be available with in-depth content to pair the all-digital event experience. Specifically, for our government customers we’re diving into two unique conversations about security, compliance, and providing hands on ways you can reduce risk as you accelerate your governments digital transformation.
Today, more than ever, government organizations are facing increasing challenges associated with remote delivery of public services. We have added enhanced regulatory, legal, and forensic investigation capabilities in the government clouds to help address these challenges. We are excited to announce Advanced eDiscovery capabilities in Microsoft 365 Government. Advanced eDiscovery provides a broad set of intelligent capabilities to help customers reduce large volumes of data to a relevant set. For example, an automatically generated query helps filter only for unique content by identifying near duplicates, which can help dramatically reduce data. You can learn more about this and other Advanced eDiscovery capabilities in this demo at aka.ms/GovAdvancedeDiscoveryVideo.
Sessions
For a full list of sessions for Ignite can be found here
Government Sessions
As part of the learning experience we’ve added two on demand sessions specifically targeted to security and compliance professionals and anyone that is looking to learn more about how Microsoft 365 Government can help in protect and navigate the modern digital world. The below sessions will be posted in the Microsoft Tech Community Video Hub launching on Sept 22nd.
- Increase security, reduce risk, and maximize government resources – Steve Faehl US Security CTO; Dean Iacovelli, SLG Director; Bryan Hunt, SLG Director
- Streamline your mission with Microsoft 365 Compliance – Matthew Littleton Microsoft 365 Advanced Compliance Specialist
- Improving the Customer Experience for Government Services– Bobby Chang, Technology Specialist; Brian Duncan, Senior Solutions Architect
Resources
Below is a list of resources you can take a look at now to learn more and bookmark to reference later:
- Register for Microsoft Ignite and start building your event schedule with sessions.
- Access the Virtual Hub for deep-dive technical training for IT pros, developers, and community champions available on September 22nd and get access to interactive guides, community resources and more.
- Check out the Microsoft Tech Community Video Hub launching on September 22nd to view videos and join conversation.
- Follow @Microsoft365 and @MS_Ignite on Twitter to stay up to date with the latest Microsoft 365 and Ignite news.
by Scott Muniz | Sep 18, 2020 | Uncategorized
This article is contributed. See the original author and article here.
This installment is part of a broader series to keep you up to date with the latest features in Azure Sentinel. The installments will be bite-sized to enable you to easily digest the new content.
File hash is a unique value that corresponds to the content of a file computed by using a specified hash algorithm. Using hashes, you can determine if two different files have exactly the same content. Files with identical hash values share identical contents. You can also use hashes to verify if file data has been modified, tampered with, or corrupted. In cybersecurity, one of the most common use cases of file hash is to share Indicators of Compromise, a valuable resource to SOC analysts, security researchers, and threat hunters.
Up until now, different types of entity such as IP, Account, Host, URL have been made available in different areas in Azure Sentinel. We are delighted to announce that FileHash entity has been added to the Analytics and generally available! Let us look at an example of where and how you can start leveraging this great addition today.
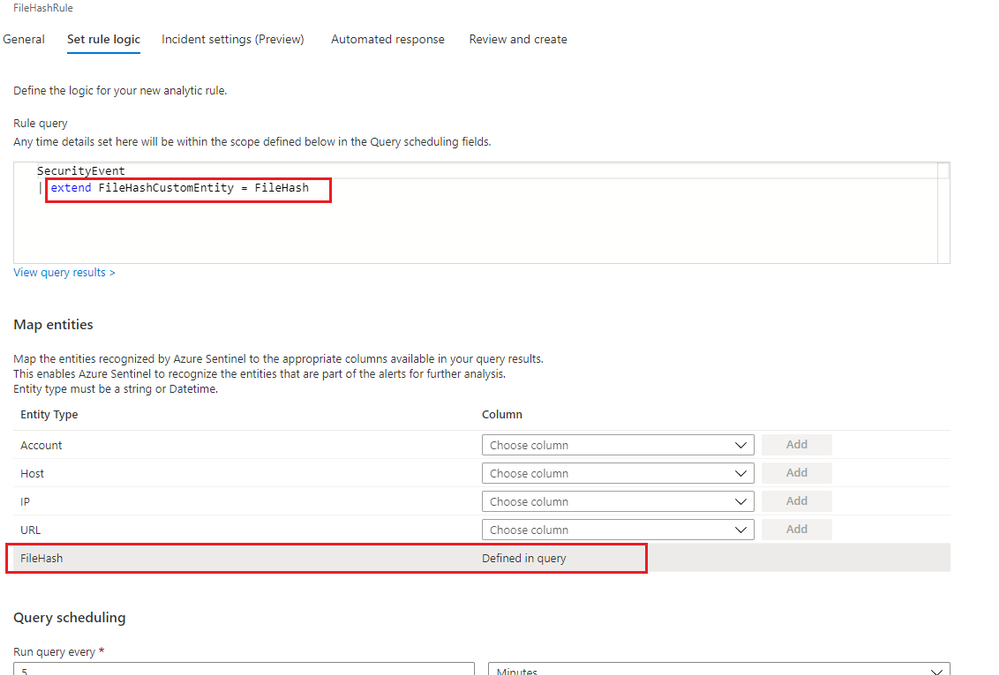
Analytic Rule
File hash can be used for entity mapping in a scheduled analytic rule. Under Set Rule Logic view of the scheduled analytic rule wizard, you can select any relevant field of a table defined in the rule query and map to the FileHash entity. A new column called FileHashCustomEntity will then be automatically created in the query, and this column name can be customized. If you identify a malicious file on a machine and want to scan your entire environment for existence of that file, you can assign that specific hash value to the FileHashCustomEntity field. This enables Azure Sentinel to recognize this entity that is part of the alerts for further analysis.

Figure1. FileHash in Analytic Rule
Investigation
If Azure Sentinel detects any matches for a known hash value from a detection rule you already set up, incidents with an entity type of FileHash will be created. You can then leverage the full incident view and Investigation graph to analyze the potentially anomalous activity based on this hash information. The Investigation view provides the relevant information including hash value, hash algorithm such as SHA256, MD5, etc., and its friendly name.
.png")
Figure2. FileHash sample in Investigation Graph
Leveraging the power of KQL in Log Analytics, you can also query the matches across your environment to perform further analysis.

Figure3. FileHash sample in query results
Get started today!
We encourage you to explore the FileHash entity in Azure Sentinel for threat detection and investigation in your environment.
Try it out, and let us know what you think!
You can also contribute new connectors, workbooks, analytics and more in Azure Sentinel. Get started now by joining the Azure Sentinel Threat Hunters GitHub community.

Recent Comments