This article is contributed. See the original author and article here.
My name is Susan Buchanan and today I’d like to discuss some basic troubleshooting for applications hangs using Task Manager, Resource Monitor, and WaitingOn outside of getting an application dump. A special shout out to Leo Fagundes for writing the WaitingOn application.
Troubleshooting application hangs is key to resolution. Getting an application dump will not always be a smoking gun and should be used as a last resort for various reasons as missing symbols for 3rd party applications or waiting on other processes.
Task Manager & Resource Monitor – Analyze Wait Chain: Beginning with Windows 8, in 2014 we added new options into Task Manager as well as Resource Monitor was the “Analyze Wait Chain” option when you right-click on a task in the Details view. This allows you to see what processes are waiting for a resource that is being used by another process.
- What this means is that if you have an application hanging for some reason, you can analyze the wait chain to see whether it is waiting on something that is in use.
- Additional Information on how to prevent hangs in windows applications:
https://docs.microsoft.com/en-us/windows/win32/win7appqual/preventing-hangs-in-windows-applications and a Blog which talks about the “analyze wait chain” feature:
https://blogs.technet.microsoft.com/tip_of_the_day/2014/03/01/tip-of-the-day-wait-chain-analyzer/
WaitingOn.exe a simple tool that helps troubleshoot hung applications and services.
WaitingOn.exe is available at https://github.com/leonardomsft/WaitingOn/releases/download/v1.1/WaitingOn.exe, and besides functional, it’s still experimental. Use it with caution. If you install it on a customer’s machine, please remove it at the end of the troubleshooting session.
WaitingOn.exe displays all the blocked threads from a process and what they are Waiting On. It can also display all blocked threads for all processes in the system.
WaitingOn.exe leverages the Wait Chain Traversal (WCT) API introduced in Windows 2008/Vista. The WCT API is the one behind the “Analyze Wait Chain” functionality in Task Manager and Resource Monitor.
Task Manager
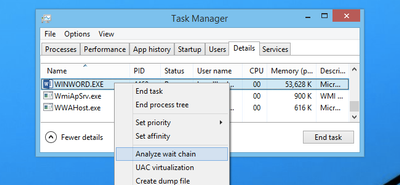
One of the new options added into Task Manager in recent versions was the “Analyze Wait Chain” option when you right-click on a task in the Details view. This allows you to see what processes are waiting for a resource that is being used by another process.
What this means is that if you have an application hanging for some reason, you can analyze the wait chain to see whether it is waiting on something that is in use.

For instance, we printed from Word, and then used this option while the print process was happening to see what would happen. In this case, Word was waiting for splwow64.exe, which handles printing from 32-bit applications.

It’s worth noting that because Word is written properly, the GUI interface doesn’t actually hang while it is waiting for the other process.
In this case the process is working correctly and is not hung.
For 3rd party applications, it may show you other processes it is waiting on. If the selected process is waiting for another process, a tree organized by dependency on other processes will be displayed. (See screenshot above).
NOTE: Many system processes depend on other processes and services for normal operation. Both Task Manager and Resource Monitor will display wait chain information for any process.
In a second scenario BadApp.exe is not responding

We attempt to Analyze Wait Chain from within Task Manager

If the application is not waiting on anything, it will be empty:

If the application is waiting on something, it will show the process it is waiting for:

(In this example you can see that Perfmon is waiting on a svchost). We will dig deeper into this in a few moments.
Resource Monitor
Use case example: Badapp
Start Resource Monitor by either typing ResMon from the search box or starting the Resource Monitor icon from the Start Menu.

In Resource Monitor we see badapp.exe is not responding.

If a process entry in the table is not red, if the process status is Running, and if the program is operating normally, then no action should be required by you.
If a process entry in the table is red, if the process status is not running, and if the program is not operating normally, then you can try killing the process it is waiting on starting with the child processes in red first, then moving to the parent processes.
You can start a “wait chain analysis” from Resource Monitor as well, simply do a right click on the process you want to investigate.
Using WaitingOn.exe & it’s Advantages
WaitingOn.exe has the following advantages over Task Manager and Resource Monitor:
- It displays what type of object is blocking the thread.
- It displays the name of the object blocking the thread.
- It can be scripted.
- It can be run against a computer that you can’t logon (by using PsExec or Remote Powershell).
WaitingOn.exe was built on top of the sample WCF code available in the MSDN documentation.
Use case example: Badapp

As seen earlier, this process is the parent process that is hung and is not waiting on any other processes thread.
Use case example : Perfmon
In this example, we had a hung perfmon.exe window that was not responding to mouse clicks. Attempting to run the Analyze Wait Chain command from Task Manager produced the following results:

We can see that perfmon.exe (PID 3292) is waiting on an svchost process (PID 1564), but since it hosts many services, there is not much we can do.
<background information>
If you encounter a service host with multiple services, always consider isolating the services. In Windows 10 / WS 2016 we have introduced the change by default (if you have more than 4 GB RAM). To isolate a service, we use the sc.exe command line tool:
sc config <servicename> type= own
Important: there is a space between type= and own which is required!
https://docs.microsoft.com/de-de/windows-server/administration/windows-commands/sc-config
</background information>
Now, running WaitingOn.exe against the hung perfmon.exe revealed that Thread 7352 was blocked by an Alpc called “RPC ControlDNSResolver”, which was found in the svchost.exe handle list:

We then can use Process Explorer to further investigate or kill that object (which might result in unexpected behavior!)

In this case we decided to simply restart the associated service (DNS Cache service) which unfroze the perfmon.exe window.
Additional information:
Links within this article:
- Additional Information on how to prevent hangs in windows applications:
https://docs.microsoft.com/en-us/windows/win32/win7appqual/preventing-hangs-in-windows-applications - and a Blog which talks about the “analyze wait chain” feature:
https://blogs.technet.microsoft.com/tip_of_the_day/2014/03/01/tip-of-the-day-wait-chain-analyzer/ - WaitingOn.exe at github: https://github.com/leonardomsft/WaitingOn/releases/download/v1.1/WaitingOn.exe,
- Wait Chain Traversal:
https://docs.microsoft.com/de-de/windows/win32/debug/wait-chain-traversal - sc command line options:
https://docs.microsoft.com/de-de/windows-server/administration/windows-commands/sc-config
Brought to you by Dr. Ware, Microsoft Office 365 Silver Partner, Charleston SC.

Recent Comments