This article is contributed. See the original author and article here.
Microsoft partners like TechLatest, RightFoot, and Heimdall Data deliver transact-capable offers, which allow you to purchase directly from Azure Marketplace. Learn about these offers below:
Ansible AWX (GUI alternative to Ansible Tower): This virtual machine offered by TechLatest provides a web-based Ansible Tower environment using AWX, the upstream project from which the Red Hat Ansible Tower offering is derived. Centralize and control IT deployment and configuration with a graphical dashboard, role-based access control, job scheduling, and integrated notifications.
MOHR, cloud-based HR system: Digitally transform your human resources department with MOHR from RightFoot. Available in English and Arabic, MOHR helps HR teams manage personnel, payroll processing, job descriptions, key performance indicators, and more. Facial recognition supports mobile-based attendance checks, and managers gain quick access to team data via dashboards.
Heimdall Database Proxy: Made for developers, database administrators, and architects, Heimdall Database Proxy offers automated query caching and invalidation, SQL performance analytics for root-cause analysis, automated database failover, and more. Save up to 50 percent on database costs and improve performance up to 20 times with Heimdall Database Proxy.
This article is contributed. See the original author and article here.
For much of 2020 and 2021, people have endured missing their friends and loved ones. Yet while physical distance has separated us, we have also rediscovered the power and importance of being together. 2020 reminded us that success isn’t fully celebrated without the ones who helped. Holidays aren’t as memorable without connecting with friends and…
This article is contributed. See the original author and article here.
Azure Resource Graph is an extremely powerful extension to Azure Resource Management that provides efficient resource exploration at scale. It supports both Azure Lighthouse as well as cross subscription querying. It also provides the ability to do complex filtering and grouping. It can do this because it uses a subset of the Kusto Query Language.
Access
To use Azure Resource Graph successfully, you’ll need read access to any subscription and resource(s) that you wish to query. If you do not have read access to a resource or subscription they will not appear in your resulting data sets.
Queries can be run against the Azure Resource Graph API, with PowerShell, or in the Azure portal. This post will use the Azure portal for its examples.
Resource Types
There are a number of tables you can query in Azure Resource Graph. The most common table is the “resources” table. This is where all resources in your Azure subscriptions will live. With few exceptions everything in Azure is a resource. Notably Azure Sentinel and Azure Security Center are not resources, they are solutions that sit on top of a Log Analytics workspace.
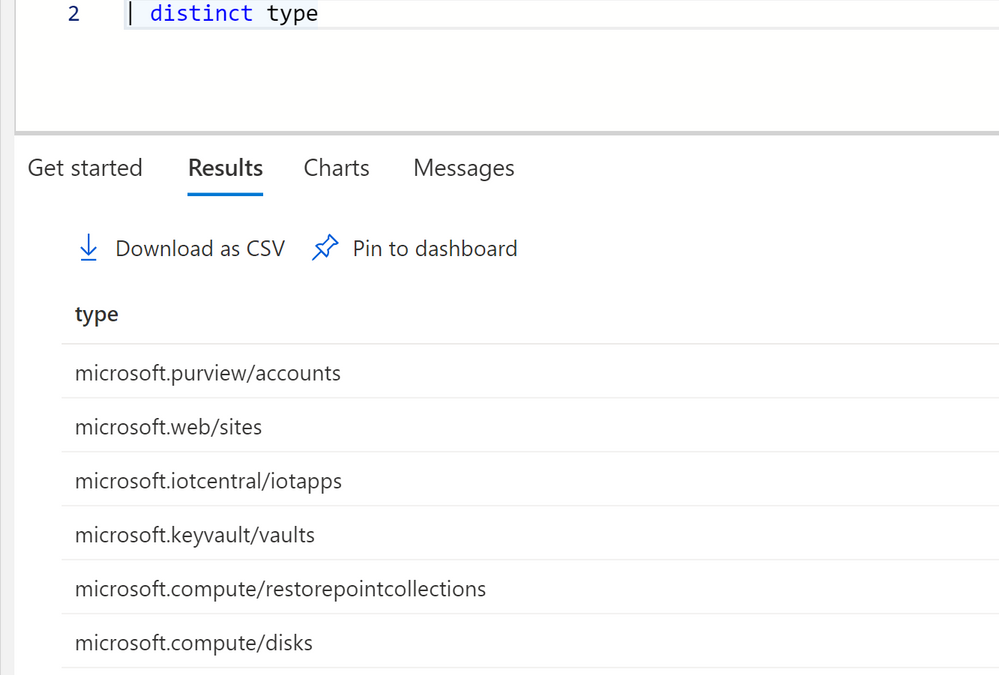
To get a idea of all the different types of resources in your subscriptions you can run the following query.
resources
| distinct type
You can get a count of all resources by using summarize.
resources
| summarize count() by type
To query a specific resource type, like virtual machines, you can use a where clause with type.
resources
| where type =~ 'microsoft.compute/virtualmachines'
One thing to note on resource types, sometimes types do not match their current name in Azure. For instance Log Analytics resource type is “OperationalInsights/workspaces.” This is because Azure resources are renamed over time but their type cannot necessarily be renamed in Azure.
You can turn on formatted results to see a proper translation of resource types to their current Azure names.
Dynamic Types
Dynamic types in Kusto are fields that have multiple values or properties under it. In Azure Resource Graph there are multiple fields, and most commonly the properties field that have multiple values and even nested JSON underneath it. These values have a ton of useful information about your Azure resources in them. But you’ll need to know how to access the information. There are several ways to access information depending on how the information is formatted.
One of the fields that has useful information nested inside it is the Sku field, some resources have the sku type and tier of the Azure service in this field, while others have it under properties.
Whenever you see curly braces in Azure Resource Graph that means that there are multiple values in that field.
To access information underneath it we can use dot notation.
resources
| where type =~ 'microsoft.containerservice/managedclusters'
| extend Sku = sku.name
| project id, Sku
You can click on see details on the right hand side to see all the fields and if they have any nested values. In this case we’re looking at VM properties and its hardware profile size. We can get this information again with dot notation.
We can use dot notation to extract our VMs hardware profile size.
resources
| where type =~ 'microsoft.compute/virtualmachines'
| extend Size = properties.hardwareProfile.vmSize
| project id, Size
Advanced Dynamic Types
Dot notation works really well for a number of properties. We can go as many levels deep as we want with dot notation, until we run into brackets inside our nested field. See here on the network interface, the nic’s ID is inside brackets. This is because we can have more than one nic to one VM.
While technically dot notation would still work by using [0] in reference to the object in an array, its not dynamic. Meaning if we don’t necessarily know if we have 2 objects or 20 in the array. We’ll want to use mv-expand for these types of data.
Now that we know some of the ins and outs, lets apply that knowledge to practical examples you can use in your environment.
Summary count of VMs by Size
Resources
| where type == "microsoft.compute/virtualmachines"
| summarize Count=count() by vmSize=tostring(properties.hardwareProfile.vmSize)
Summary count of VMs by their current state
Resources
| where type == "microsoft.compute/virtualmachines"
| extend vmState = tostring(properties.extended.instanceView.powerState.displayStatus)
| extend vmState = iif(isempty(vmState), "VM State Unknown", (vmState))
| summarize count() by vmState
Because almost everything in Azure is an Azure resource, VMs have a VM object, as well as disk and NIC objects, each of which are separate Azure resources. One VM can have multiple disks and NICs. If we want to display VM’s with their corresponding NICs and Disks we have to use Joins as well as our dot notation and mv-expand to get pertinent information.
resources
| where type == "microsoft.compute/virtualmachines"
| extend osDiskId= tolower(properties.storageProfile.osDisk.managedDisk.id)
    | join(
        resources
        | where type =~ 'microsoft.compute/disks'
        | where properties !has 'Unattached'
        | where properties has 'osType'
        | project OS = tostring(properties.osType), osSku = tostring(sku.name), osDiskSizeGB = toint(properties.diskSizeGB), osDiskId=tolower(id))
	on osDiskId
| extend nics=array_length(properties.networkProfile.networkInterfaces)
| mv-expand nic=properties.networkProfile.networkInterfaces
| where nics == 1 or nic.properties.primary =~ 'true' or isempty(nic)
| extend vmId = id, vmName = name, vmSize=tolower(properties.hardwareProfile.vmSize), nicId = tostring(nic.id)
    | join kind=leftouter (
        resources
        | where type =~ 'microsoft.network/networkinterfaces'
        | extend ipConfigsCount=array_length(properties.ipConfigurations)
        | mv-expand ipconfig=properties.ipConfigurations
        | where ipConfigsCount == 1 or ipconfig.properties.primary =~ 'true'
        | project nicId = id, privateIP= tostring(ipconfig.properties.privateIPAddress), publicIpId = tolower(ipconfig.properties.publicIPAddress.id), subscriptionId)
    on nicId
| project id, resourceGroup, OS, osSku, osDiskSizeGB, vmSize, privateIP, publicIpId, nicId, properties
Notes about this query: 1, we want to use tolower() which simultaneously makes the value a string, it makes it all lower case as well. This is useful when doing joins as KQL cannot join dynamic types, and will not see the resource IDs as the same if one if camel case and one is lowercase, as KQL is case sensitive. 2, we use left outer joins because a VM can have a public IP but it can also not have a public IP.
I have included many examples for different resource types on my github repo.
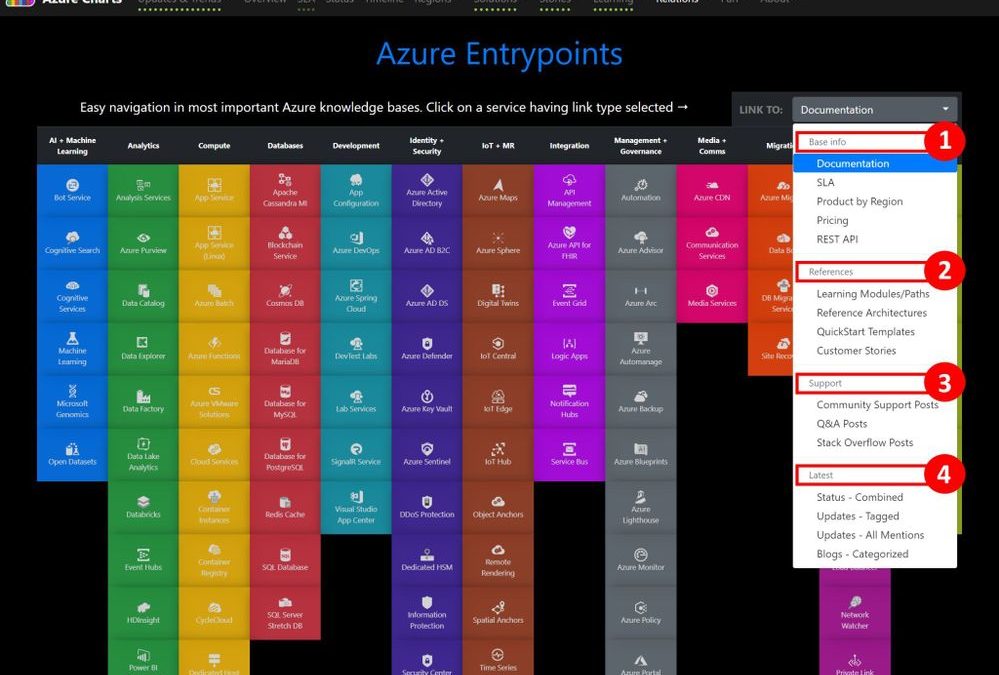
Azure Entrypoints from Azure Charts can be used to build your streamlined workflow for any Azure service understanding in a couple of clicks?
For a service of your interest:
❶ – Start with Base Info, ❷ – Move on to References (from Learning to Case studies), ❸ – Check out Support + Q&A if needed, ❹ – Keep up with the Latest status.
Azure Cloud Computing made accessible with Azurecharts for Microsoft Aazure
This article is contributed. See the original author and article here.
Have you discovered that the existing Power Automate actions for Excel are limited to Excel Tables? Are you looking to take your cloud flow interactions with Excel to the next level? Maybe it’s time to start looking at Excel Scripts which are currently accessible to Power Automate as a Preview Feature.
What are Excel Scripts? Using either the built in recording tool or TypeScript programming language you can create a script to update cells, rows or ranges of data or indeed insert formulas into cells. You can even use Excel to perform some of the features missing to Power Automate like sorting an array.
I have prepared a two part video series demo’ing how you can use Power Automate and Excel Scripts to both send data to a plain excel file and populate cells, rows and ranges but also in return, again using Excel Scripts, how you can create a table in an Excel file and return the available data either as a results array for your next action in your Cloud Flow OR by using the list all rows action based on the newly created table.
First Video on Populating Excel from Cloud Flows is available here:
The below Cloud Flow is relatively straight forward for this first part demo. We have an array of Rows for our Excel Worksheet and this demonstrates one of many ways to pass data to Excel via the Script Action. The real benefit of creating a bespoke function in Excel Scripts is that the Script Action is dynamic. It will return the fields you have defined in the action window and ensure the datatype provided is correct, i.e. string or number.
In the sample Typescript Excel Script built below, you can try this for yourself. The script will populate unique cells, columns and rows with data based on the 4 variable types defined, examplevar1-4 as strings, numbers, multivariables and arrays.
function main(workbook: ExcelScript.Workbook,

  examplevar1: string,
  examplevar2: number,
  examplevar3: multivariable, //Header of Table
  examplevar4: arrayvar[] //Multiple rows in Table

) {

  let selectedSheet = workbook.getActiveWorksheet();

  // Set cells A1,B2,C3,D4 on selectedSheet
  selectedSheet.getRange("A1").setValue(examplevar1);
  selectedSheet.getRange("B2").setValue(examplevar2);
  selectedSheet.getRange("C3").setValue(examplevar1 + ' ' + examplevar2);
  selectedSheet.getRange("D4").setValue(examplevar2 + 1111);

  //An example function to reverse the strings
  function reverseString(str: string) {
    return str.split("").reverse().join("");
  }

  //Create Vertical Header Row with Multi Variables
  const formattedColumn = [
    [reverseString(examplevar3.multivar3var1)],
    [reverseString(examplevar3.multivar3var2)],
    [reverseString(examplevar3.multivar3var3)],
    [reverseString(examplevar3.multivar3var4)],
    [reverseString(examplevar3.multivar3var5)],
    [reverseString(examplevar3.multivar3var6)]];

  selectedSheet.getRange("F1:F6").setValues(formattedColumn);

  //Create Horizontal Header Row with Multi Variables
  const formattedHeader = [[examplevar3.multivar3var1, examplevar3.multivar3var2, examplevar3.multivar3var3, examplevar3.multivar3var4, examplevar3.multivar3var5, examplevar3.multivar3var6]];

  selectedSheet.getRange("A8:F8").setValues(formattedHeader);

  //Populate rows below Header Row with Array Variable
  const starterrow = 9; //starting row for "table" data

  for (let i = 0; i < examplevar4.length; i++) {
    const currentObject = examplevar4[i];

    const formattedrow = [[currentObject.arr4var1, currentObject.arr4var2, currentObject.arr4var3, currentObject.arr4var4, currentObject.arr4var5, currentObject.arr4var6,]];

    const rowRange = `A${starterrow + i}:F${starterrow + i}`;
    selectedSheet.getRange(rowRange).setValues(formattedrow);
  }

  //Return a response to the Cloud Flow
  return "DamoBird365 Loaded " + examplevar4.length + " Records Loaded into Excel and Demo Completed OK"
}

//Defining Interfaces for MultiVar and Array

interface multivariable {
  multivar3var1: string,
  multivar3var2: string,
  multivar3var3: string,
  multivar3var4: string,
  multivar3var5: string,
  multivar3var6: string
}

interface arrayvar {
  arr4var1: number,
  arr4var2: string,
  arr4var3: string,
  arr4var4: string,
  arr4var5: string,
  arr4var6: string
}
Second video on retrieving data back from Excel files without a table. Identify the active cells, define and create a table via the script and return the data to your cloud flow as either a result to the script action or via the traditional list rows actions.
The Cloud flow on this occasion does not require any data input as its purpose is to return data back to the flow. Whilst the data could be fully repurposed in Excel, as a Power Automate enthusiast, I have used a select action to reformat the Array and rename the keys. Both the Select Action and the List Rows Action demonstrate the two methods for retrieving data from Excel where no table was present previously.
Again, in the sample Typescript Excel Script built below, you can quickly test out the functionality of creating a table and returning data to your cloud flow. The code is commented to help you understand how the solution is built. Please note I am not a coder but with the available resources online, I was quickly able to understand how to put this together. The recording tool is also useful for getting an understanding of some of the functions available.
function main(workbook: ExcelScript.Workbook) {

  // Get the first worksheet
  const selectedSheet = workbook.getFirstWorksheet();

  //get active range of WorkSheet
  let range = workbook.getActiveWorksheet().getUsedRange();

  // Get last used row of WorkSheet
  let lastrow = range.getRowCount();

  // Find first reference of ID in selectedSheet i.e. header row
  let IDCell = selectedSheet.getRange("A1").find("ID", { completeMatch: true, matchCase: true, searchDirection: ExcelScript.SearchDirection.forward });

  // Get the current active cell in the workbook.
  //and format current cell without Sheet1! reference
  let activeCell = IDCell.getAddress().replace("Sheet1!", "");

  //get table range
  const TableRange = `${activeCell}:F${lastrow}`;

  // Create a table using the data range.
  let newTable = workbook.addTable(selectedSheet.getRange(TableRange), true);
  newTable.setName("NewTableInExcel");

  // Get the first (and only) table in the worksheet.
  let table = selectedSheet.getTables()[0];

  // Get the data from the table.
  let tableValues = table.getRange().getValues();

  //Return a response to the Cloud Flow
  return tableValues

}
Where do you find Excel Scripts Functionality? It’s an Excel Online feature. Load up Excel and click on the Automate Tab. Here you can view all scripts, record some actions and edit new or existing scripts that have been built.
Wondering where they live? Jump onto OneDrive and take a look at Documents/Office Scripts where you can export/import and share.
Want to see a proof of concept ? Take a look at my Invoicing Demo here where I show you how you could autocompete an excel invoice template using scripts. I recently covered this in a live demo with the Monthly (12th May) Microsoft Office Scripts Dev Team and included a bonus feature, converting the excel files to PDF using the same flow without premium actions. Look out for this video on here soon.
Please let me know if you found this useful and what you might use Excel Scripts for next.


Recent Comments