by Contributed | May 24, 2021 | Technology
This article is contributed. See the original author and article here.
When you see your cloud-based application architecture, no matter it is microservices architecture or not, many systems are inter-connected and send/receive messages in real-time, near real-time or asynchronously. You all know, in this environment, at some stage, some messages are often failed to deliver to their respective destinations or halted while processing them.
In the cloud environment, components in a system run with their rhythm. Therefore, you should assume that a particular component gets hiccup at any point in time and design the architecture based on this assumption. Therefore, to minimise message loss, you should be able to trace them from one end to the other end. We use the term “Observability” and “Traceability” for it.
In my previous post, a citizen dev in a fusion team uses an Azure Functions app that enables the OpenAPI capability, and build a Power Apps app. This time, I’m going to add a capability that traces the workout data from the Power Apps app to Azure Cosmos DB through Azure Monitor and Application Insights. I will also discuss how this ability is related to the concepts from Open Telemetry.
You can find the sample code used in this post at this GitHub repository.
Scenario
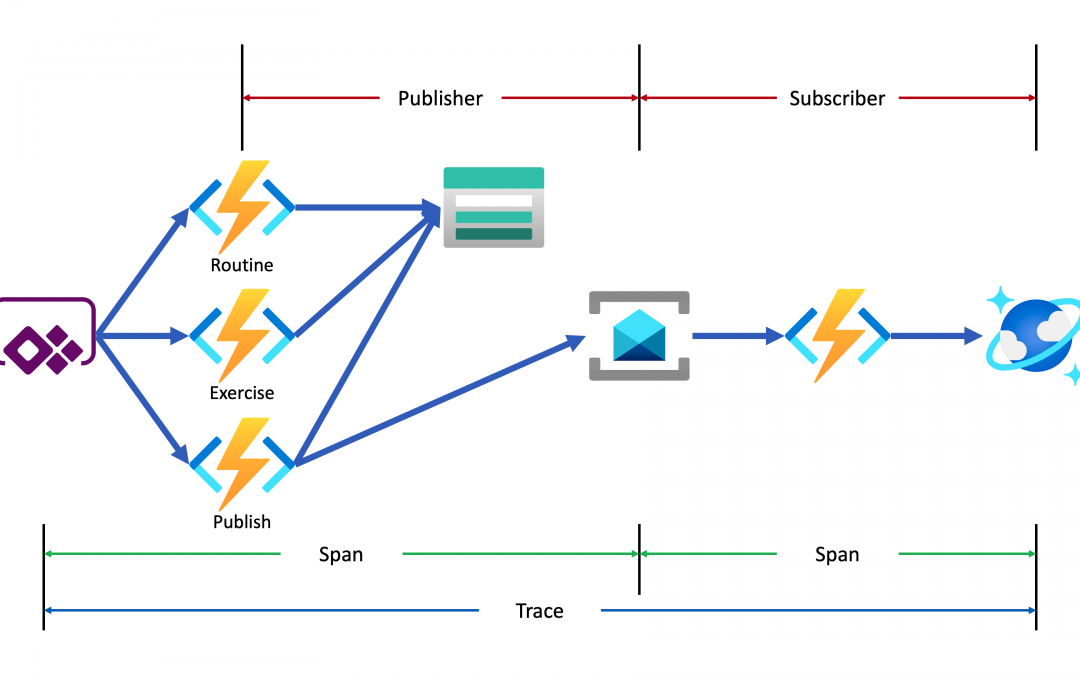
Lamna Healthcare Company runs a fitness centre in Korea for their members. The centre provides their members with a Power Apps app to record their workout details. Ji Min, the trainer team lead, recently got some feedback from her members that the app gets crashed while putting their workout logs. As she represents the trainers in the fusion team, she started discussing this issue with Su Bin, the pro dev in the team. As a result, Su Bin decided to add a tracing logic into the Function app. Here’s the high-level diagram that describes the data processing flow.
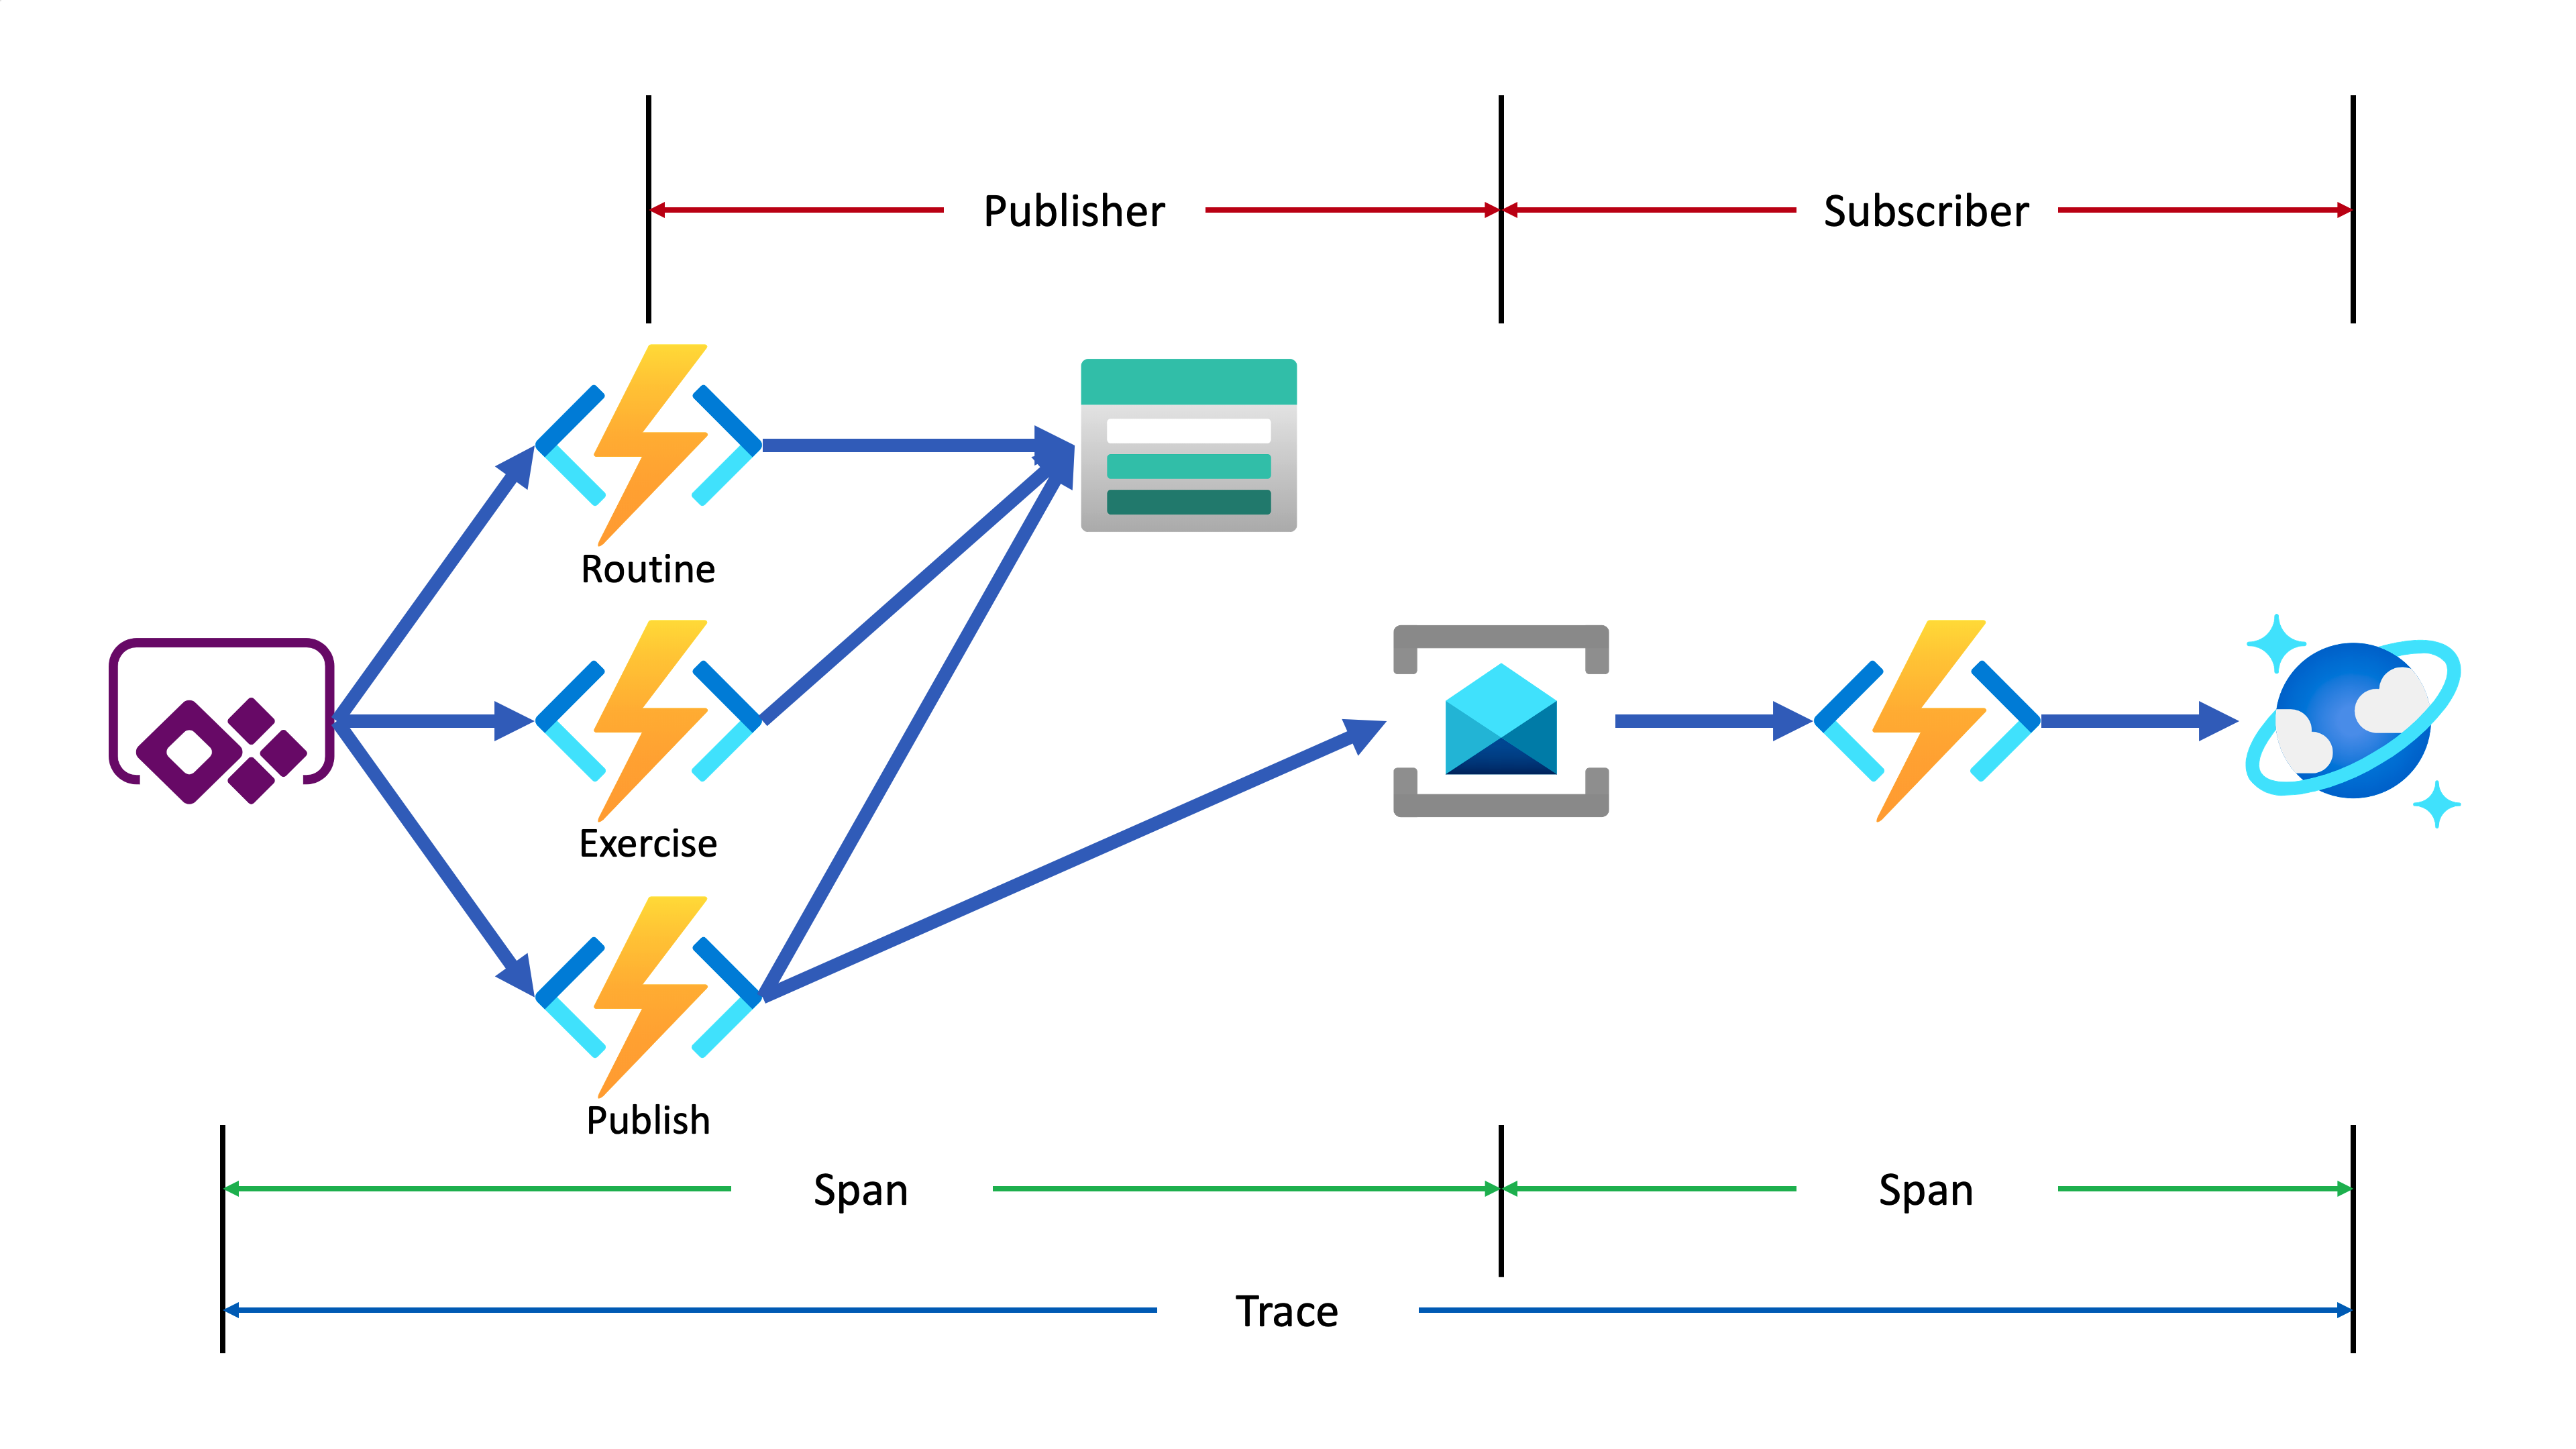
Let’s analyse the diagram based on the Open Telemetry spec.
- The entire data flow from Power Apps to Cosmos DB is called “Trace“.
- The whole flow is divided into two distinctive parts by Azure Service Bus because both sides are totally different and independent applications (Publisher and Subscriber). So, these two individual parts are called “Span“. In other words, the Span is a unit of work that handles messages.
In the picture above, the Publisher consists of three actions, routine, exercise and publish. Although you can split it into three sub Spans, let’s use one Span for now.
- The Subscriber receives the message from Azure Service Bus, transforms the message and stores it to Cosmos DB.
- When a message traverses over spans, you need a carrier for metadata so that you can trace the message within the whole Trace. The metadata is called “Span Context“.
Power Apps Update
As mentioned earlier, trace starts from the Power Apps app. Therefore, the app needs an update for the tracing capability. Generate both correlationId and spanId when tapping the Start button and send both to API through the routine action.
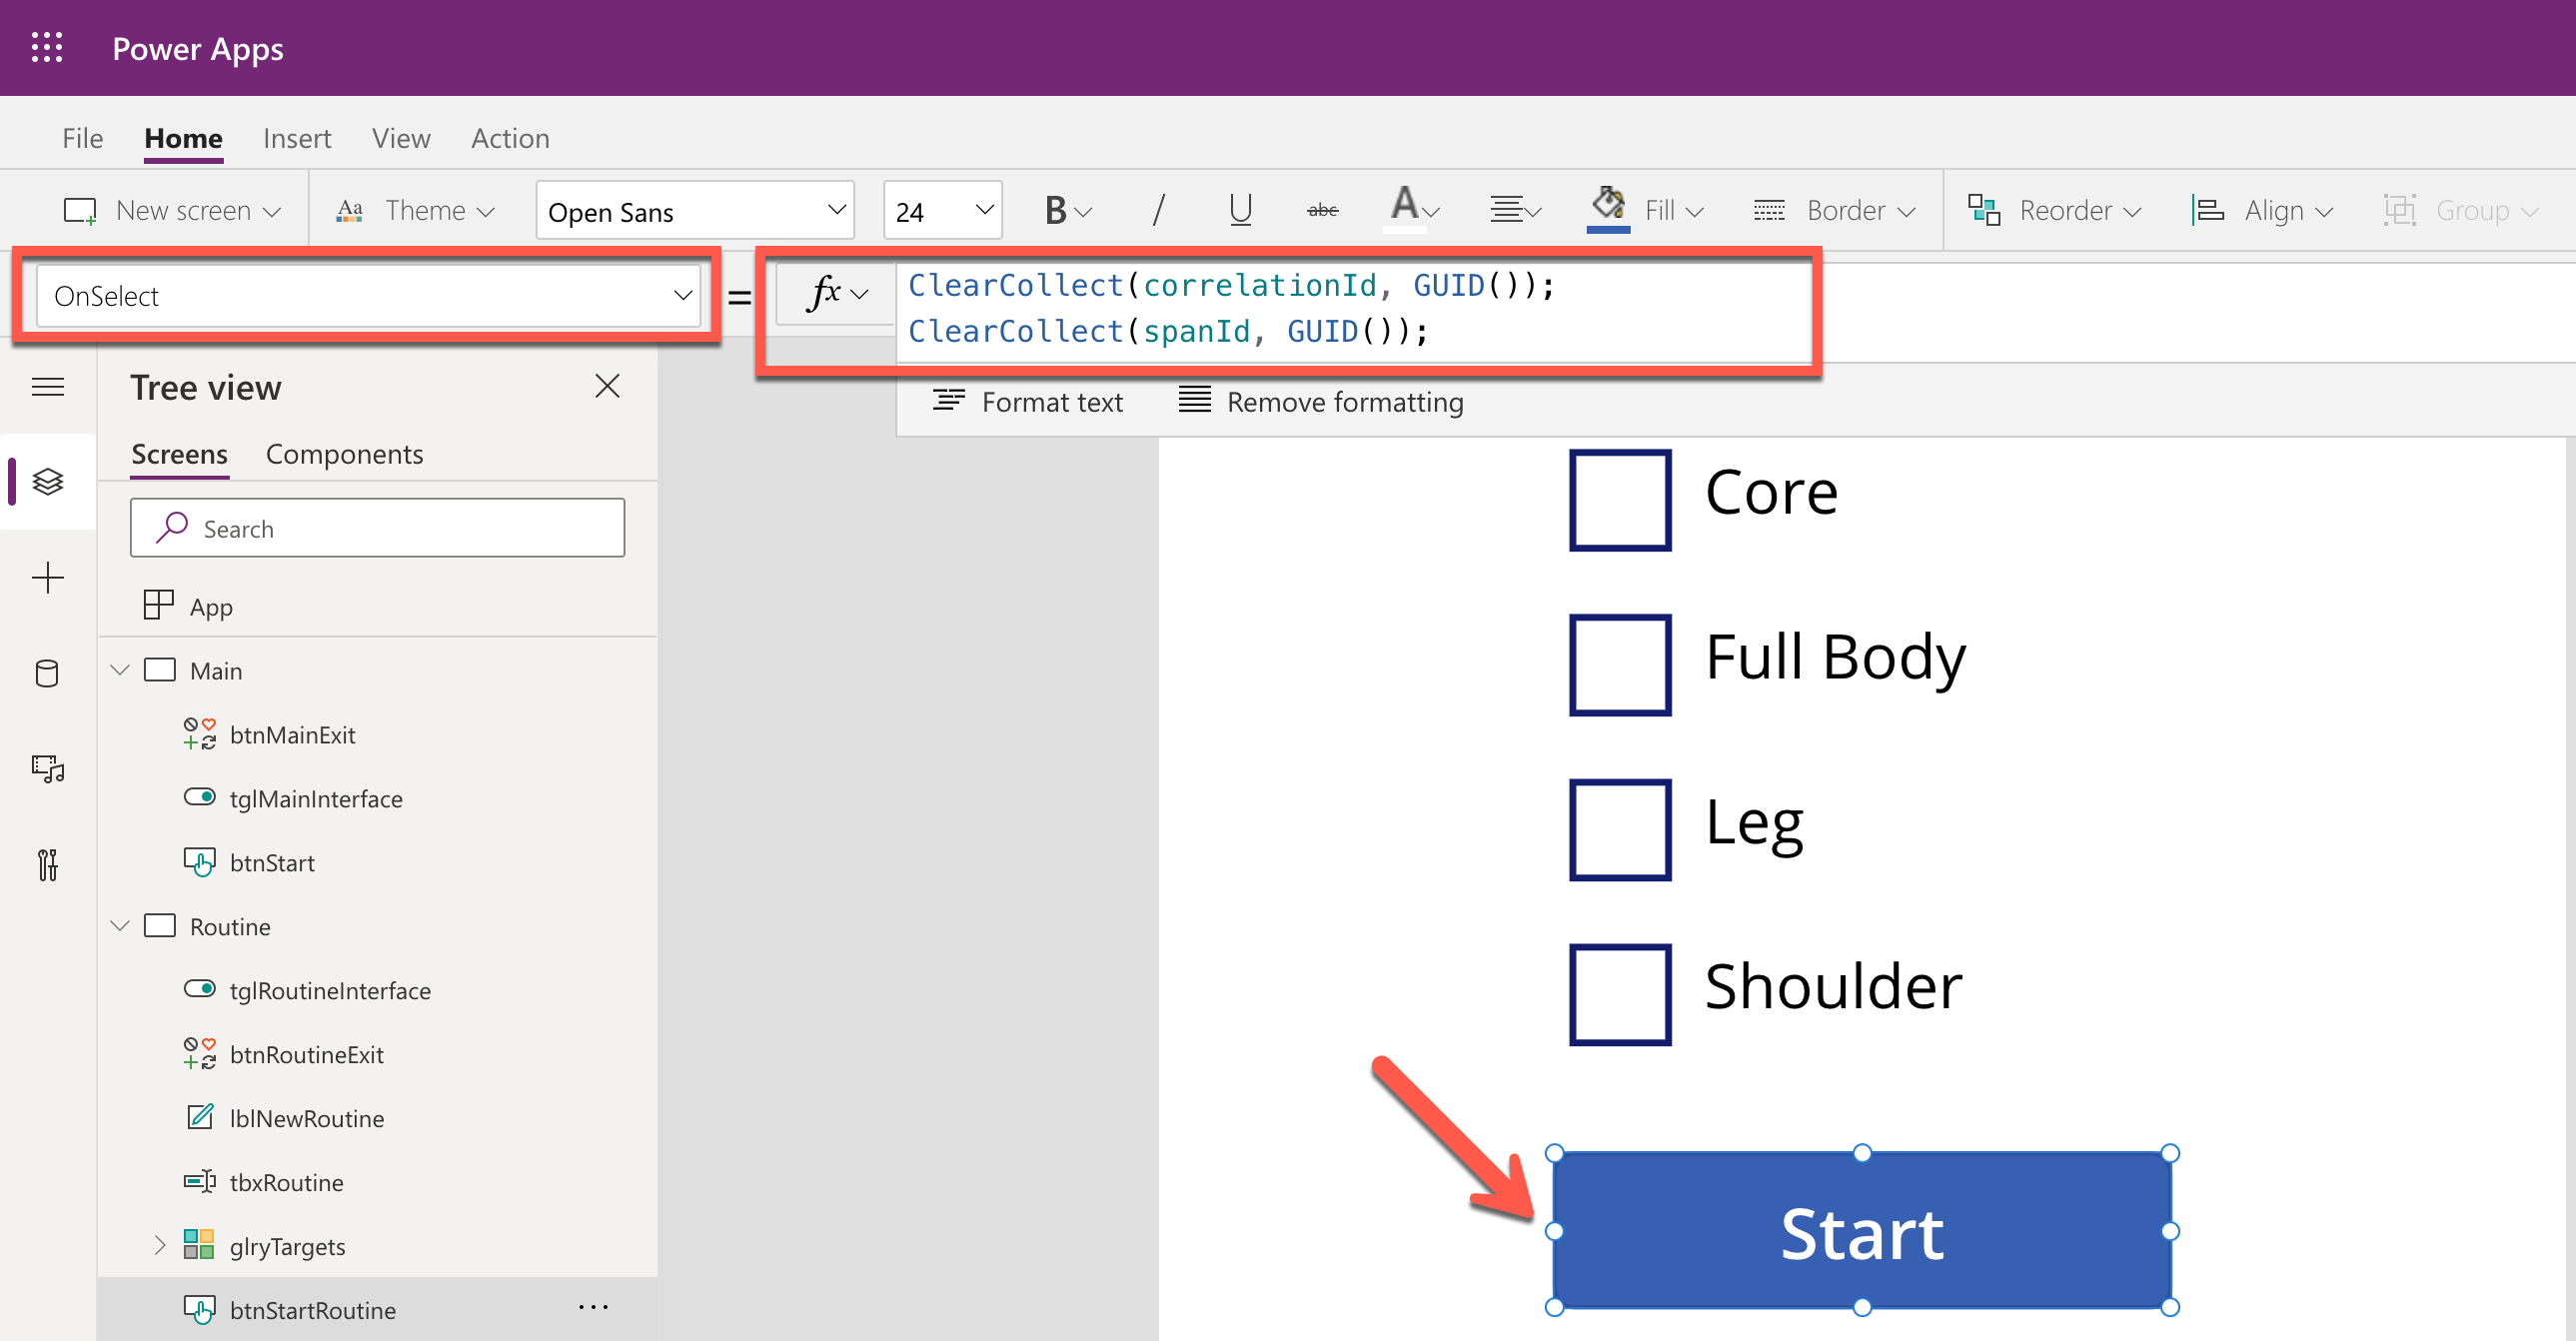
By doing so, you know the tracing starts from the Power Apps app side while monitoring, and the first Span starts from it as well. Both correlationId and spanId travels until the publish action is completed. Moreover, the correlationId is transferred to the other Span through the Span Context.
Backend Update
As long as the Azure Functions app knows the instrumentation key from an Application Insights instance, it traces almost everything. OpenTelemetry.NET is one of the Open Telemetry implementations, which has recently released v1.0 for tracing. Both metrics and logging are close to GA. However, it doesn’t work well with Azure Functions. Therefore, in this post, let’s manually implement the tracing at the log level, which is sent to Application Insights.
Publisher – HTTP Trigger
When do we take the log?
In this example, the backend APIs consist of routine, exercise and publish actions. Each action stores data to Azure Table Storage, by following the event sourcing approach. So, it’s good to take logs around the data handling as checkpoints. In addition to that, while invoking the publish action, it aggregates the data stored from the previous actions and sends the one to Azure Service Bus, which is another good point that takes the log as a checkpoint.
All the logging features used in Azure Functions implement the ILogger interface. Through this interface, you can store custom telemetry values to Application Insights. Then, what could be the values for the custom telemetry?
- Event Type: Action and its invocation result –
RoutineReceived, ExerciseCreated or MessageNotPublished
- Event Status: Success or failure of the event –
Succeeded or Failed
- Event ID: Azure Functions invocation ID – whenever a new request comes in a new GUID is assigned.
- Span Type: Type of Span –
Publisher or Subscriber
- Span Status: Current Span status –
PublisherInitiated, SubscriberInProgress or PublisherCompleted
- Span ID: GUID assigned to Span each time it is invoked
- Interface Type: Type of user interface –
Test Harness or Power Apps App
- Correlation ID: Unique ID for the whole Trace
It could be the bare minimum stored to Application Insights. Once you capture them, you will be able to monitor in which trace (correlation ID) the data flow through which user interface (interface type), span (span type), and event (event type) successfully or not (event status).
Here’s the extension method for the ILogger interface. Let’s have a look at the sample code below that checks in the request data from Power Apps is successfully captured on the routine action. Both correlationId and spanId are sent from Power Apps (line #9-10). The invocationId fro the Azure Functions context has become the eventId (line #12). Finally, event type, event status, span type, span status, interface type and correlation ID are logged (line #14-17).
public async Task<IActionResult> CreateRoutineAsync(

    [HttpTrigger(AuthorizationLevel.Function, HttpVerbs.Post, Route = “routines”)] HttpRequest req,

    ExecutionContext context,

    ILogger log)

{

    var request = await req.ToRequestMessageAsync<RoutineRequestMessage>().ConfigureAwait(false);

    var @interface = request.Interface;
    var correlationId = request.CorrelationId;

    var spanId = request.SpanId;
    var eventId = context.InvocationId;
    log.LogData(LogLevel.Information, request,

                EventType.RoutineReceived, EventStatusType.Succeeded, eventId,

                SpanType.Publisher, SpanStatusType.PublisherInitiated, spanId,

                @interface, correlationId);
    …

}
The code below shows another checkpoint. Store the request data to Azure Table Storage (line #14). If it’s successful, log it (line #18-23). If not, throw an exception, handle it and log the exception details (line #29-34).
public async Task<IActionResult> CreateRoutineAsync(

    [HttpTrigger(AuthorizationLevel.Function, HttpVerbs.Post, Route = “routines”)] HttpRequest req,

    ExecutionContext context,

    ILogger log)

{

    …
    try

    {

        …
        await this._client.CreateTableIfNotExistsAsync(this._settings.GymLog.StorageAccount.Table.TableName).ConfigureAwait(false);

        var table = this._client.GetTableClient(this._settings.GymLog.StorageAccount.Table.TableName);

        var response = await table.UpsertEntityAsync(entity).ConfigureAwait(false);
        …
        log.LogData(response.Status.ToLogLevel(), res.Value,

                    EventType.RoutineCreated, EventStatusType.Succeeded, eventId,

                    SpanType.Publisher, SpanStatusType.PublisherInProgress, spanId,

                    @interface, correlationId,

                    clientRequestId: response.ClientRequestId,

                    message: response.Status.ToResponseMessage(res));

    }

    catch (Exception ex)

    {

        …
        log.LogData(LogLevel.Error, res.Value,

                    EventType.RoutineNotCreated, EventStatusType.Failed, eventId,

                    SpanType.Publisher, SpanStatusType.PublisherInProgress, spanId,

                    @interface, correlationId,

                    ex: ex,

                    message: ex.Message);

    }
    …

}
In similar ways, the other exercise and publish actions capture the checkpoint logs.
Publisher – Span Context
The publish action in the Publisher Span doesn’t only capture the checkpoint log, but it should also implement Span Context. Span Context contains metadata for tracing, like correlation ID. Depending on the message transfer method, use either the HTTP request header or message envelope. As this system uses Azure Service Bus, use the ApplicationProperties dictionary in its message envelope.
Let’s have a look at the code for the publish action. This part describes that the message body is about the workout details (line #23-24). Other data is stored to CorrelationId and MessageId properties of the message object (line #26-27) and the ApplicationProperties dictionary so that the subscriber application makes use of them (line #30-33). Finally, after sending the message to Azure Service Bus, capture another checkpoint that message has been successfully sent (line #37-42).
public async Task<IActionResult> PublishRoutineAsync(

    [HttpTrigger(AuthorizationLevel.Function, HttpVerbs.Post, Route = “routines/{routineId}/publish”)] HttpRequest req,

    Guid routineId,

    ExecutionContext context,

    [ServiceBus(GymLogTopicKey)] IAsyncCollector<ServiceBusMessage> collector,

    ILogger log)

{

    var request = await req.ToRequestMessageAsync<PublishRequestMessage>().ConfigureAwait(false);

    var @interface = request.Interface;
    var correlationId = request.CorrelationId;

    var spanId = request.SpanId;
    var eventId = context.InvocationId;
    try

    {

        …
        var messageId = Guid.NewGuid();

        var subSpanId = Guid.NewGuid();

        var timestamp = DateTimeOffset.UtcNow;

        var message = (RoutineQueueMessage)(PublishResponseMessage)res.Value;

        var msg = new ServiceBusMessage(message.ToJson())

        {

            CorrelationId = correlationId.ToString(),

            MessageId = messageId.ToString(),

            ContentType = ContentTypes.ApplicationJson,

        };

        msg.ApplicationProperties.Add(“pubSpanId”, spanId);

        msg.ApplicationProperties.Add(“subSpanId”, subSpanId);

        msg.ApplicationProperties.Add(“interface”, @interface.ToString());

        msg.ApplicationProperties.Add(“timestamp”, timestamp.ToString(CultureInfo.InvariantCulture));
        await collector.AddAsync(msg).ConfigureAwait(false);
        log.LogData(LogLevel.Information, msg,

                    EventType.MessagePublished, EventStatusType.Succeeded, eventId,

                    SpanType.Publisher, SpanStatusType.PublisherInProgress, spanId,

                    @interface, correlationId,

                    messageId: messageId.ToString(),

                    message: EventType.MessagePublished.ToDisplayName());
        …

    }

    catch (Exception ex)

    {

        …

    }
    …

}
Subscriber – Service Bus Trigger
As the tracing metadata is transferred from Publisher via Span Context, Subscriber simply uses it. The following code describes how to interpret the message envelop. Restore the correlation ID (line #10) and Message ID (line #13). And capture another checkpoint whether the message restore is successful or not (line #16-19).
public async Task IngestAsync(

    [ServiceBusTrigger(GymLogTopicKey, GymLogSubscriptionKey)] ServiceBusReceivedMessage msg,

    ExecutionContext context,

    ILogger log)

{

    …
    var @interface = Enum.Parse<InterfaceType>(msg.ApplicationProperties[“interface”] as string, ignoreCase: true);
    var correlationId = Guid.Parse(msg.CorrelationId);

    var spanId = (Guid)msg.ApplicationProperties[“subSpanId”];
    var messageId = Guid.Parse(msg.MessageId);

    var eventId = context.InvocationId;
    log.LogData(LogLevel.Information, message,

                EventType.MessageReceived, EventStatusType.Succeeded, eventId,

                SpanType.Subscriber, SpanStatusType.SubscriberInitiated, spanId,

                @interface, correlationId);
    …

}
Then, store the message to Azure Cosmos DB (line #12), log another checkpoint (line #16-21). If there’s an error while processing the message, handle the exception and capture the checkpoint as well (line #25-30).
public async Task IngestAsync(

    [ServiceBusTrigger(GymLogTopicKey, GymLogSubscriptionKey)] ServiceBusReceivedMessage msg,

    ExecutionContext context,

    ILogger log)

{

    …
    try

    {

        …
        var response = await container.UpsertItemAsync<RoutineRecordItem>(record, new PartitionKey(record.ItemType.ToString())).ConfigureAwait(false);
        …
        log.LogData(LogLevel.Information, message,

                    EventType.MessageProcessed, EventStatusType.Succeeded, eventId,

                    SpanType.Subscriber, SpanStatusType.SubscriberCompleted, spanId,

                    @interface, correlationId,

                    recordId: record.EntityId.ToString(),

                    message: response.StatusCode.ToMessageEventType().ToDisplayName());

    }

    catch (Exception ex)

    {

        log.LogData(LogLevel.Error, message,

                    EventType.MessageNotProcessed, EventStatusType.Failed, eventId,

                    SpanType.Subscriber, SpanStatusType.SubscriberCompleted, spanId,

                    @interface, correlationId,

                    ex: ex,

                    message: ex.Message);
        …

    }

}
So far, all paths the data sways have been marked as checkpoints and store the check-in log to Application Insights. Now, how can we check all the traces on Azure Monitor?
KUSTO Query on Azure Monitor
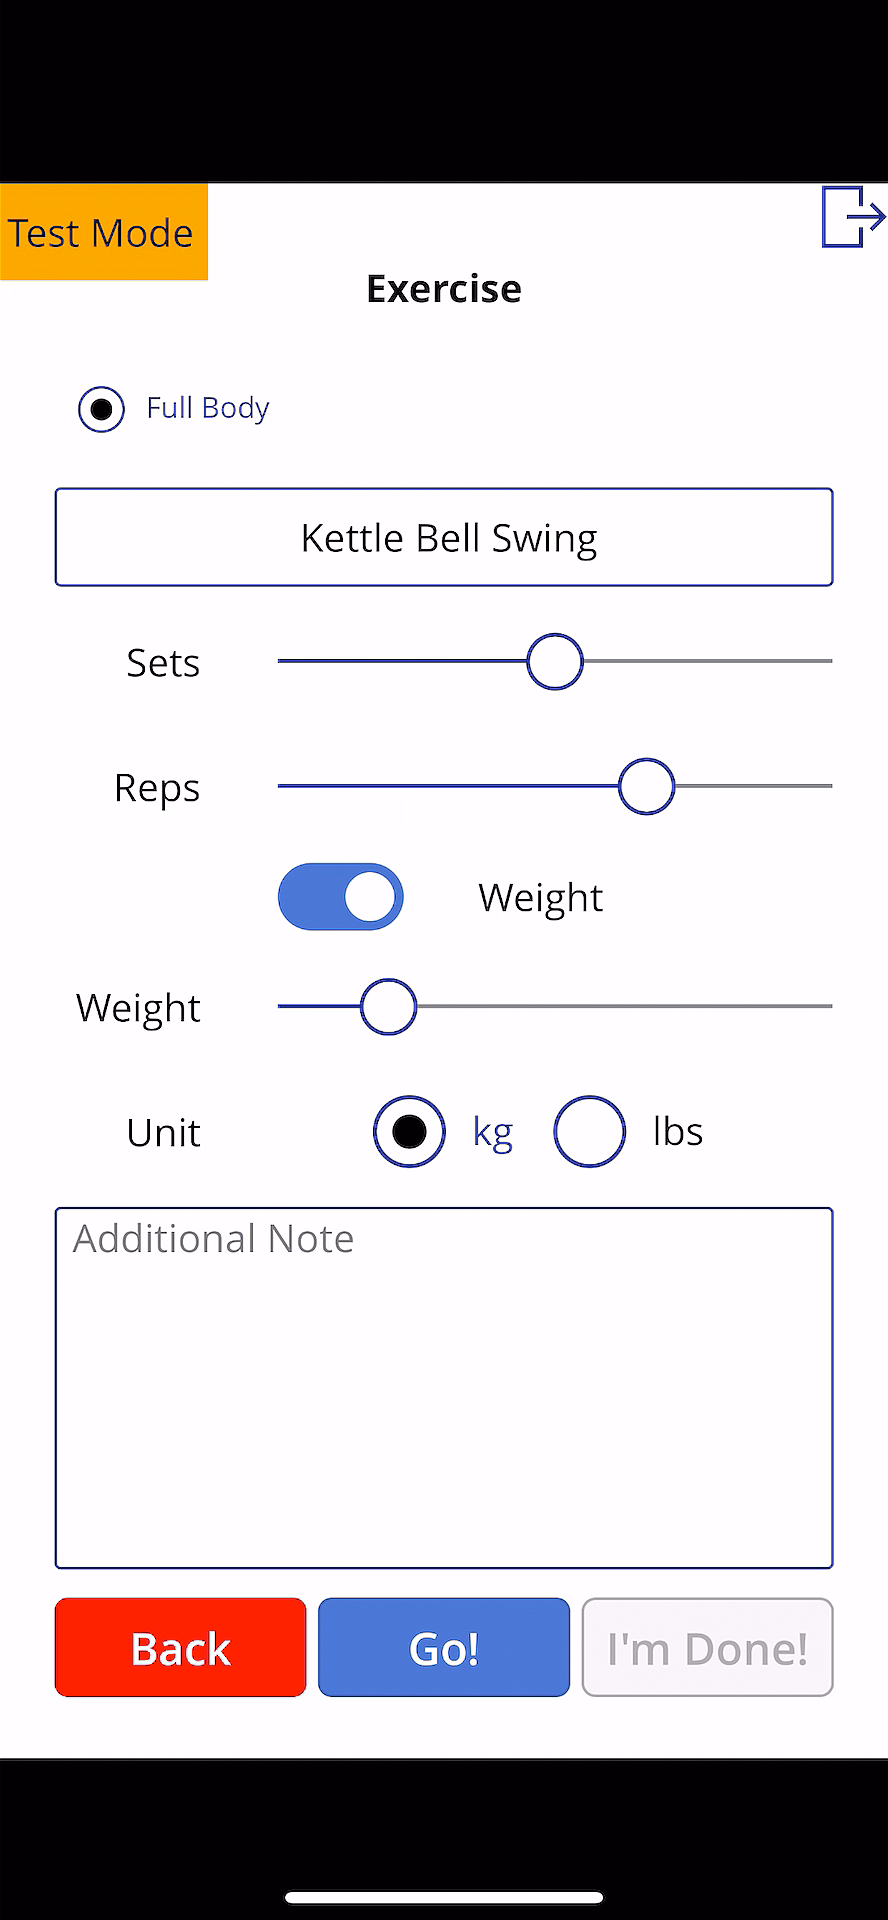
This time, Ji Min received another feedback that a new error has occurred while storing the workout details with screenshots.
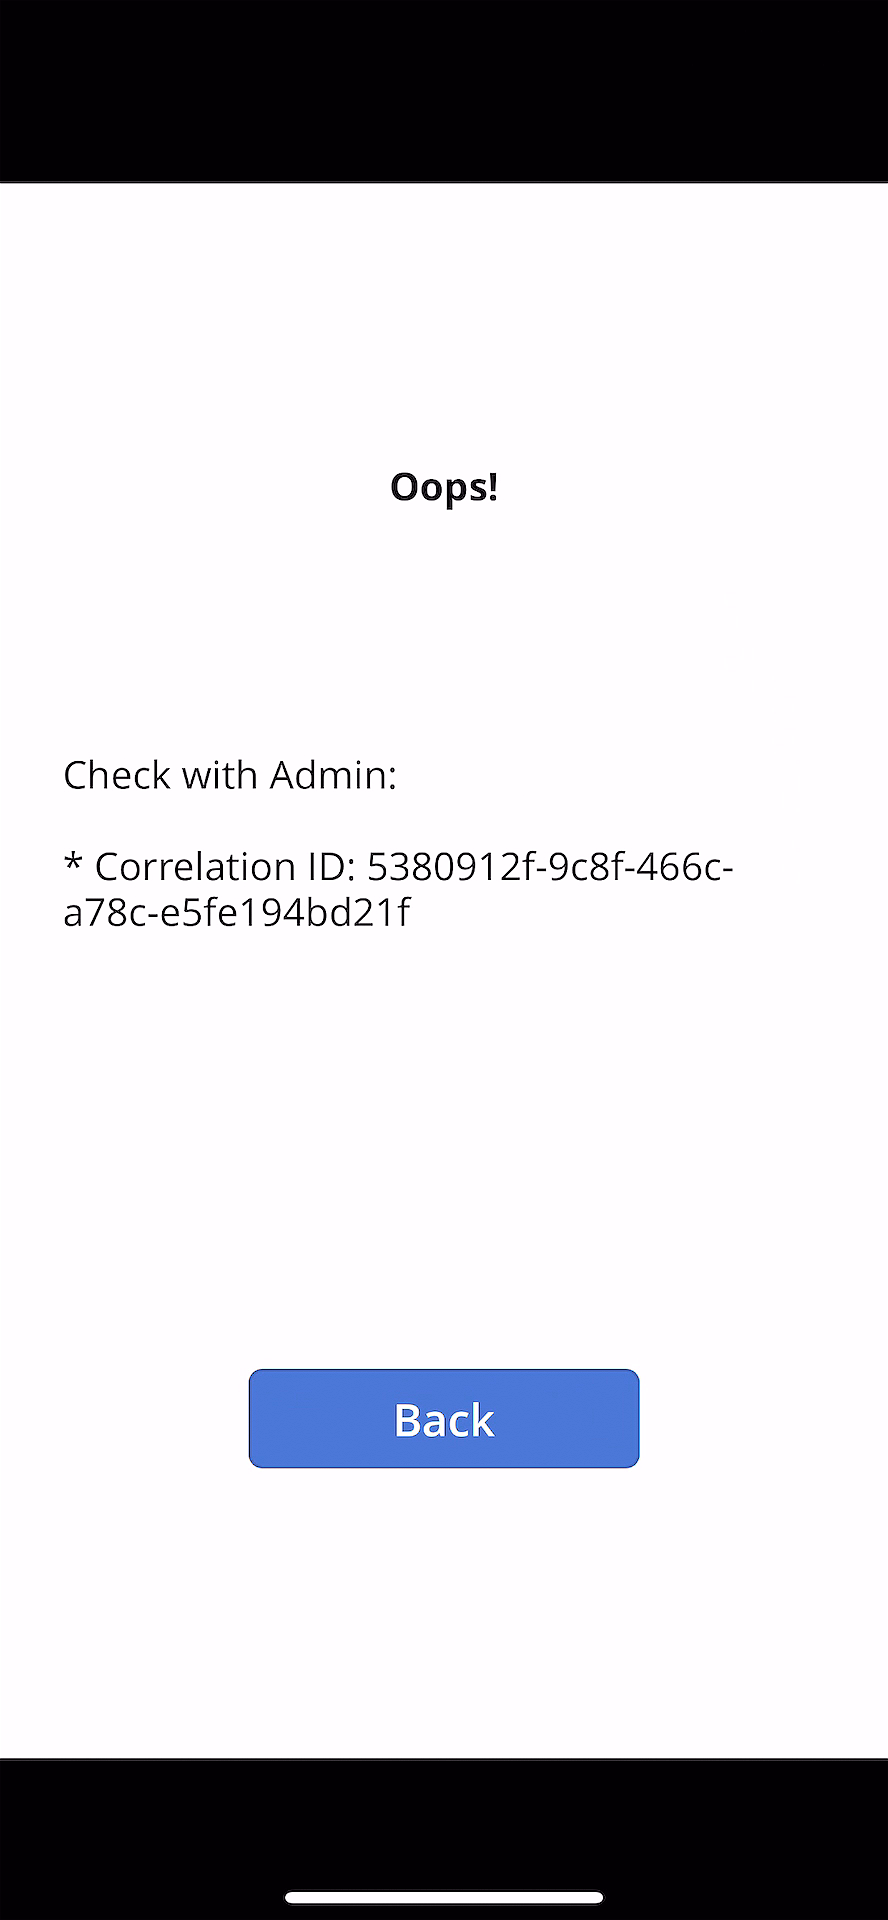
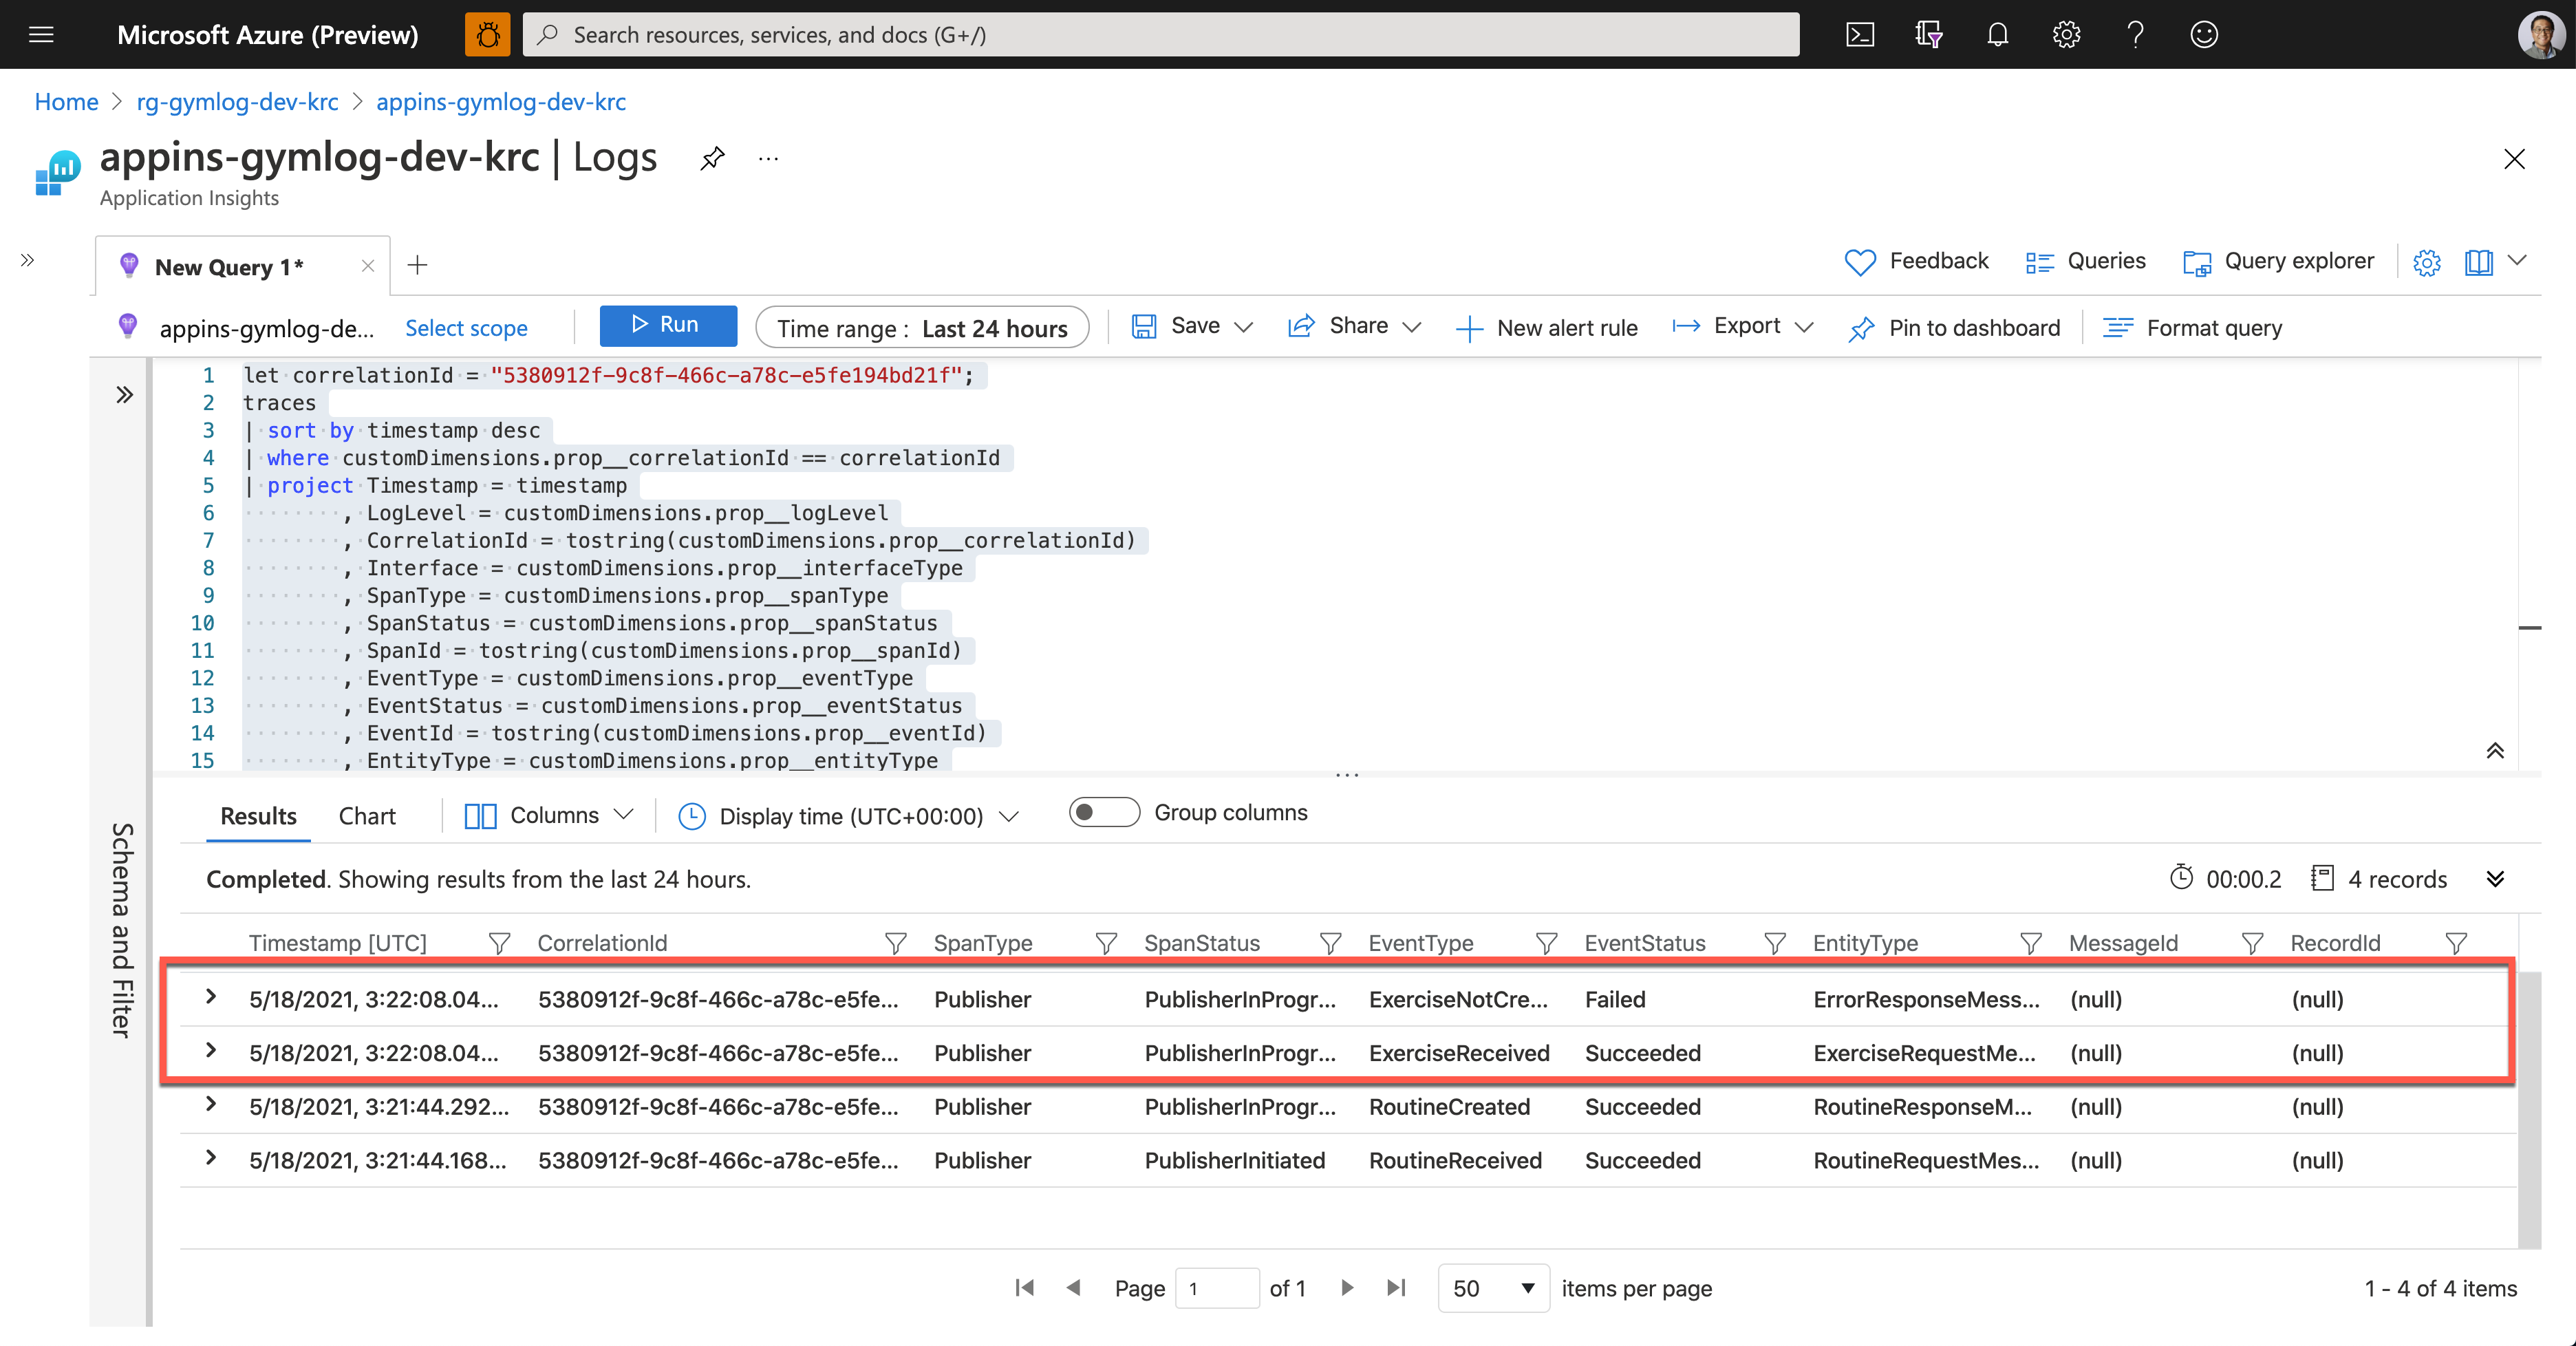
As soon as Ji Min shared the pictures with Su Bin, Su Bin wrote a Kusto query and ran it on Application Insights. Assign the correlationId value for tracing (line #1). Then use the custom telemetry values for the query. As all the custom properties start with customDimensions.prop__, include them in the where clause with the correlation ID for filtering (line #4), and in the project clause to select fields that I want to see (line #5-18).
let correlationId = “5380912f-9c8f-466c-a78c-e5fe194bd21f”;

traces

| sort by timestamp desc

| where customDimensions.prop__correlationId == correlationId

| project Timestamp = timestamp

          , LogLevel = customDimensions.prop__logLevel

          , CorrelationId = tostring(customDimensions.prop__correlationId)

          , Interface = customDimensions.prop__interfaceType

          , SpanType = customDimensions.prop__spanType

          , SpanStatus = customDimensions.prop__spanStatus

          , SpanId = tostring(customDimensions.prop__spanId)

          , EventType = customDimensions.prop__eventType

          , EventStatus = customDimensions.prop__eventStatus

          , EventId = tostring(customDimensions.prop__eventId)

          , EntityType = customDimensions.prop__entityType

          , ClientRequestId = customDimensions.prop__clientRequestId

          , MessageId = customDimensions.prop__messageId

          , RecordId = customDimensions.prop__recordId

| project Timestamp

          , CorrelationId

          , SpanType

          , SpanStatus

          , EventType

          , EventStatus

          , EntityType

          , MessageId

          , RecordId
And here’s the query result. It says it was OK to receive the exercise data, but it failed to store it to Azure Table Storage.
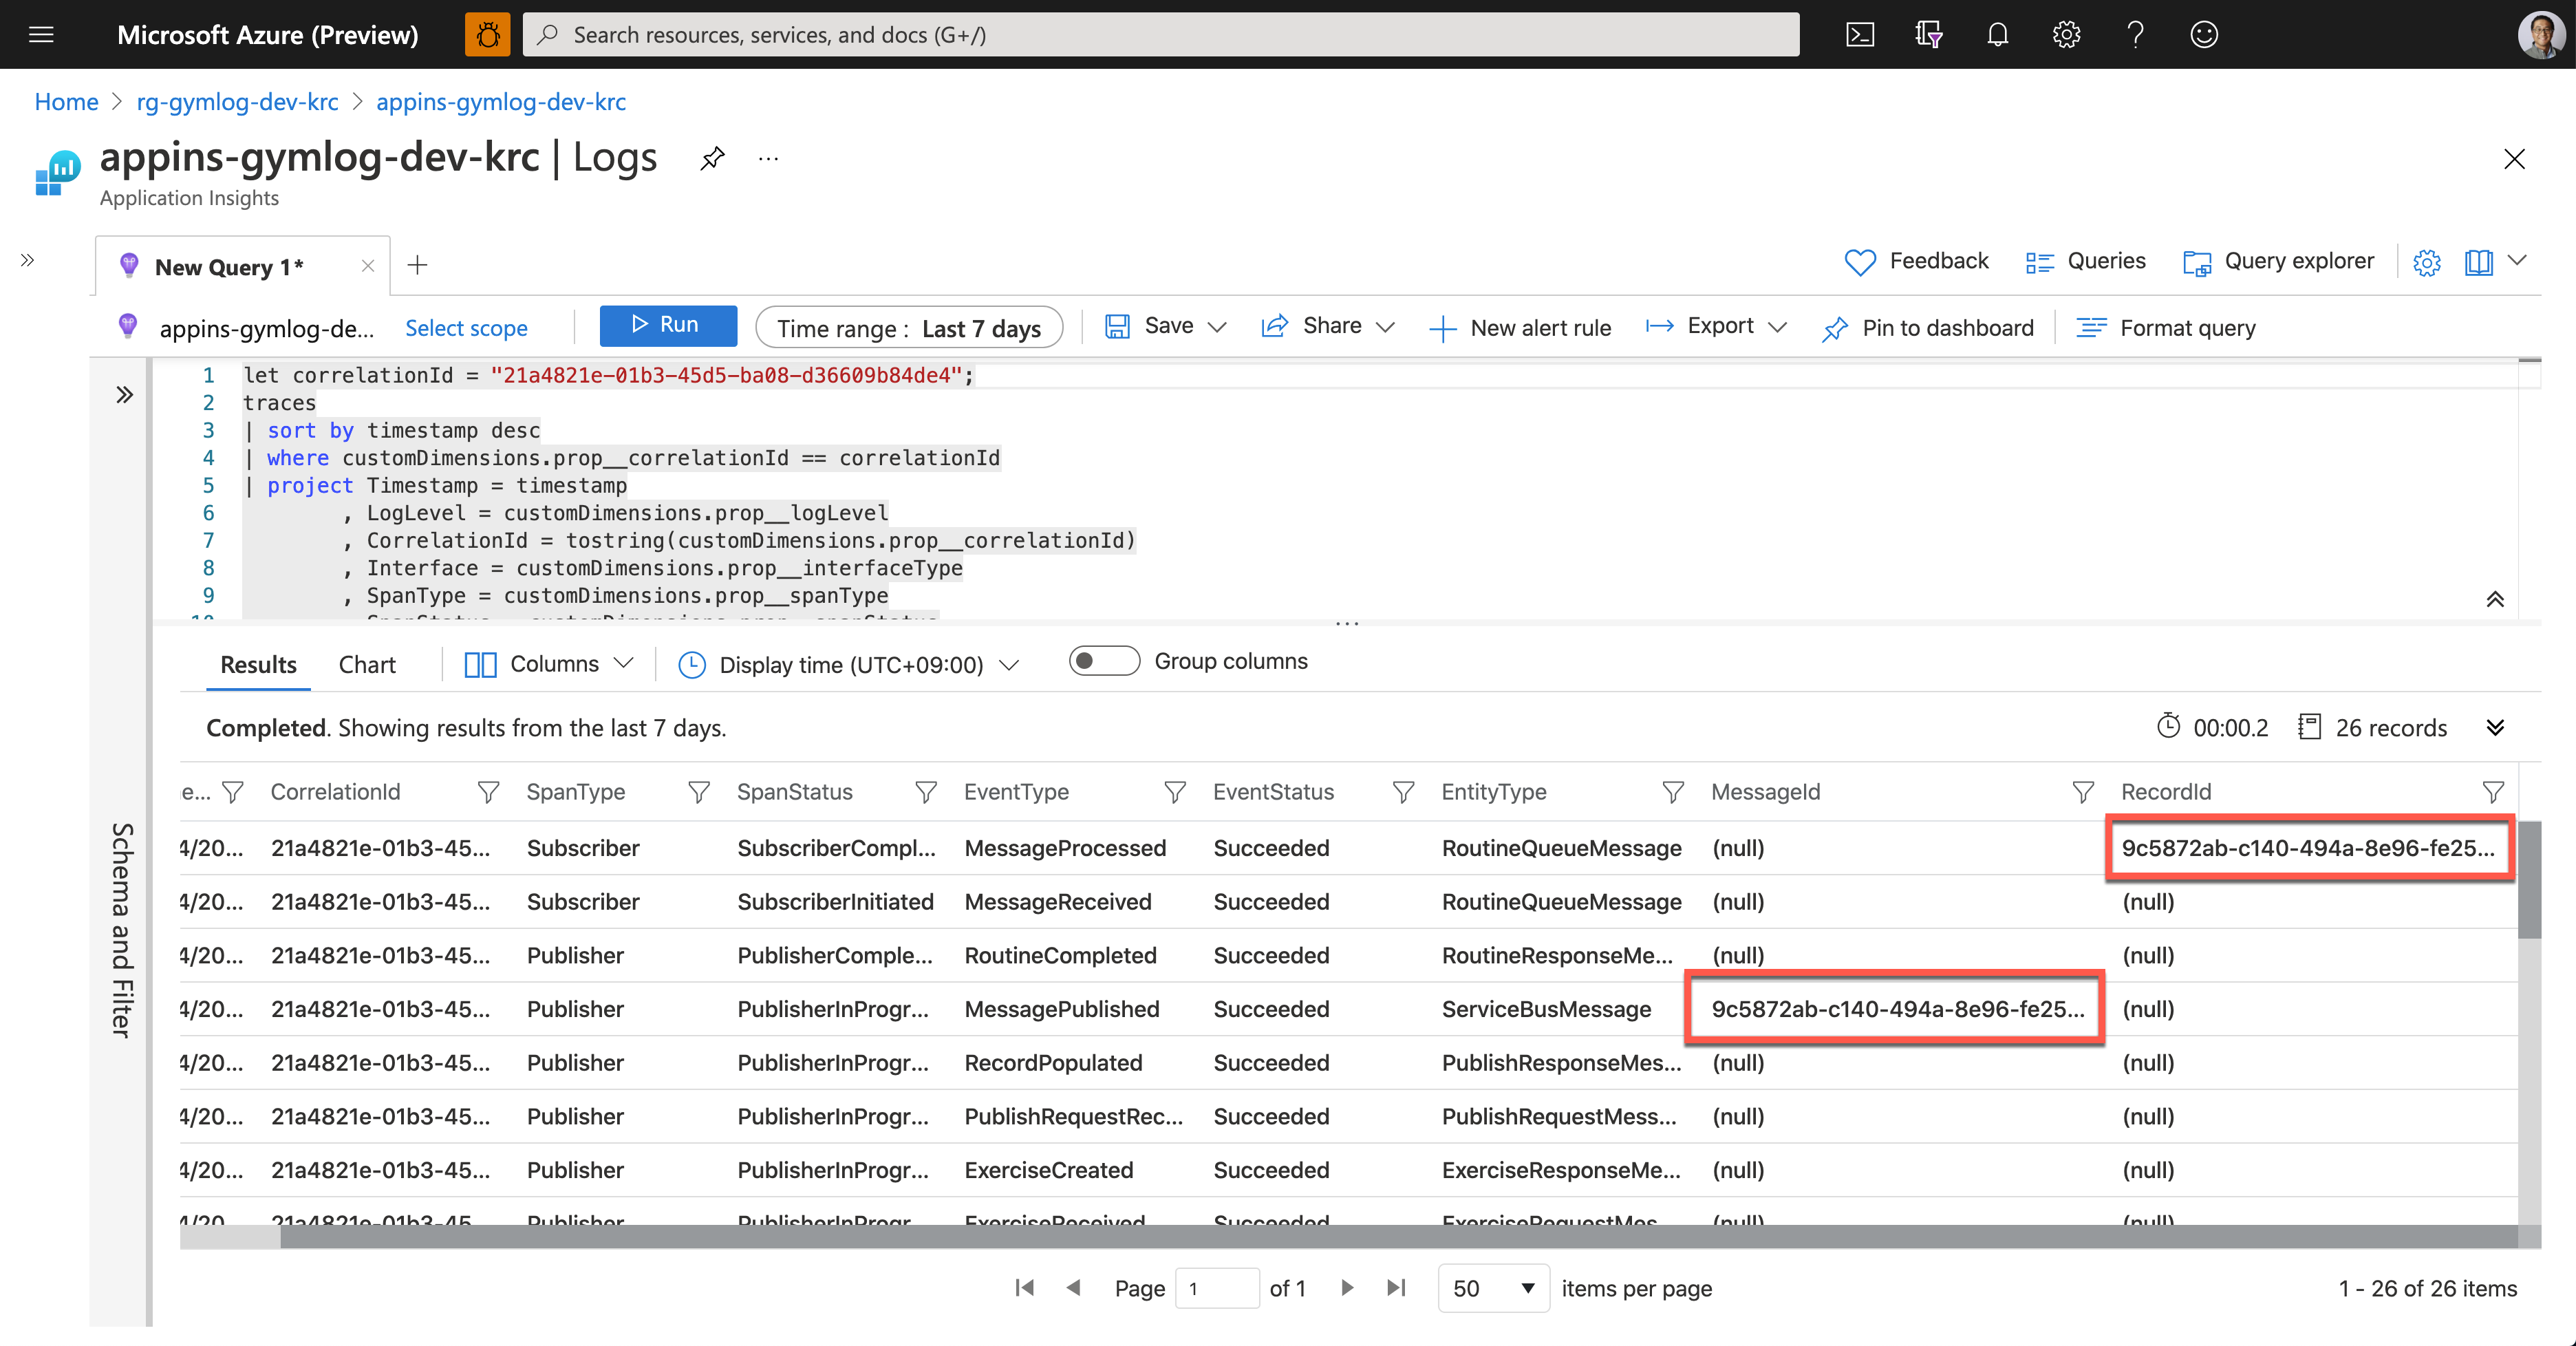
Now, Su Bin found out where the error has occurred. She fixed the code and deployed the API again, and all is good! The following screenshot shows one of the successful end-to-end tracking logs. A Message sent from Publisher has processed well on the Subscriber side, and the message has become a record based on the logic implemented on the Subscriber side.
So, we confirm that the data tracing logic has been implemented by following the Open Telemetry concepts through Application Insights. Ji Min and her trainer crews, and all the members in the gym are now able to know the reference ID for tracing.
So far, we’ve walked through the implementation of data tracing logic with the concept of Open Telemetry, from Power Apps to Cosmos DB through Application Insights.
Unfortunately, the OpenTelemetry.NET doesn’t work in Azure Functions as expected for now. But we can still implement the concept through Application Insights for the time being. In the next post, let’s try the DevOps journey with Power Apps.
This article was originally published on Dev Kimchi.

by Contributed | May 24, 2021 | Technology
This article is contributed. See the original author and article here.
Guest Blog by Ken Birman, N. Rama Rao Professor of Computer Science, Cornell University

At Cornell University, we have a long history in the area of “cloud computing” – dating back to before the subject even had that name!
I’m Ken Birman, and I’ve been involved in distributed computing and scalability from the early days. Back in the 1990’s, I created the first widely impactful software for fault-tolerant, scalable, consistent computing and data management, and my work was used very broadly. Even now, if you fly into Europe there is a good chance that the air traffic control system guiding your plane uses an architecture (and software) I created. For a decade my software ran the New York Stock Exchange and Swiss Stock Exchange without a single unmanaged fault – the code was designed to self-heal – and quite a few companies (including Microsoft) use my technology in their data-center management layers.
My students did well too: Ranveer Chandra is Microsoft’s Chief Scientist for Azure Global (and also the lead researcher for networking, and for IoT computing on smart farms). Werner Vogels is CTO at Amazon, and Dahlia Malkhi leads in the development of Facebook’s Diem digital currency.
So, it seemed natural to create a graduate course on cloud computing, to educate the next generation of developers, entrepreneurs, and leaders. When planning CS5412, “Topics in Cloud Computing”, I knew that hands-on experience would be key, and was fortunate to be offered tremendous support by Microsoft’s academic liaison group, along with Azure computing resources for our class projects. At the same time, I wanted to give the students a focus and concrete scenarios, which led me to partner with Cornell’s ANSC 3510, a course focused on technology in dairy farming. Working with Professor Julio Giordano, who created that course, we’ve created a unique structure in which two completely different classes are able to team up (using Microsoft Teams, of course!) to jointly create projects that demonstrate the power of cutting edge IoT infrastructures backed by Azure cloud ML and AI.

A few examples will help set the context (all the student groups define individualized projects, so these are really two of many). When cows enter a dairy to be milked, a procession of as many as 500 animals will move from outside in the field into the milking area of the barn through a series of side-by-side corridors. By installing cameras, we can photograph the animals as they pass through. With cloud computing tools, my students are able to identify the animal (RFID tags should make this easy, but in fact they often fall off or are difficult to ping in crowded settings), assess the health of each animal, decide if the cow needs to be routed into the “cow wash” before milking etc. One project looks at this specific question, hosting the solution on Azure IoT Edge.

A second project focused on building a highly flexible dairy dashboard for the farmer, tracking a variety of milk quality, quantity and safety properties while also providing an integrated perspective on the herd as a whole, dairy product price trends, and even allowing the farmer to zoom in and look at health statistics for individual animals. Automated notifications alert the farmer if a cow is close to calving or needs to see a vet for some other reason. Yet a third project looks at integrating data from diverse sources, such as weather predictions, farm-soil moisture levels and imaging to predict risk factors such as outbreaks of pathogens. A farmer warned of trouble three weeks from now might have time to bring the crop in a little early, before the pathogen gains a toehold.

What I find exciting about these projects is that they bring my cloud computing students into real-world settings. In teams of two or three, students from my cloud computing class partner with Professor Giordano’s students to understand the kinds of data available and to appreciate the proper way to approach technical questions seen on dairy farms. They work together to map these questions to ML, decide how to train the models, and even collaborate to design dashboards that visualize the outcomes of the analysis. Meanwhile, Professor Giordano’s animal science students, who come to these partnerships with a lot of knowledge about modern dairies and modern AI, learn about the challenges of putting those tools to work to create useful new technology, and are exposed to the power (and limitations) of the Azure cloud. As a side-effect, by working with Microsoft Teams, the groups also become comfortable with cutting-edge collaboration technology.
My approach in CS5412 has been to design to the course around three central goals. First, I do want my students to appreciate the relevant computer science foundations: topics such as state machine replication (Paxos), leader election, and fault-tolerant consensus. Second, it is important for them to learn to view the cloud as a platform with powerful, inherently scalable services such as CosmosDB, the Azure Blob Store and Azure Data Lake at their disposal, along with powerful computing frameworks like the Azure Intelligence Platform and Cognitive Search. These in turn center on fundamental practical questions, such as understanding data and computation sharding for scalability, and appreciating the roles of the IoT Hub and its integration with Azure Functions.
Last is the practical goal of becoming proficient with the actual tools: Any student who “survives” my course emerges as a capable cloud programmer with a valuable skill set coupled to an understand of how the Azure documentation and prebuilt “recipes” can lead to customizable code frameworks ideally fitted to their needs.
It has taken us many years to evolve CS5412 to the current state, but today I feel as if my students really learn the right material, that the partnership with Animal Sciences is operating smoothly and bringing really high value to the table, and that the course is simply working very well. My textbook, written in 2010, probably needs a thorough revision at this point, but on the other hand, modern students don’t really read textbooks! What they do read is online material, especially coupled with “how-to” videos and even hands-on opportunities, and on this, Microsoft has excelled.
The documentation available is outstanding, but beyond that, Microsoft has participated in Cornell’s Digital Agriculture Hackathons (the CIDA Hackathon), and my students find this to be a fantastic resource. During a February weekend students come together to learn how cloud computing can solve problems in agriculture, looking at technical but also social and economic/business perspectives, with hands-on instruction by Microsoft experts.
CS5412 has become a real treasure here at Cornell, and is helping position our students to hit the ground running as they enter the workforce. We couldn’t have done it without Microsoft Azure and Microsoft Teams, and are tremendously grateful for the partnership opportunity!

Recent Comments