by Contributed | Jul 19, 2021 | Technology
This article is contributed. See the original author and article here.
The use case is as follows: I have water meter telemetry I would like to do analytics on.
Events are ingested from water meters and collected into a data lake in parquet format. The data is partitioned by Year, Month and Day based on the timestamp contained in the events themselves and not based on the time of the event processing in ASA as this is a frequent requirement.
Events are sent from the on premise SCADA systems to Event Hub then processed by Stream Analytics which then can easily:
- Convert events sent in JSON format into partitioned parquet.
- Portioning is based on Year/Month/Day.
- Date used for partitioning is coming from within the event.
The result can immediately be queried with serverless Synapse SQL pool.
Input Stream
My ASA input stream named inputEventHub is plugged into an Event Hub in JSON format.
Output Stream
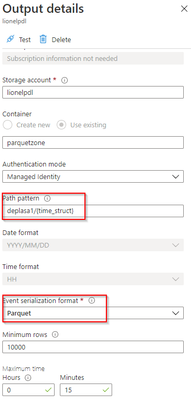
The output stream is the interesting part and will define the partition scheme:
We see that its path pattern is based on a pseudo column named “time_struct” and all the partitioning logic is in the construct of this pseudo column.
Let’s have a look at the ASA query:


We can see now that the pseudo_column time_struct contains the path, ASA understands it and processes it literally including the “/” sign.
Here is the query code:
select
    concat('year=',substring(createdAt,1,4),'/month=',substring(createdAt,6,2),'/day=',substring(createdAt,9,2)) as time_struct,
    eventId,
    [type],
    deviceId,
    deviceSequenceNumber,
    createdAt,
    Value,
    complexData,
    EventEnqueuedUtcTime AS enqueuedAt,
    EventProcessedUtcTime AS processedAt,
    cast(UDF.GetCurrentDateTime('') as datetime) AS storedAt,
    PartitionId
into
    [lionelpdl]
from
    [inputEventHub]
After few days of processing the output folder looks like this as a result:


Query results with serveless SQL and take advantage of partitioning
Now I can directly query my Output Stream with serverless SQL:

We can also notice that the metadata functions are fully functional without any additional work. For example I can run the following query using filepath metadata function:
  SELECT top 100
    [result].filepath(1) AS [year]
    ,[result].filepath(2) AS [month]
    ,[result].filepath(3) AS [day]
    ,*
FROM
    OPENROWSET(
        BULK 'https://lionelpdl.dfs.core.windows.net/parquetzone/deplasa1/year=*/month=*/day=*/*.parquet',
        FORMAT='PARQUET'
    ) AS [result]

where [result].filepath(2)=6
  and [result].filepath(3)=23
Spark post processing
Finally, to optimize my query performance I can schedule a Spark job which processes daily all events from the previous day, compacts them into fewer and larger parquet files.
As an example, I’ve decided to rebuild the partitions with files containing 2 million rows.
Here are 2 versions of the same code:
PySpark notebook (for interactive testing for instance)
from pyspark.sql import SparkSession
from pyspark.sql.types import *
from functools import reduce
from pyspark.sql import DataFrame
import datetime

account_name = "storage_account_name"
container_name = "container_name"
source_root = "source_directory_name"
target_root = "target_directory_name"
days_backwards = 4 #number of days from today, typicaly, as a daily job it'll be set to 1
adls_path = 'abfss://%s@%s.dfs.core.windows.net/%s' % (container_name, account_name, source_root)

hier = datetime.date.today() - datetime.timedelta(days = days_backwards)
day_to_process = '/year=%04d/month=%02d/day=%02d/' % (hier.year,hier.month,hier.day)
file_pattern='*.parquet'

print((adls_path + day_to_process + file_pattern))

df = spark.read.parquet(adls_path + day_to_process + file_pattern)

adls_result = 'abfss://%s@%s.dfs.core.windows.net/%s' % (container_name, account_name, target_root)

print(adls_result + day_to_process + file_pattern)

df.coalesce(1).write.option("header",True)
        .mode("overwrite")
        .option("maxRecordsPerFile", 2000000)
        .parquet(adls_result + day_to_process)
Spark job (with input parameters scheduled daily)

import sys
import datetime
from pyspark import SparkContext, SparkConf
from pyspark.sql import SparkSession
from pyspark.sql.types import *
from functools import reduce
from pyspark.sql import DataFrame

if __name__ == "__main__":

	# create Spark context with necessary configuration
	conf = SparkConf().setAppName("dailyconversion").set("spark.hadoop.validateOutputSpecs", "false")
	sc = SparkContext(conf=conf)
	spark = SparkSession(sc)

	account_name = sys.argv[1] #'storage_account_name'
	container_name = sys.argv[2] #"container_name"
	source_root = sys.argv[3] #"source_directory_name"
	target_root = sys.argv[4] #"target_directory_name"
	days_backwards = sys.argv[5] #number of days backwards in order to reprocess the parquet files, typically 1

	hier = datetime.date.today() - datetime.timedelta(days=int(days_backwards))

	day_to_process = '/year=%04d/month=%02d/day=%02d/' % (hier.year,hier.month,hier.day)
	file_pattern='*.parquet'

	adls_path = 'abfss://%s@%s.dfs.core.windows.net/%s' % (container_name, account_name, source_root)

	print((adls_path + day_to_process + file_pattern))

	df = spark.read.parquet(adls_path + day_to_process + file_pattern)
	#display (df.limit(10))
	#df.printSchema()
	#display(df)
	adls_result = 'abfss://%s@%s.dfs.core.windows.net/%s' % (container_name, account_name, target_root)

	print(adls_result + day_to_process + file_pattern)

	df.coalesce(1).write.option("header",True)
		.mode("overwrite")
		.option("maxRecordsPerFile", 2000000)
		.parquet(adls_result + day_to_process)
Conclusion
In this article we have covered:
- How to easily use Stream Analytics to write an output with partitioned parquet files.
- How to use serverless Synapse SQL pool to query Stream analytics output.
- How to reduce the number of parquet files using synapse Spark pool.
Additional resources:
by Contributed | Jul 19, 2021 | Technology
This article is contributed. See the original author and article here.
Over 95 percent of Fortune 500 companies are transforming their businesses using Azure, relying on an enterprise-grade infrastructure and deep integration with the rest of the Microsoft Cloud. The Azure Migration and Modernization Program (AMMP) has helped thousands of customers unlock the benefits of the cloud, with the right mix of expert guidance and best practices to migrate to Azure. We’ve learned through this journey that customer environments are diverse and complex – there are workloads that can be migrated and there are others that must stay on-premises due to regulatory, data sovereignty, and latency requirements. Whatever the reason, it’s clear that a hybrid approach is a reality for most companies.
Customers tell us that a key challenge with hybrid adoption is consistent management, governance, and security across distributed locations. With Azure Arc, you can organize, govern and secure your servers and Kubernetes clusters across data centers, the edge, and multi-cloud environments, in a consistent manner, along your migration journey.
To demonstrate this, today we are excited to share a new Microsoft Mechanics video with Matt McSpirit and Jeremy Chapman who will show how your resources in the Cloud can work seamlessly with resources on-premises under a single management plane enabled by Azure Arc. Check it out today!
Get started with Azure Arc
by Contributed | Jul 19, 2021 | Dynamics 365, Microsoft 365, Technology
This article is contributed. See the original author and article here.
Change. Adapt. Grow. Words we have had to embrace over the past 15 months as we’ve had to change the way we do business. As we start to emerge from the pandemic’s isolation and restrictions, we’re entering a world of a new normal. As consumers, our expectations are higher. To meet ever-changing customer expectations, successful businesses are constantly going through the change, adapt, and grow cycle, especially when it comes to customer experience and virtual events. Many experts project that in-person events will gradually return but the prominence of virtual events is here to stay. And with that comes exciting new opportunities to elevate customer experiences.
To help businesses embrace those opportunities we are announcing the availability of enhanced integration of Microsoft Teams and Microsoft Dynamics 365 Marketing.
We are also announcing a special offer for Microsoft Teams webinar customers with commercial Office 365 E3/E5 or Microsoft 365 E3/E5 subscription with minimum 300 seats can take advantage of that integration by adding six months of Dynamics 365 Marketing at no additional cost to nurture up to 10,000 contacts with personalized emails and engaging customer journeys. This special offer is available through December 31, 2021. More details on the offer and eligibility can be found here.
Win customers and earn loyalty
The new Teams webinars capabilities are remarkable by themselves, but when you add the integration with Dynamics 365 Marketing, they are extraordinary. The power, flexibility, and unlimited possibilities that these two products working together can offer will change the way that you interact with your event attendees. Key capabilities include simplified event management, increased attendee engagement, and effortless follow-up to nurture relationships, win customers, and earn their loyalty faster.
Simplify event management
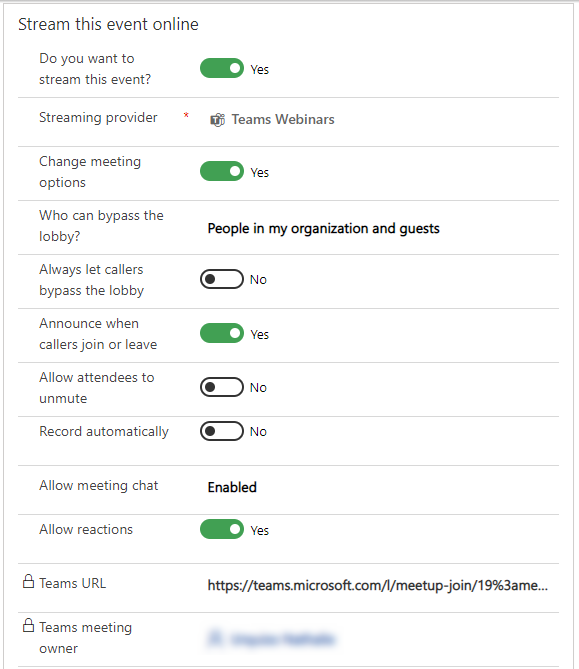
With the new Teams functionality, you have the power to host secure interactive meetings and webinars that include polls, video sharing, and reactions for up to 1,000 attendees.
You have the flexibility to organize your webinar your wayfrom within Teams or from within Dynamics 365 Marketing, the option is yours. Both ways are easy and intuitive and have improved capabilities.
If you already use event management from within Dynamics 365 Marketing, you will now see a more robust set of event management options that allow you to have better control over your webinar.
If you prefer to create events from within Teams, you will have the same high level of control, but you now have the optional integration and power of Dynamics 365 Marketing to use in elevating your customer journey experience.
Increase attendee engagement
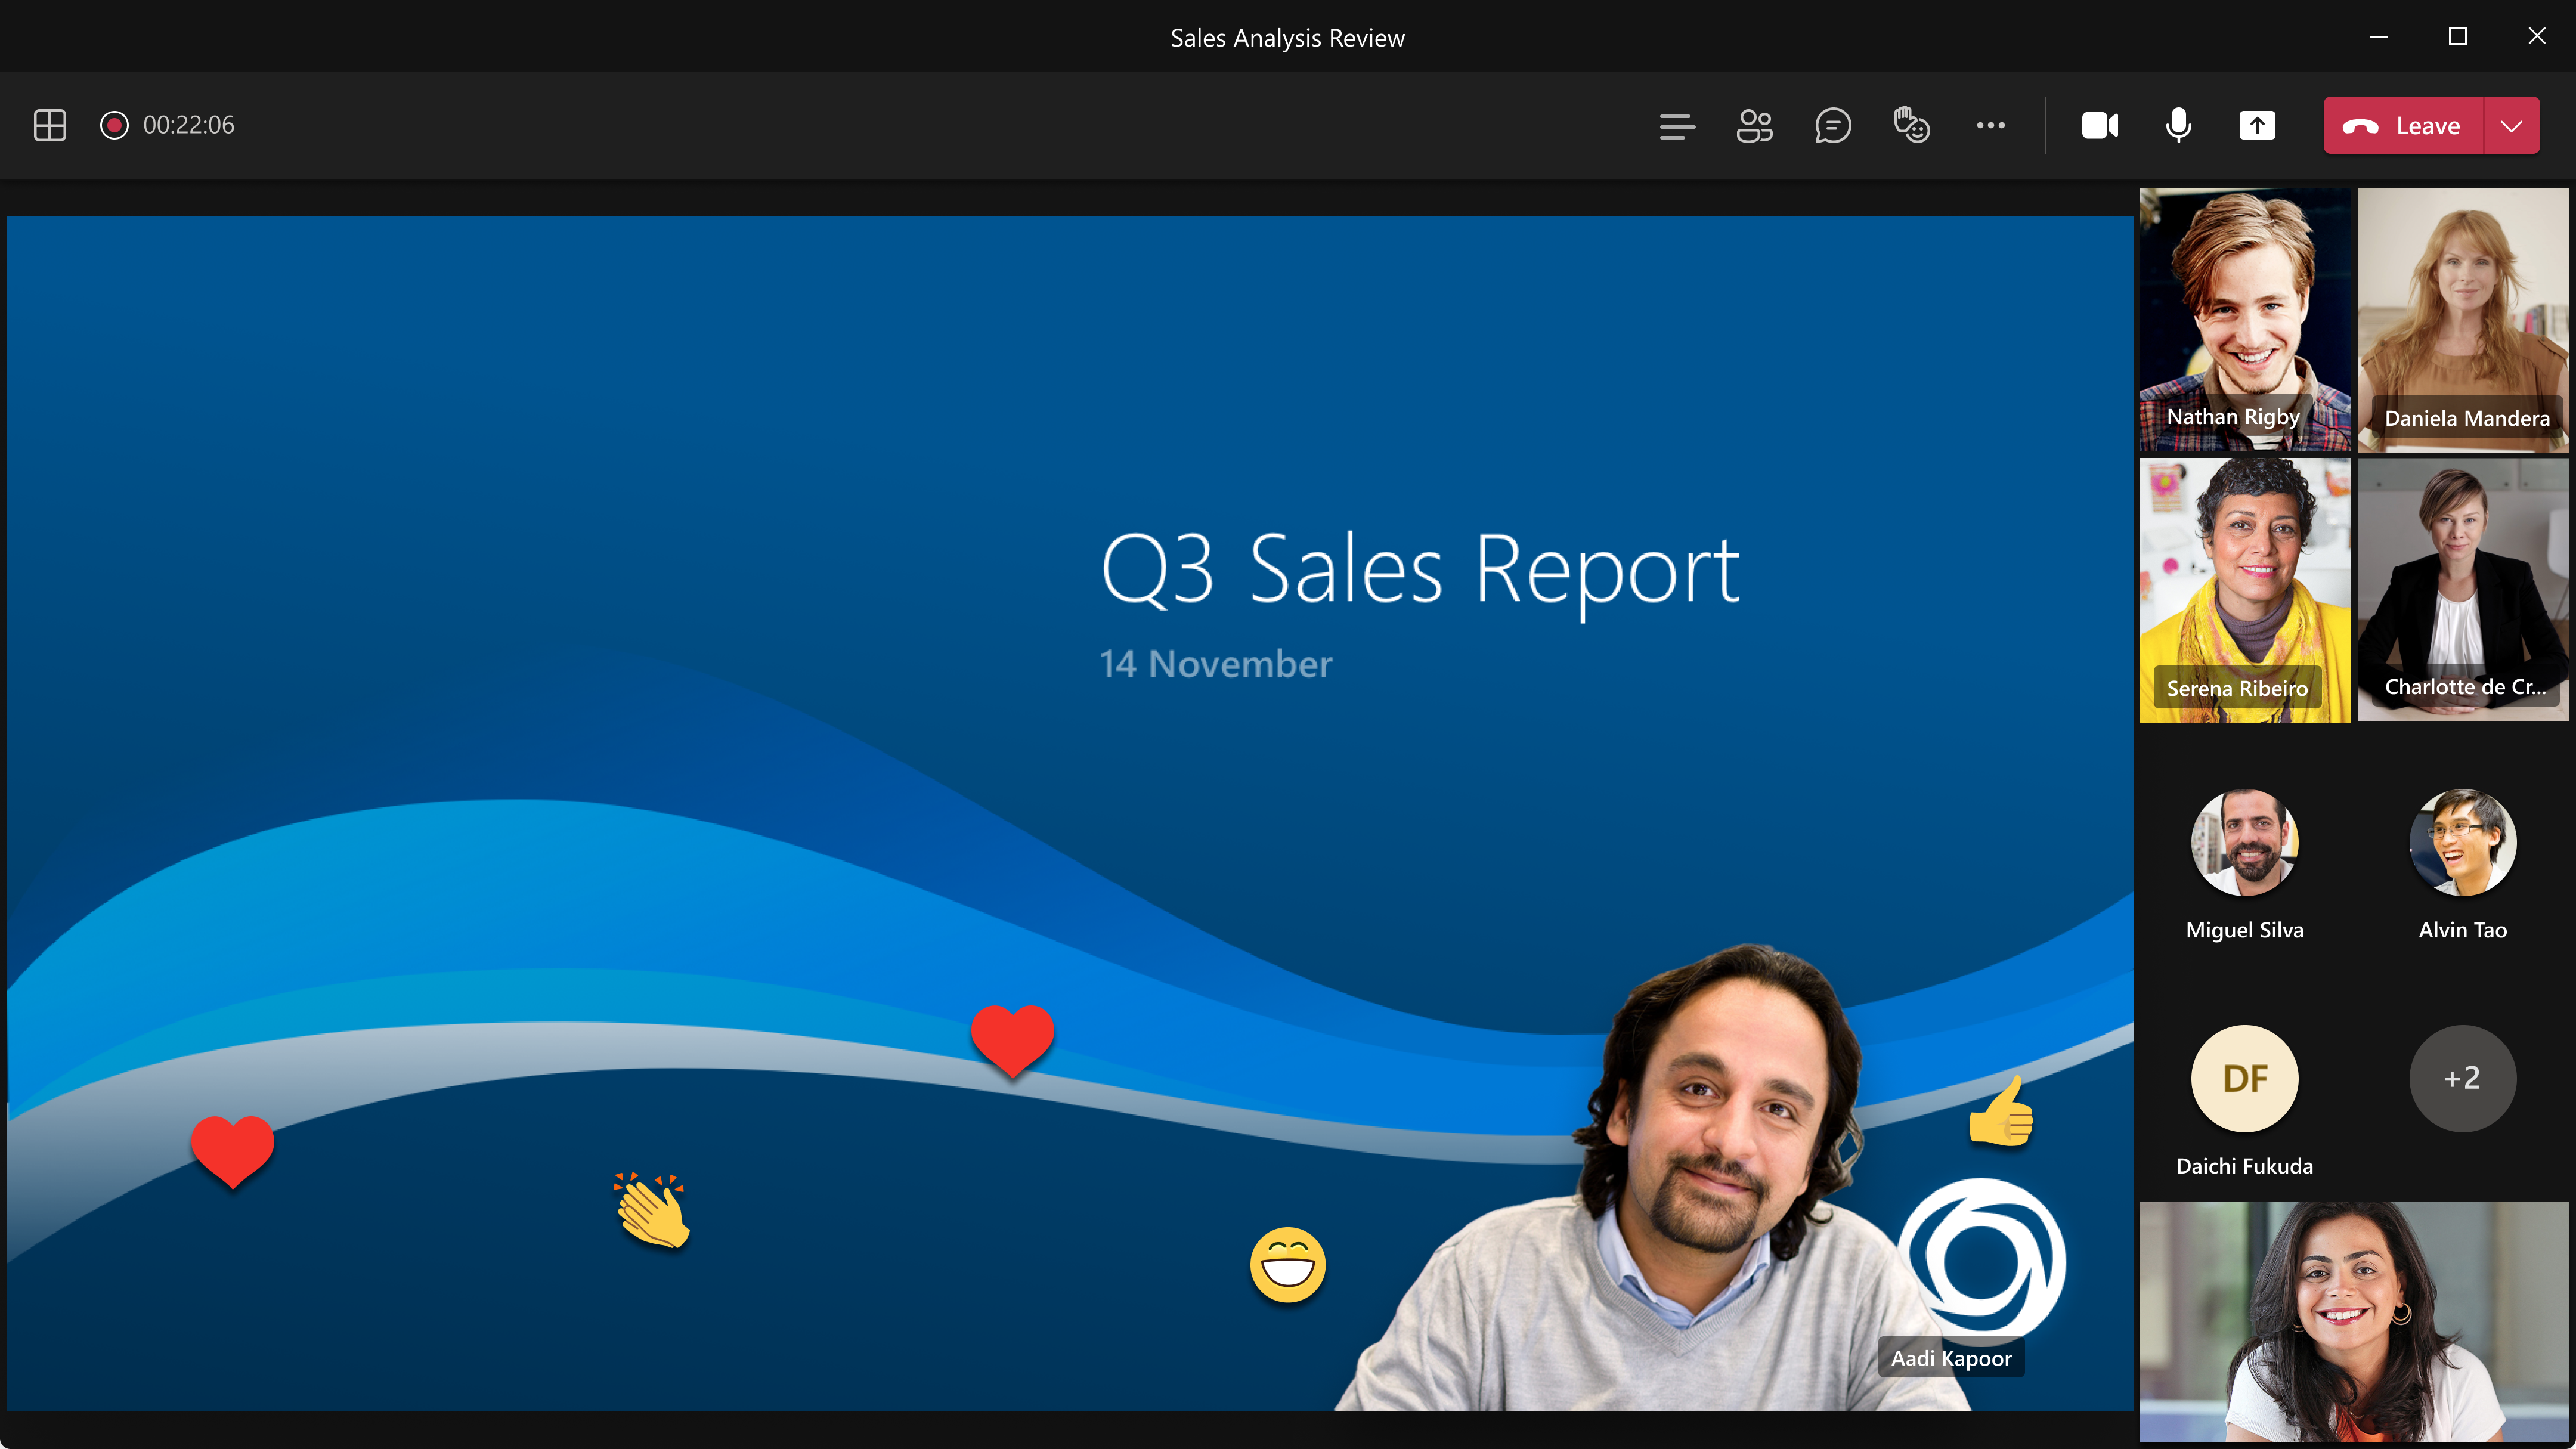
Microsoft Teams makes it easy to catch the attention of your online audience and present like a pro. Use PowerPoint Live and Presenter Mode to deliver more impactful and engaging presentations, and take advantage of new innovations like Standout Mode which enables presenters to appear over content.
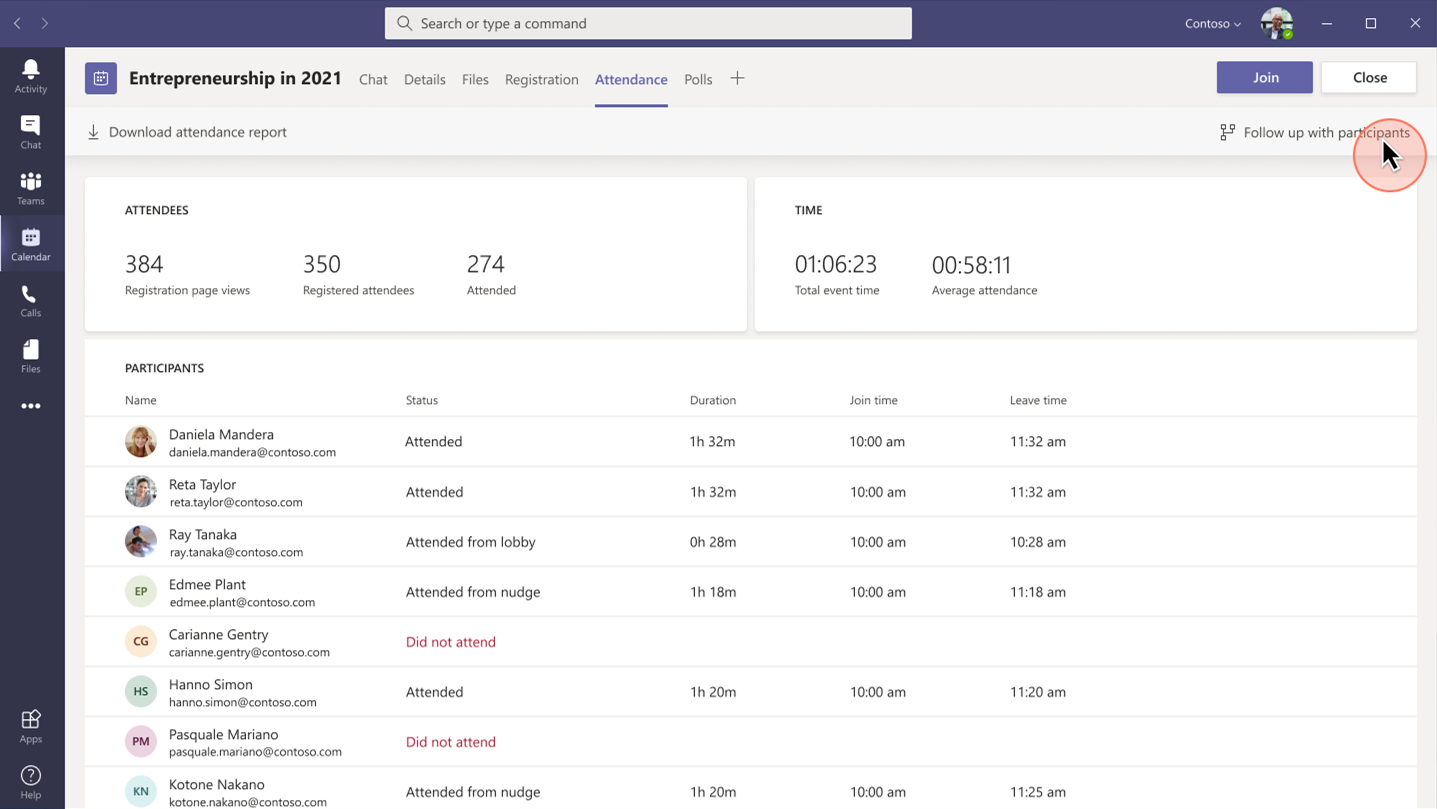
Whether it’s before, during, or after your event, you can easily gain insightful information from attendees with real-time polls and surveys from within Teams. Reports that track attendance are also readily available. Use that information to shape your presentation delivery and personalize post-event follow-up.
Follow-up to nurture relationships
Keep the lines of communication active after your Teams webinar concludes. With a single mouse click, attendee engagement data is transferred seamlessly into Dynamics 365 Marketing and automatically populated into pre-built, commonly used segments. Each of those segments corresponds to a built-in, ready-to-send, editable email template for personalized post-event communications and customer journey orchestration. Leverage the dashboards and analytics to gain insights about attendees to further personalize and drive post-event engagement.
Project Management Institute boosts events participation and member experience

“Since we were already familiar with Dynamics 365 and Teams, we were able to pivot quickly to provide virtual events for our members.With Dynamics 365, we’ve removed the struggle from our marketing efforts.”Glory Ikeata, Chair of Volunteer Services Committee, Project Management InstituteMinnesota
Project Management InstituteMinnesota (PMI-MN) provides value to members by sharing project management information and is among the largest PMI chapters in size and member events. PMI-MN aspired to further engage its members and inform them about seminars, certifications, and educational events.
To meet that aspiration, PMI-MN needed a way to centralize disparate member data and use that data to better understand how members interact with their organization. They worked collaboratively with cloud solutions provider TrimaxSecure to implement a comprehensive solution with Microsoft Dynamics 365, Microsoft Teams, and Microsoft Power BI to increase member engagement.
PMI-MN used Dynamics 365 Marketing to build sophisticated marketing journeys to connect with their members via relevant email marketing and the app’s event management capabilities to create event portals to simplify event management for members, volunteers, and speakers.
During the COVID-19 crisis, the chapter was able to shift from in-person to virtual events because it had reliable cloud-based tools to continue to engage its members. PMI-MN used Microsoft Teams for remote events and sent the Teams meeting links through email.
By connecting their event and email marketing efforts, PMI-MN now offers a richer member experience and increased participation in events and workshops. Staff can now quickly and easily manage member information. The chapter has seen retained events revenue increase by almost 90 percent.
Microsoft Core Marketing Engineering turns audiences into customers

“By carefully combining technology solutions in our events platform, including Dynamics 365 and Teams, we’ve enabled our marketing business to generate a 400 percent increase in attendees and a 500 percent increase in new known leads.”Vinh Nguyen, Principal Program Manager, Microsoft
The Core Marketing Engineering (CME) unit at Microsoft wanted to enhance event marketing capabilities, reduce operational complexity around in-person and digital events, and explore Microsoft technology for event management. The business unit accelerated the process when it needed to quickly shift from holding in-person events to hosting them digitally due to COVID-19.
It adopted Microsoft Dynamics 365 Marketing and used the event management capabilities to create an event management center. CME gets additional value from Dynamics 365 Marketing by combining it with Microsoft Teams event functionality, Azure Data Lake Storage, and Power Apps portals.
“By using Dynamics 365 and Teams together, we’ve centralized everything for our marketers, so they no longer have to spend time navigating to an outside system when they want to build a digital event,” says Sanarya Salah, Program Manager at Microsoft.
CME reduced its number of third-party tools, cutting costs and removing complexity for its marketers. It now creates more engaging and interactive events, which has led to better customer engagement and increased leads.
Strengthen customer relationships
The powerful integration of Teams and Dynamics 365 Marketing allows you to convert a single interaction into an ongoing relationship to win customers and earn their loyalty. The limited-time special offer for Microsoft Teams customers presents a unique opportunity to use that integration in your own environmentthe possibilities are extraordinary.
Get started with Microsoft Teams and Dynamics 365 Marketing today.
Learn more
We are always looking for feedback and would like to hear from you. Please head to the Dynamics 365 Community to start a discussion, ask questions, and tell us what you think.
The post Turn attendees into loyal customers with Microsoft Teams and Dynamics 365 Marketing appeared first on Microsoft Dynamics 365 Blog.
Brought to you by Dr. Ware, Microsoft Office 365 Silver Partner, Charleston SC.
by Contributed | Jul 17, 2021 | Technology
This article is contributed. See the original author and article here.
By Evan Rust and Zin Thein Kyaw
Introduction
Wheel lug nuts are such a tiny part of the overall automobile assembly that they’re easy to overlook, but yet serve a critical function in the safe operation of an automobile. In fact, it is not safe to drive even with one lug nut missing. A single missing lug nut will cause increased pressure on the wheel, in turn causing damage to the wheel bearings, studs, and make the other lug nuts fall off.
Over the years there have been a number of documented safety recalls and issues around wheel lug nuts. In some cases, it was only identified after the fact that the automobile manufacturer had installed incompatible lug nut types with the wheel or had been inconsistent in installing the right type of lug nut. Even after delivery, after years of wear and tear, the lug nuts may become loose and may even fall off which would cause instability for an automobile to be in service. To reduce these incidents of quality control at manufacturing and maintenance in the field, there is a huge opportunity to leverage machine learning at the edge to automate wheel lug nut detection.
This motivated us to create a proof-of-concept reference project for automating wheel lug nut detection by easily putting together a USB webcam, Raspberry Pi 4, Microsoft Azure IoT, and Edge Impulse, creating an end-to-end wheel lug nut detection system using Object Detection. This example use case and other derivatives will find a home in many industrial IoT scenarios where embedded Machine Learning can help improve the efficiency of factory automation and quality control processes including predictive maintenance.
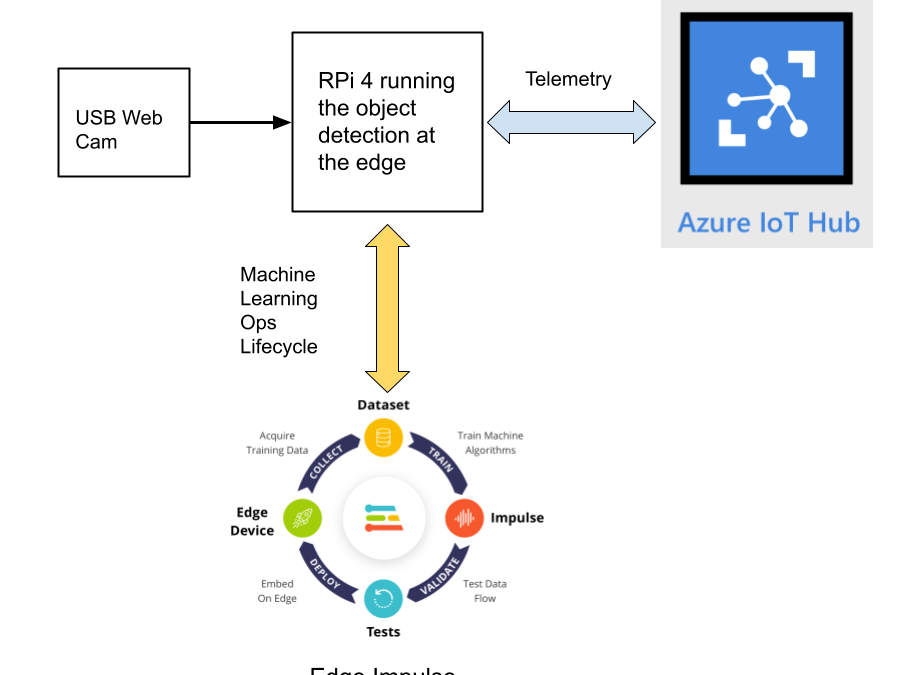
This reference project will serve as a guide for quickly getting started with Edge Impulse on the Raspberry Pi 4 and Azure IoT, to train a model that detects lug nuts on a wheel and sends inference conclusions to Azure IoT as shown in the block diagram below:

Design Concept: Edge Impulse and Azure IoT
Edge Impulse is an embedded machine learning platform that allows you to manage the entire Machine Learning Ops (MLOps) lifecycle which includes 1) Data Acquisition, 2) Signal Processing, 3) ML Training, 4) Model Testing, and 5) Creating a deployable model that can run efficiently on an edge device.
For the edge device, we chose to use the Raspberry Pi 4 due to its ubiquity and available processing power for efficiently running more sophisticated machine learning models such as object detection. By running the object detection model on the Raspberry Pi 4, we can optimize the network bandwidth connection to Azure IoT for robustness and scalability by only sending the inference conclusions, i.e. “How many lug nuts are on the wheel?”. Once the inference conclusions are available at the Azure IoT level, it becomes straightforward to feed these results into your business applications that can leverage other Azure services such as Azure Stream Analytics and Power BI.
In the next sections we’ll discuss how you can set this up yourself with the following items:
Setting Up the Hardware
We begin by setting up the Raspberry Pi 4 to connect to a Wi-Fi network for our network connection, configuring it for camera support, and installing the Edge Impulse Linux CLI (command line interface) tools on the Raspberry Pi 4. This will allow the Raspberry Pi 4 to directly connect to Edge Impulse for data acquisition and finally, deployment of the wheel lug nut detection model.

For starters, you’ll need a Raspberry Pi 4 with an up-to-date Raspberry Pi OS image that can be found here. After flashing this image to an SD card and adding a file named ‘wpa_supplicant.conf’:
ctrl_interface=DIR=/var/run/wpa_supplicant GROUP=netdev
update_config=1
country=<Insert 2 letter ISO 3166-1 country code here>
network={
 ssid="<Name of your wireless LAN>"
 psk="<Password for your wireless LAN>"
}
along with an empty file named ‘ssh’ (both within the ‘/boot’ directory), you can go ahead and power up the board.
Once you’ve successfully SSH’d into the device with
ssh pi@<IP_ADDRESS>
and the password ‘raspberry’, it’s time to install the dependencies for the Edge Impulse Linux SDK. Simply run the next three commands to set up the NodeJS environment and everything else that’s required for the edge-impulse-linux wizard:
curl -sL https://deb.nodesource.com/setup_12.x | sudo bash -
sudo apt install -y gcc g++ make build-essential nodejs sox gstreamer1.0-tools gstreamer1.0-plugins-good gstreamer1.0-plugins-base gstreamer1.0-plugins-base-apps
npm config set user root && sudo npm install edge-impulse-linux -g --unsafe-perm
For more details on setting up the Raspberry Pi 4 with Edge Impulse, visit this link.
Since this project deals with images, we’ll need some way to capture them. The wizard supports both the Pi camera modules and standard USB webcams, so make sure to enable the camera module first with
sudo raspi-config
if you plan on using one. With that completed, go to Edge Impulse and create a new project, then run the wizard with
edge-impulse-linux
and make sure your device appears within the Edge Impulse Studio’s device section after logging in and selecting your project.

Data Acquisition
Training accurate production ready machine learning models requires feeding plenty of varied data, which means a lot of images are typically required. For this proof-of-concept, we captured around 145 images of a wheel that had lug nuts on it. The Edge Impulse Linux daemon allows you to directly connect the Raspberry Pi 4 to Edge Impulse and take snapshots using the USB webcam.

Using the Labeling queue in the Data Acquisition page we then easily drew bounding boxes around each lug nut within every image, along with every wheel. To add some test data we went back to the main Dashboard page and clicked the ‘Rebalance dataset’ button that moves 20% of the training data to the test data bin.
Impulse Design and Model Training
Now that we have plenty of training data, it’s time to design and build our model. The first block in the Impulse Design is an Image Data block, and it scales each image to a size of ‘320’ by ‘320’ pixels.

Next, image data is fed to the Image processing block that takes the raw RGB data and derives features from it.

Finally, these features are used as inputs to the MobileNetV2 SSD FPN-Lite Transfer Learning Object Detection model that learns to recognize the lug nuts. The model is set to train for ’25’ cycles at a learning rate of ‘.15’, but this can be adjusted to fine-tune for accuracy. As you can see from the screenshot below, the trained model indicates a precision score of 97.9%.

Model Testing
If you’ll recall from an earlier step we rebalanced the dataset to put 20% of the images we collected to be used for gauging how our trained model could perform in the real world. We use the model testing page to run a batch classification and see how we expect our model to perform. The ‘Live Classification’ tab will also allow you to acquire new data direct from the Raspberry Pi 4 and see how the model measures up against the immediate image sample.

Versioning
An MLOps platform would not be complete without a way to archive your work as you iterate on your project. The ‘Versioning’ tab allows you to save your entire project including the entire dataset so you can always go back to a “known good version” as you experiment with different neural network parameters and project configurations. It’s also a great way to share your efforts as you can designate any version as ‘public’ and other Edge Impulse users can clone your entire project and use it as a springboard to add their own enhancements.

Deploying Models
In order to verify that the model works correctly in the real world, we’ll need to deploy it to the Raspberry Pi 4. This is a simple task thanks to the Edge Impulse CLI, as all we have to do is run
edge-impulse-linux-runner
which downloads the model and creates a local webserver. From here, we can open a browser tab and visit the address listed after we run the command to see a live camera feed and any objects that are currently detected. Here’s a sample of what the user will see in their browser tab:

Sending Inference Results to Azure IoT Hub
With the model working locally on the Raspberry Pi 4, let’s see how we can send the inference results from the Raspberry Pi 4 to an Azure IoT Hub instance. As previously mentioned, these results will enable business applications to leverage other Azure services such as Azure Stream Analytics and Power BI. On your development machine, make sure you’ve installed the Azure CLI and have signed in using ‘az login’. Then get the name of the resource group you’ll be using for the project. If you don’t have one, you can follow this guide on how to create a new resource group.

After that, return to the terminal and run the following commands to create a new IoT Hub and register a new device ID:
az iot hub create --resource-group <your resource group> --name <your IoT Hub name>
az extension add --name azure-iot
az iot hub device-identity create --hub-name <your IoT Hub name> --device-id <your device id>

Retrieve the connection string the Raspberry Pi 4 will use to connect to Azure IoT with:
az iot hub device-identity connection-string show --device-id <your device id> --hub-name <your IoT Hub name>

Now it’s time to SSH into the Raspberry Pi 4 and set the connection string as an environment variable with:
export IOTHUB_DEVICE_CONNECTION_STRING="<your connection string here>"
Then, add the necessary Azure IoT device libraries with:
pip install azure-iot-device
(Note: if you do not set the environment variable or pass it in as an argument the program will not work!) The connection string contains the information required for the Raspberry Pi 4 to establish a connection with the Azure IoT Hub service and communicate with it. You can then monitor output in the Azure IoT Hub with:
az iot hub monitor-events --hub-name <your IoT Hub name> --output table
or in the Azure Portal.

To make sure it works, download and run this example on the Raspberry Pi 4 to make sure you can see the test message.
For the second half of deployment, we’ll need a way to customize how our model is used within the code. Edge Impulse provides a Python SDK for this purpose. On the Raspberry Pi 4 install it with
sudo apt-get install libatlas-base-dev libportaudio0 libportaudio2 libportaudiocpp0 portaudio19-dev
pip3 install edge_impulse_linux -i https://pypi.python.org/simple
We’ve made available a simple example on the Raspberry Pi 4 that sets up a connection to the Azure IoT Hub, runs the model, and sends the inference results to Azure IoT.

Once you’ve either downloaded the zip file or cloned the repo into a folder, get the model file by running
edge-impulse-linux-runner --download modelfile.eim
inside of the folder you just created from the cloning process. This will download a file called ‘modelfile.eim’. Now, run the Python program with
python lug_nut_counter.py ./modelfile.eim -c <LUG_NUT_COUNT>
where <LUG_NUT_COUNT> is the correct number of lug nuts that should be attached to the wheel (you might have to use ‘python3’ if both Python 2 and 3 are installed).

Now whenever a wheel is detected the number of lug nuts is calculated. If this number falls short of the target, a message is sent to the Azure IoT Hub.

And by only sending messages when there’s something wrong, we can prevent an excess amount of bandwidth from being taken due to empty payloads.

Conclusion
We’ve just scratched the surface with wheel lug nut detection. Imagine utilizing object detection for other industrial applications in quality control, detecting ripe fruit amongst rows of crops, or identifying when machinery has malfunctioned with devices powered by machine learning.
With any hardware, Edge Impulse, and Microsoft Azure IoT, you can design comprehensive embedded machine learning models, deploy them on any device, while authenticating each and every device with built-in security. You can set up individual identities and credentials for each of your connected devices to help retain the confidentiality of both cloud-to-device and device-to-cloud messages, revoke access rights for specific devices, upgrade device firmware remotely, and benefit from advanced analytics on devices running offline or with intermittent connectivity.
The complete Edge Impulse project is available here for you to see how easy it is to start building your own embedded machine learning projects today using object detection. We look forward to your feedback at hello@edgeimpulse.com or on our forum.
by Contributed | Jul 17, 2021 | Technology
This article is contributed. See the original author and article here.
This article is the first part of a series which explores an end-to-end pipeline to deploy an Air Quality Monitoring application using off-the-market sensors, Azure IoT Ecosystem and Python. We will begin by looking into what is the problem, some terminology, prerequisites, reference architecture, and an implementation.
Indoor Air Quality – why does it matter and how to measure it with IoT?
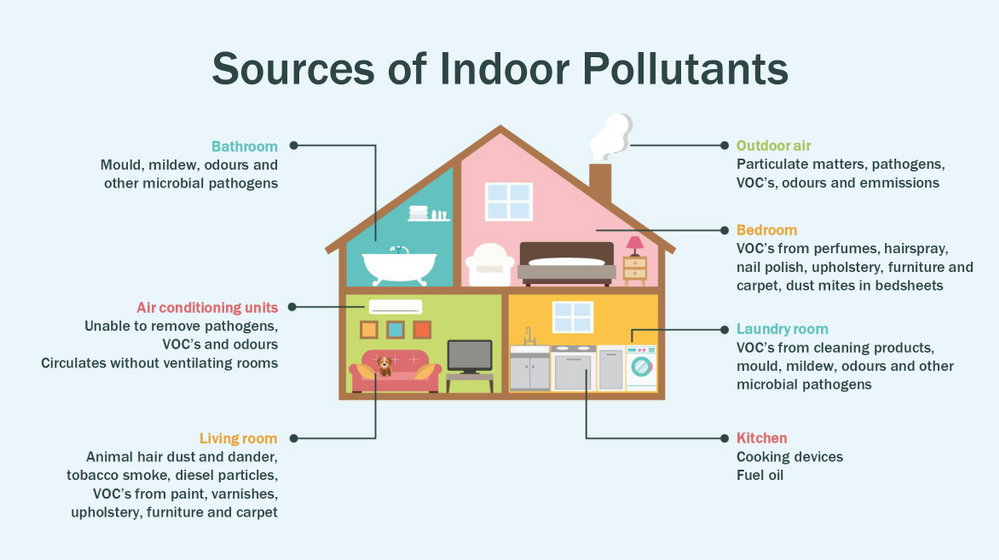
Most people think of air pollution as an outdoor problem, but indoor air quality has a major impact on health and well-being since the average American spends about 90 percent of their time indoors. Proper ventilation is one of the most important considerations for maintaining good indoor air quality. Poor indoor air quality is known to be harmful to vulnerable groups such as the elderly, children or those suffering chronic respiratory and/or cardiovascular diseases. Here is a quick visual on some sources of indoor air pollution.
Post Covid-19, we are in a world where awareness of our indoor environments is key for survival. Here in Canada we are quite aware of the situation, which is why we have a set of guidlines from the Government of Canada, and a recent white paper from Public Health Ontario. The American Medical Association has put up this excellent document for reference. So now that we know what the problem is, how do we go about solving it? To solve something we must be able to measure it and currently we have some popular metrics to measure air quality, viz. IAQ and VOC.
So what are IAQ and VOC exactly?
Indoor air quality (IAQ) is the air quality within and around buildings and structures. IAQ is known to affect the health, comfort, and well-being of building occupants. IAQ can be affected by gases (including carbon monoxide, radon, volatile organic compounds), particulates, microbial contaminants (mold, bacteria), or any mass or energy stressor that can induce adverse health conditions. IAQ is part of indoor environmental quality (IEQ), which includes IAQ as well as other physical and psychological aspects of life indoors (e.g., lighting, visual quality, acoustics, and thermal comfort). In the last few years IAQ has received increasing attention from environmental governance authorities and IAQ-related standards are getting stricter. Here is a IAQ blog infographic if you’d like to read.
Volatile organic compounds (VOC) are organic chemicals that have a high vapour pressure at room temperature. High vapor pressure correlates with a low boiling point, which relates to the number of the sample’s molecules in the surrounding air, a trait known as volatility. VOC’s are responsible for the odor of scents and perfumes as well as pollutants. VOCs play an important role in communication between animals and plants, e.g. attractants for pollinators, protection from predation, and even inter-plant interactions. Some VOCs are dangerous to human health or cause harm to the environment. Anthropogenic VOCs are regulated by law, especially indoors, where concentrations are the highest. Most VOCs are not acutely toxic, but may have long-term chronic health effects. Refer to this and this for vivid details.
The point is, in a post pandemic world, having a centralized air quality monitoring system is an absolute necessity. The need for collecting this data and using the insights from it is crucial to living better. And this is where Azure IoT comes in. In this series we are going to explore how to create the moving parts of this platform with ‘minimum effort‘. In this first part, we are goiing to concentrate our efforts on the overall architecture, hardware/software requirements, and IoT edge module creation.
Prerequisites
To accomplish our goal we will ideally need to meet a few basic criteria. Here is a short list.
- Air Quality Sensor (link)
- IoT Edge device (link)
- Active Azure subscription (link)
- Development machine
- Working knowledge of Python, Sql, Docker, Json, IoT Edge runtime, VSCode
- Perseverance
Lets go into a bit of details about the aforementioned points since there are many possibilities.
Air Quality Sensor
This is the sensor that emits the actual IAQ/VOC+ data. Now, there are a lot of options in this category, and technically they should be producing the same results. However, the best sensors in the market are Micro-Electro-Mechanical Systems (MEMS). MEMS technology uses semiconductor fabrication processes to produce miniaturized mechanical and electro-mechanical elements that range in size from less than one micrometer to several millimeters. MEMS devices can vary from relatively simple structures with no moving elements, to complex electromechanical systems with multiple moving elements. My choice was uThing::VOC™ Air-Quality USB sensor dongle. This is mainly to ensure high quality output and ease of interfacing, which is USB out of the box, and does not require any installation. Have a look at the list of features available on this dongle. The main component is a Bosch proprietary algorithm and the BME680 sensor that does all the hard work. Its basically plug-and-play. The data is emitted in Json format and is available at an interval of 3 milliseconds on the serial port of your device. In my case it was /dev/ttyACM0, but could be different in yours.

IoT Edge device
This is the edge system. where the sensor is plugged in. Typical choices are windows or linux. If you are doing windows, be aware some of these steps may be different and you have to figure those out. However, in my case I am using ubuntu 20.04 installed on an Intel NUC. The reason I chose the NUC is because many IoT modules require an x86_64 machine, which is not available in ARM devices (Jetson, Rasp Pi, etc.) Technically this should work on ANY edge device with a usb port, but for example windows has an issue mounting serial ports onto containers. I suggest better stick with linux unless its a client requirement.

Active Azure subscription
Surely, you will need this one, but as we know Azure has this immense suit of products, and while ideally we want to have everything, it may not be practically feasible. For practical purposes you might have to ask for access to particular services, meaning you have to know ahead exactly which ones you want to use. Of course the list of required services will vary between use cases, so we will begin with just the bare minimum. We will need the following:
- Azure IoT Hub (link)
- Azure Container Registry (link)
- Azure blob storage (link)
- Azure Streaming Analytics (link)(future article)
- Power BI / React App (link)(future article)
- Azure Linux VM (link)(optional)
A few points before we move to the next prerequisite. For IoT hub you can use free tier for experiments, but I will recommend to use the standard tier instead. For ACR get the usual tier and generate username password. For storageaccount its the standard tier. The ASA and BI products will be used in the reference architecture, but is not discussed in this article. The final service Azure VM is an interesting one. Potentially all the codebase can be run using VM, but this is only good for simulations. However, note that it is an equally good idea to experiment with VMs first as they have great integration and ease the learning curve.
Development machine
The development machine can be literally anything from which you have ssh access to the edge device. From an OS perspective it can be windows, linux, raspbian, mac etc. Just remember two things – use a good IDE (a.k.a VSCode) and make sure docker can be run on it, optionally with priviliges. In my case I am using a Startech KVM, so I can shift between my windows machine and the actual edge device for development purposes, but it is not neccessary.
Working knowledge of Python, Sql, Docker, Json, IoT Edge runtime, VSCode
This is where it gets tricky. Having a mix of these knowledge is somewhat essential to creating and scaling this platform. However, I understand you may not be having proficiency in all of these. On that note, I can tell from experience that being from a data engineering background has been extremely beneficial for me. In any case, you will need some python skills, some sql, and Json. Even knowing how to use the VSCode IoT extension is non-trivial. One notable mention is that good docker knowledge is extrememly important, as the edge module is in fact simply a docker container thats deployed through the deployment manifest (IoT Edge runtime).
Perseverance
In an ideal world, you read a tutorial, implement, it works and you make merry. The real world unfortunately will bring challenges that you have not seen anywhere. Trust me on this, many times you will make good progress simply by not quitting what you are doing. Thats it. That is the secret ingredient. Its like applying gradient descent to your own brain model of a concept. Anytime any of this doesn’t work, simply have belief in Azure and yourself. You will always find a way. Okay enough of that. Lets get to business.
Reference Architecture
Here is a reference architecture that we can use to implement this platform. This is how I have done it. Please feel free to do your own.

Most of this is quite simple. Just go through the documentation for Azure and you should be fine. Following this we go to what everyone is waiting for – the implementation.
Implementation
In this section we will see how we can use these tools to our benefit. For the Azure resources I may not go through the entire creation or installation process as there are quite a few articles on the internet for doing those. I shall only mention the main things to look out for. Here is an outline of the steps involved in the implementation.
- Create a resource group in Azure (link)
- Create a IoT hub in Azure (link)
- Create a IoT Edge device in Azure (link)
- Install Ubuntu 18/20 on the edge device
- Plugin the usb sensor into the edge device and check blue light
- Install docker on the edge device
- Install VSCode on development machine
- Create conda/pip environment for development
- Check read the serial usb device to receive json every few milliseconds
- Install IoT Edge runtime on the edge device (link)
- Provision the device to Azure IoT using connection string (link)
- Check IoT edge Runtime is running good on the edge device and portal
- Create an IoT Edge solution in VSCode (link)
- Add a python module to the deployment (link)
- Mount the serial port to the module in the deployment
- Add codebase to read data from mounted serial port
- Augument sensor data with business data
- Send output result as events to IoT hub
- Build and push the IoT Edge solution (link)
- Create deployment from template (link)
- Deploy the solution to the device
- Monitor endpoint for consuming output data as events
Okay I know that is a long list. But, you must have noticed some are very basic steps. I mentioned them so everyone has a starting reference point regarding the sequence of steps to be taken. You have high chance of success if you do it like this. Lets go into some details now. Its a mix of things so I will just put them as flowing text.
90% of what’s mentioned in the list above can be done following a combination of the documents in the official Azure IoT Edge documentation. I highly advise you to scour through these documents with eagle eyes multiple times. The main reason for this is that unlike other technologies where you can literally ‘stackoverflow’ your way through things, you will not have that luxury here. I have been following every commit in their git repo for years and can tell you the tools/documentation changes almost every single day. That means your wits and this document are pretty much all you have in your arsenal. The good news is Microsoft makes very good documentation and even though its impossible to cover everything, they make an attempt to do it from multiple perspectives and use cases. Special mention to the following articles.
Once you are familiar with the ‘build, ship, deploy’ mechanism using the copius SimulatedTemperatureSensor module examples from Azure Marketplace, you are ready to handle the real thing. The only real challenge you will have is at steps 9, 15, 16, 17, and 18. Lets see how we can make things easy there. For 9 I can simply do a cat command on the serial port.
cat /dev/ttyACM0
This gives me output every 3 ms.
{"temperature": 23.34, "pressure": 1005.86, "humidity": 40.25, "gasResistance": 292401, "IAQ": 33.9, "iaqAccuracy": 1, "eqCO2": 515.62, "eqBreathVOC": 0.53}
This is exactly the data that the module will receive when the serial port is successfully mounted onto the module.
"AirQualityModule": {
            "version": "1.0",
            "type": "docker",
            "status": "running",
            "restartPolicy": "always",
            "settings": {
              "image": "${MODULES.AirQualityModule}",
              "createOptions": {
                "Env": [
                  "IOTHUB_DEVICE_CONNECTION_STRING=$IOTHUB_IOTEDGE_CONNECTION_STRING"
                ],
                "HostConfig": {
                  "Dns": [
                    "1.1.1.1"
                  ],
                  "Devices": [
                    {
                      "PathOnHost": "/dev/ttyACM0",
                      "PathInContainer": "/dev/ttyACM0",
                      "CgroupPermissions": "rwm"
                    }
                  ]
                }
              }
            }
          }
Notice the Devices block in the above extract from the deployment manifest. Using these keys/values we are able to mount the serial port onto the custom module aptly named AirQualityModule. So we got 15 covered.
Adding codebase to the module is quite simple too. When the module is generated by VSCode it automatically gives you the docker file (Dockerfile.amd64) and a sample main code. We will just create a copy of that file in the same repo and call it say air_quality.py. Inside this new file we will hotwire the code to read the device output. However, before doing any modification in the code we must edit requirements.txt. Mine looks like this:
azure-iot-device
psutil
pyserial
azure-iot-device is for the edge sdk libraries, and pyserial is for reading serial port. The imports look like this:
import time, sys, json
# from influxdb import InfluxDBClient
import serial
import psutil
from datetime import datetime
from azure.iot.device import IoTHubModuleClient, Message
Quite self-explainatory. Notice the influx db import is commented, meaning you can send these reading there too through the module. To cover 16 we will need the final three peices of code. Here they are:
message = ""
#uart = serial.Serial('/dev/tty.usbmodem14101', 115200, timeout=11) # (MacOS)
uart = serial.Serial('/dev/ttyACM0', 115200, timeout=11) # Linux
uart.write(b'Jn')
message = uart.readline()
uart.flushInput()
if debug is True:
  print('message...')
  print(message)
data_dict = json.loads(message.decode())
There that’s it! With three peices of code you have taken the data emitted by the sensor, to your desired json format using python. 16 is covered. For 17 we will just update the dictionary with business data. In my case as follows. I am attaching a sensor name and coordinates to find me  .
.
data_dict.update({'sensorId':'roomAQSensor'})
data_dict.update({'longitude':-79.025270})
data_dict.update({'latitude':43.857989})
data_dict.update({'cpuTemperature':psutil.sensors_temperatures().get('acpitz')[0][1]})
data_dict.update({'timeCreated':datetime.now().strftime("%Y-%m-%d %H:%M:%S")})
For 18 it is as simple as
print('data dict...')
print(data_dict)
msg=Message(json.dumps(data_dict))
msg.content_encoding = "utf-8"
msg.content_type = "application/json"
module_client.send_message_to_output(msg, "airquality")
Before doing step 19, two things must happen. First, u need to replace the default main.py in the dockerfile and with air_quality.py. Second, you must use proper entries in .env file to generate deployment & deploy successfully. We can quickly check the docker image exists before actual deployment.
docker images
iotregistry.azurecr.io/airqualitymodule   0.0.1-amd64  030b11fce8af  4 days ago  129MB
Now you are good to deploy. Use this tutorial to help deploy successfully. At the end of step 22 this is what it looks like upon consuming the endpoint through VSCode.
[IoTHubMonitor] Created partition receiver [0] for consumerGroup [$Default]
[IoTHubMonitor] Created partition receiver [1] for consumerGroup [$Default]
[IoTHubMonitor] [2:33:28 PM] Message received from [azureiotedge/AirQualityModule]:
{
  "temperature": 28.87,
  "pressure": 1001.15,
  "humidity": 38.36,
  "gasResistance": 249952,
  "IAQ": 117.3,
  "iaqAccuracy": 1,
  "eqCO2": 661.26,
  "eqBreathVOC": 0.92,
  "sensorId": "roomAQSensor",
  "longitude": -79.02527,
  "latitude": 43.857989,
  "cpuTemperature": 27.8,
  "timeCreated": "2021-07-15 18:33:28"
}
[IoTHubMonitor] [2:33:31 PM] Message received from [azureiotedge/AirQualityModule]:
{
  "temperature": 28.88,
  "pressure": 1001.19,
  "humidity": 38.35,
  "gasResistance": 250141,
  "IAQ": 115.8,
  "iaqAccuracy": 1,
  "eqCO2": 658.74,
  "eqBreathVOC": 0.91,
  "sensorId": "roomAQSensor",
  "longitude": -79.02527,
  "latitude": 43.857989,
  "cpuTemperature": 27.8,
  "timeCreated": "2021-07-15 18:33:31"
}
[IoTHubMonitor] Stopping built-in event endpoint monitoring...
[IoTHubMonitor] Built-in event endpoint monitoring stopped.
Congratulations! You have successfully deployed the most vital step in creating a scalable air quality monitoring platform from scratch using Azure IoT.
Future Work
Keep an eye out for a follow up of this article where I shall be discussing how to continue the end-to-end pipeline and actually visualize it on Power BI.

Recent Comments