by Contributed | Oct 5, 2021 | Technology
This article is contributed. See the original author and article here.
Over the last few years, we have invested heavily in Microsoft Graph to enable developers to access the rich data available in Microsoft 365. Microsoft Graph, along with OAuth 2.0, provides increased security and seamless integration with other Microsoft cloud services.
In August 2018, we announced that we were no longer going to actively invest in Exchange Web Services (EWS) APIs for Exchange Online. We also gave a strong recommendation to start migrating to Microsoft Graph for Exchange Online data access.
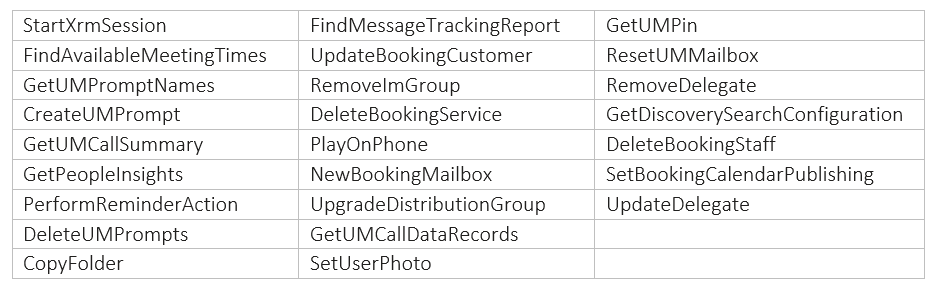
Today, we are announcing that we are going to remove the ability to create new EWS apps starting September 30, 2022. We are also announcing the deprecation of the 25 least used APIs of EWS for Exchange Online (as determined by the call volume into the service). We are deprecating these APIs to begin the process of reducing the surface area of the EWS protocol for maintenance and security purposes. Support for these APIs will no longer exist after deprecation.
The list of deprecated APIs is at the end of this post. We will introduce sunset headers in the response for these APIs that are marked for deprecation. As per our deprecation policy, we will decommission these APIs by March 31, 2022.
This set of deprecations is the first in a series of steps we will take as we sunset EWS for Exchange Online. Over time, we will identify additional APIs for deprecation when and where we see adequate parity with Microsoft Graph APIs.
EWS is a legacy API surface that has served us well, but no longer meets the security and manageability needs of modern app development. We strongly urge our ecosystem partners accessing Exchange Online data to migrate to Microsoft Graph APIs.
APIs scheduled for deprecation:
The Exchange Team and Microsoft Graph Team

by Contributed | Oct 4, 2021 | Business, Microsoft 365, Technology, Windows 11
This article is contributed. See the original author and article here.
We are excited to announce Windows 11 is now generally available. We reimagined Windows 11 to be the operating system for hybrid work. I encourage you to begin your Windows 11 pilots and upgrades today for all eligible PCs with confidence that Windows 11 is the most productive, most collaborative, and most secure version of…
The post Empower your hybrid workforce today with Windows 11 appeared first on Microsoft 365 Blog.
Brought to you by Dr. Ware, Microsoft Office 365 Silver Partner, Charleston SC.
by Contributed | Oct 4, 2021 | Technology
This article is contributed. See the original author and article here.
In this guest blog post, Karl Kalash, Product Marketing Manager at Datadog, examines the problems that can arise from traditional siloed monitoring, how Datadog’s approach unifies information, and how the Microsoft Azure Marketplace simplifies purchasing and invoicing for customers of the software-as-a-service (SaaS) solution:
Modern applications are built with a multi-tier, service-oriented architecture. Problems that affect end users can occur at any level in the tech stack, and they need to be caught before issues cascade and become critical. Traditional siloed monitoring, in which each team uses its own monitoring tool and users are constantly chasing the red or tracking the yellow, is no longer sufficient. All teams do not have a single source of truth and are often blindsided at critical moments. Context switching and finger-pointing are often the end result. This impacts every reason that led you to the cloud in the first place: It negatively impacts your scalability, reduces agility, increases costs, affects cloud migration and platform modernization projects, and limits application optimization.
The problems are magnified by thousands of instances distributed over the cloud and on-premises environments. Siloed monitoring tools limit your team’s ability to respond to challenges at the cloud scale or adopt new technologies. Such tool and agent sprawl is expensive, both in terms of costs and computing resource consumption; it’s also highly inefficient because of agent and data redundancy. Metrics indicate something is wrong, but they lack details. Traces can point to the general area, but aren’t specific. Logs have high volume and varying value, with cost and visibility tradeoffs. Everything must be manually queried and correlated.
This leads to reactive teams, excessive alerts, and constant firefighting. Poor quality of life for your operations teams could impact not just performance, but also hiring and growth. And most importantly, you lack the business context of what matters to your end users or customers.
By contrast, Datadog collects data from all servers, containers, applications, and cloud-based services with a single unified agent. The same agent that collects metrics also collects traces and logs. All that data is sent to Datadog’s SaaS platform, which enables numerous levels of monitoring:
● Infrastructure monitoring for back-end servers and cloud-based instances
● Serverless monitoring for functions and serverless applications
● Application performance monitoring on the application server side, which gives you insights aggregated across all requests
● Log management for all front-end and back-end logs, allowing you to analyze the details of issues
● Synthetics for proactive testing of application programming interface (API) endpoints and websites to detect issues before they impact customers
● Real user monitoring for your browsers and mobile devices
● Network performance to manage and optimize traffic flow across the entire stack
With everything enabled in one platform, teams gain a single source of truth with zero context switching. Datadog’s machine learning and automated correlations enable insights and actionable information, from tracking service level objectives to real-time root-cause analysis and integrations with collaboration and workflow tools.
Customers can go from shopping for a Datadog plan in the Azure Marketplace to visualizing real-time Azure metrics in their Datadog account in minutes. They can streamline the purchase, configuration, and management of Datadog as a first-class service in the Azure portal.
Datadog’s listing in the Azure Marketplace simplifies the purchasing and invoicing for new customers by having their usage appear directly on their Azure invoice, consolidating their Datadog and Azure costs. Once customers have purchased a Datadog plan through the Azure Marketplace, they’ll immediately start receiving standard Azure Monitor metrics in their new Datadog account. To further simplify the setup process, customers can enable single sign-on with Azure Active Directory during Datadog account creation.
Customers can see all their Azure data in the same place as data from across the rest of their stack in other clouds or on premises, thereby streamlining their migration process to Azure.

Datadog’s Azure integration pulls in every metric users see in Azure and allows them to monitor new Azure services in real time automatically. The log-forwarding process from Azure to Datadog has also been completely automated: Rather than building out a log-forwarding pipeline with Diagnostic Settings, Event Hubs, and Functions, customers can configure everything with just a few clicks.
This makes it easier than ever to leverage Datadog’s powerful observability, compliance, and security capabilities for a successful cloud journey in Azure. The Datadog App Service Extension can also be added, managed, and deployed to our customer’s Azure Web Apps through the Datadog resource blade, simplifying the APM setup process.

by Contributed | Oct 3, 2021 | Technology
This article is contributed. See the original author and article here.
You can now assign incidents and alerts to someone else in your organization
To control and manage incidents and alerts in the organization, sometimes you would need to assign them to a specific analyst. Now you can do that right from the incident queue in Microsoft 365 Defender.
How does it work?
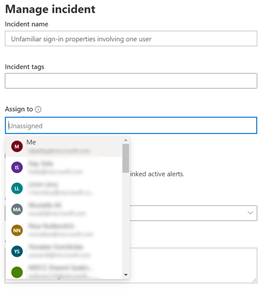
From the incident or alert side pane in the incident queue or the incident page, select Manage incident/alert and choose the user account you want to assign.
By default, the first value in the “assign to” drop menu will be yourself (“Me” at the title).
Note that you can choose all users from the organization, but only users with access to the Microsoft 365 Defender portal will be able to view the incident or alert. So, to help you assign the most relevant people in the organization, the rest of the default suggestions you will get are the latest assignees you chose.

Once the user is assigned, he can filter to see only incidents that are assigned to himself. A SOC manager that dispatches the incident queue can also filter for all unassign incidents or alerts to choose the relevant incident he would like to assign.
by Contributed | Oct 2, 2021 | Technology
This article is contributed. See the original author and article here.
Final Update: Saturday, 02 October 2021 11:43 UTC
We’ve confirmed that all systems are back to normal with no customer impact as of 10/02, 10:40 UTC. Our logs show the incident started on 10/02, 10:06 UTC and that during the 34 minutes that it took to resolve the issue some customers may have experienced data access and missed or delayed log search alerts in East US2 region.
- Root Cause: The failure was due to one of our dependent service.
- Incident Timeline: 34 minutes – 10/02, 10:06 UTC through 10/02, 10:40 UTC
We understand that customers rely on Azure Log Analytics as a critical service and apologize for any impact this incident caused.
-Deepika

Recent Comments