by Contributed | Feb 6, 2022 | Technology
This article is contributed. See the original author and article here.
Move from: bobsql.com
I received a question from Jonathan as he read over prior posts on locking and I cannot take credit for the question nor the answer, just being the middle man for this transaction.
Question:
“The way I have understood lock partitioning and a regular index rebuild to interact, is that the final SCH-M lock for the object is taken by acquiring it across all of the lock partitions, in ascending order to avoid any deadlock conditions. More precisely I understood that it does not even attempt to acquire the SCH-M in lock partition 4 say, until it has acquired it successfully in lock partition 3. Once the SCH-M is acquired in the final partition it’s good to go.
If we attempt the same with low priority waits for the index rebuild … on a non-partitioned system it seems straightforward, if my SCH-M request is blocked by an existing SCH-S, and a new SCH-S request arrives, it is not blocked by me. If we apply the same behavior on each lock partition in ascending order, then at the point where I am trying to acquire SCH-M in the final partition, that would mean I already have acquired it in all the lower partitions, and I would be blocking processes on every other scheduler.
Do you know how this works?” – Jonathan Kehayias
The developer’s (Panagiotis) answer:
The goal of WAIT_AT_LOW_PRIORITY is to avoid blocking any other requests while waiting for a lock. In the case of lock partitioning, the lock might be acquired on a few partitions and then end up waiting on partition 4 because there is a conflicting lock being held there. If we simply waited with low priority on partition 4, we would not block any new requests on partition 4, but since we are holding locks on earlier partitions the user requests would be blocked. Based on that, when WAIT_AT_LOW_PRIORITY is used, we wait with low priority on the first partition and if acquired we attempt to lock all other partitions without waiting. If we can’t take the lock on partition 4, we will unlock all earlier partitions to eliminate blocking and start waiting with low priority on 4. Once the lock on partition 4 is acquired, we follow the same process of acquiring the next partitions without waiting, cycling back to partition 0 once we hit the last partition.
Bob Dorr
by Contributed | Feb 5, 2022 | Technology
This article is contributed. See the original author and article here.
Moved from: bobsql.com
Download attachment to read the full content.
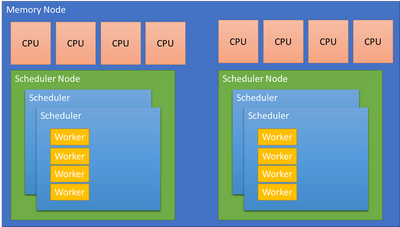
SQL Server uses 3 types of affinity to control where the SQL Server worker threads execute. Before explaining the different scheduler affinity types let me clarify some terminology.
Node Types
SQL Server makes a specific distinction between scheduling and memory nodes.
Scheduling nodes: sys.dm_os_nodes
Memory nodes: sys.dm_os_memory_nodes
A scheduling node is a used to group a set of SQLOS schedulers. The scheduling node must :
- Remain within a single memory node.
- Can be configured to use a subset of the CPUs presented by the OS from the same memory node.
For example: A memory node with 64 CPUs is a complete, Operating System, scheduler group. SQL Server may choose to divide the memory node allowing for better partitioning and performance. The Soft Numa feature may take the 64 CPUs and create 8 scheduler nodes, each managing 8 CPUs or 4 scheduler nodes managing 16 CPUs, etc. The decision is performance driven.
A memory node represents the memory associated with a group of CPUs from the physical hardware. SQL Server aligns schedulers and other partitioned structures with the memory node to reduce access to remote, NUMA node memory when possible. A memory node may have 1 or more scheduling nodes, but a scheduling node can only be assigned to a single memory node.
…
by Contributed | Feb 4, 2022 | Technology
This article is contributed. See the original author and article here.
Many organizations want to provide Microsoft Teams to their employees, but not in a “no strings attached” way. With our customers, we often see the need for a provisioning solution, so people aren’t creating teams without thinking.
With “traditional” team creation (i.e. the built-in “Create a team” functionality) a lot of the teams that get created don’t leverage the full potential that Microsoft Teams has to offer. When a team is created as a blank slate the owner has to know what the possibilities are and how to set it up, to create a team fit for their need. On the other hand, templates don’t satisfy users’ needs either. There is no such thing as “one size fits all”. Again, to modify it, the user needs to have a certain level of knowledge.
A different approach
To tackle these two challenges when it comes to Microsoft Teams provisioning, we had a vision of a provisioning solution where we blend learning with the process of creating your team. We provide the why, the user decides the what, and the tool takes care of the how. This is how ProvisionGenie ? was born.
ProvisionGenie is a tool that guides the user through the creation process. Someone who desires a team can start up the application from inside Microsoft Teams, so they stay in the flow of their work. They will need to provide some basic information such as the name, description, and members of the team. Then the tool continues with some of the essential building blocks of a great Microsoft Teams team: channels, lists and libraries. The user gets information on why they would care about these things, and they can customize them to their liking.
An enterprise-ready solution
ProvisionGenie is built with companies in mind: a scalable database, a reliable workflow engine and a Teams-like user interface.
The data is stored in Microsoft Dataverse, the relational database built into the Power Platform that allows for advanced security scenarios. In the current version, we focus on the front-end for the users of the application. By storing our data in Dataverse however, we can expand this relatively easily in the future with a model-driven application for administrators.
Azure Logic Apps take care of the workflows and logic of creating the team with its resources. Logic Apps not only offer better permission management, they can also be deployed across tenants automatically. They are more scalable and therefore performant compared to their low-code counterpart Power Automate.
Finally, a Power Apps canvas app is used to create a beautiful user interface that fits seamlessly into Microsoft Teams. With a canvas app, there is full control over the look and feel of the UI. The canvas app provides the different options to the user and saves the configuration in Dataverse. There is no direct link between the canvas app and the Logic Apps.

A community driven initiative
ProvisionGenie was born out of the collaboration of two community members because we wanted to provide a different solution for Microsoft Teams provisioning.
We decided quite early in the process that we wanted this to be a solution for the community, by the community. Therefore, this is an open-source project which you can find on GitHub (<<link>>) and to which everyone is welcome to contribute.
Bios
Carmen Ysewijn
Power Platform Architect | Microsoft Business Applications MVP
Carmen is a Business Applications MVP and Power Platform Architect at Qubix (Belgium) with a passion to find the right solution for any challenge that arises. With this solution-oriented approach, she helps customers improve their business processes. She loves to share the knowledge she gains along the way on her blog or speaking at conferences.
Luise Freese
Microsoft MVP, Microsoft 365 Consultant, Power Platform Developer
Luise helps customers around the globe to improve their business processes and to get rid of everything that only keeps them busy without adding value in a meaningful way. She is a member of the M365 PnP team and supports developers in extending Microsoft 365. She loves all things community, open-source, stickers, and the number 42.
To write your own blog on a topic of interest as a guest blogger in the Microsoft Teams Community, please submit your idea here: https://aka.ms/TeamsCommunityBlogger

by Contributed | Feb 4, 2022 | Business, Microsoft 365, Microsoft Viva, Technology
This article is contributed. See the original author and article here.
The pandemic has fundamentally changed how people value where they work, how they work, and most importantly—why they work. One year ago today, we announced Microsoft Viva to help accelerate this transformation.
The post Microsoft Viva celebrates 1 year: Transforming the employee experience appeared first on Microsoft 365 Blog.
Brought to you by Dr. Ware, Microsoft Office 365 Silver Partner, Charleston SC.
by Contributed | Feb 3, 2022 | Technology
This article is contributed. See the original author and article here.
Overview
Charting in Excel has long been an important tool our customers use to explore, analyze, and tell stories about their data. Until a few years ago however, Excel for the Web primarily served as consumption-based companion app to our desktop versions – this meant that users were limited in their ability to create and edit charts on the web. As part of the broader effort to evolve Excel for the Web, the team has been working hard to elevate the charting experience and is excited to share several major improvements we have made over the last couple years that are available to all free and paid customers. In this blog post, we’ll cover some of the most significant upgrades we’ve made, which provide users with a more robust chart editing experience.
The Format Pane and On-Chart Interactions
You can now leverage the format task pane and on-chart interactions to format charts on the web. The format pane provides formatting support for critical chart properties (axes, legend, data series, etc.) and makes it easy to view and navigate to each editable chart element. You are now able to make property edits to elements of a chart such as the fill/outline color, number format, axis bounds, and more.
You can now also directly select the individual elements within a chart to launch and navigate to their respective formatting options in the format pane. Previously, users could only select the entire chart but not any contents within the chart.
To explore these new capabilities, launch the task pane by double-clicking anywhere on the chart or by right-clicking and selecting “Format”. From there, you can view each chart element’s formatting options by either selecting an element within the chart or expanding the options in the format pane.
Launch and navigate the Chart Format Pane by directly interacting with chart elements
Support for Adding & Removing Chart Elements
You can now also add and remove chart elements without having to leave the format pane. Users can leverage the new on/off toggles in the pane to choose whether to include a chart element in the chart. Alternatively, you can use the delete/backspace keys to remove a chart element that is selected. We have also added support for adding/removing trendlines and error bars.
 Use the Chart Format Pane’s toggles to add/remove chart elements from your chart
Other Improvements
- You can now select data from non-adjacent rows to create a chart. Previously, users were limited to creating charts from a continuous range of cells.

- You can now freely change between all different chart types. Previously, some chart type changes were not supported.
- We have also added undo/redo support for all chart commands and enabled sheet duplication for worksheets containing any chart type.
Stay tuned as we continue to improve Excel’s web charting experience – we’ll be sharing more updates as new features become available!
Your feedback is important for us! Tell us what you think about these improvements to the charting experience in Excel for the web by writing a comment on this blog post or Send us a smile or frown. You can also submit new ideas or vote for other ideas via Microsoft Feedback.
Want to know more about Excel for the web? See What’s new in Excel for the web and subscribe to our Excel Blog to get the latest updates. Stay connected with us and other Excel fans around the world – join our Excel Community and follow us on Twitter.

Recent Comments