This article is contributed. See the original author and article here.
Azure compute benchmark is now aligned with CIS
Security benchmarks help organizations strengthen their security posture and meet various cloud security compliance requirements. The Microsoft cloud security benchmark announced at Ignite 2022 provides clear and concrete guidance to securely configure cloud resources.
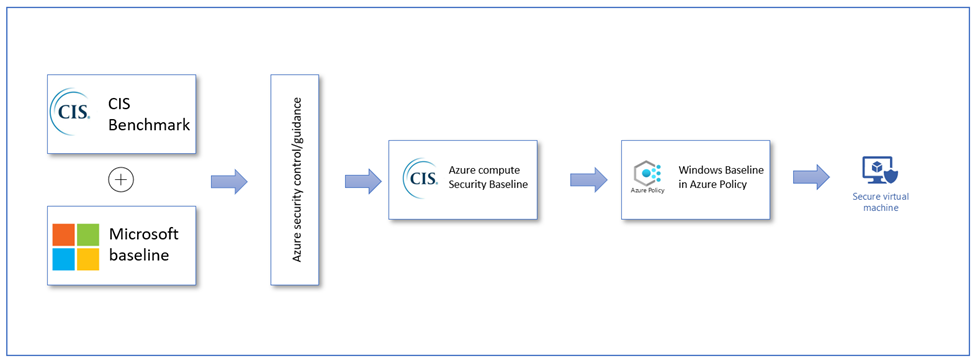
Today, we are excited to announce a new Azure compute benchmark for Azure virtual machines. This newly released benchmark has the CIS recommended security configurations aligned with the Azure environment. this new benchmark takes into consideration the cloud-specific security controls and removes non-applicable controls that have no significant risk impact in cloud environment.
Figure 1: Azure Security and CIS benchmark team collaboration
Benchmark usage scenarios
Using Microsoft Defender for Cloud:
You will be able to monitor the security baseline settings for Windows Server in the Microsoft Defender for Cloud portal by going to the ‘Remediate Security Configurations’ in ‘Recommendations’ section and selecting ‘Vulnerabilities in security configuration on your Windows machines should be remediated (powered by Guest Configuration)’
Figure 2: Microsoft Defender for Cloud Portal
You will be able see the status of each baseline rule, view baseline failures through ‘Expected’ and ‘Actual’ values, understand the risk and impact of each misconfiguration, and view additional steps to remediate them.
Figure 3: Windows Baseline Recommendation
Using as a ‘BuiltIn’ Policy in Azure Policy Portal:
Alternatively, you can also leverage the Windows Baseline available as a built-in policy to monitor the security configurations setting of your Windows servers. You can assign the “Windows machines should meet requirements of the Azure compute security baseline” and monitor the compliance results in the Azure Policy portal.
Figure 4: Azure Policy Portal
What Next?
Achieving CIS benchmark certification for the Azure compute baseline: We will be working with the CIS benchmark team to certify the benchmark monitoring implementation to ensure it meets the CIS requirements.
Publishing a Linux baseline for Ubuntu distributions that is specific to Azure compute: Similar to Windows Server Benchmark, we will be working with CIS benchmark team to develop the Linux baseline for Ubuntu distributions specific to Azure.
We want to thank the CIS benchmark team, contributors from the CIS community and multiple teams within Microsoft for their help with publishing the benchmark!
If you would like to participate in improving the benchmark or provide feedback, please send us an email. We would love to hear your success stories and feedback on how to make it better!
This article is contributed. See the original author and article here.
Hello to our illustrious and awesome readers!
Brandon Wilson here today with a short post just to give our readers a heads up on an excellent learning opportunity that we thought it might be helpful for many of you.
Since there is already content out there, I won’t be going into depth on this, other than to say it will cost you a couple of hours, for a couple of days, and we anticipate the time will be well spent! Go forth and learn (and then pass the knowledge around)! The below content summary will take you to the page to see upcoming workshop dates/times, as well as provide you with the registration link.
So, without further ado, let’s introduce this CTO! style:
Join us to learn how to successfully migrate from AD FS to Azure AD to benefit from improved security and better user experience for your organization. During this in-depth workshop, we want to share why other customers have moved to Azure AD, and what to keep in mind to successfully migrate from AD FS.
Thanks for reading, and I hope this helps you out…we’ll see you on Azure (AD)!
This article is contributed. See the original author and article here.
To run a digital contact center effectively, supervisors need up-to-the-minute insights on all the activity between agents and customers. With new enhancements to Microsoft Dynamics 365 Customer Service, it’s easier than ever to find and customize the historical analytics you need to identify key areas for improvement. Last month, we released four new features that will change the way you view Customer Service data:
Unified reporting across Power Virtual Agents and Omnichannel
Bookmarks for frequently used reports
Contact center operations monitoring in near real-time (preview)
Data model customization (preview)
Unified reporting of customer service data across Power Virtual Agents and Omnichannel
As a contact center supervisor, you need to know how your customers are navigating the support funnel. This information helps you take corrective steps at each leg of the customer journey to increase customer satisfaction and reduce cost. When customer journey data is fragmented across different applications, it’s hard to understand what actions to take to improve.
Dynamics 365 Customer Service now provides a unified report with Power Virtual Agents and Omnichannel analytics. You can easily monitor escalations from bots to human agents. These integrated insights help you more efficiently handle case volumes. Revise Power Virtual Agents bots based on the agent resolution steps of escalated conversations to increase the deflection rate.
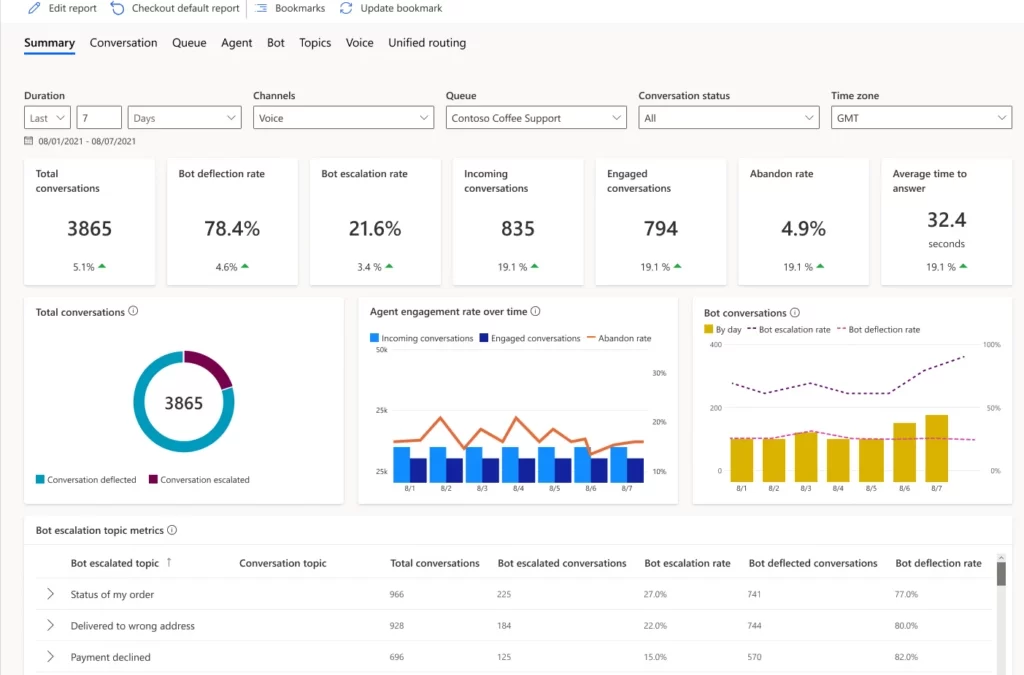
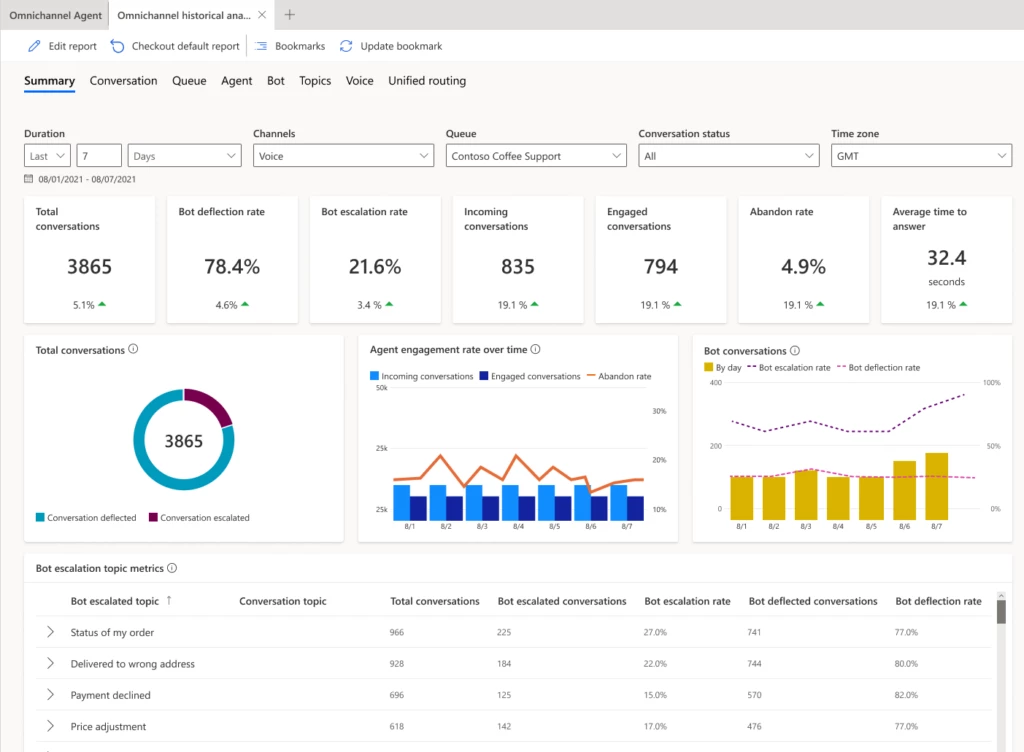
The Omnichannel Summary dashboard provides integrated analytics. You’ll find key metrics across Power Virtual Agents and agent conversations across channels. Use the Omnichannel Bot dashboard to see detailed bot session-level metrics and identify why the conversation was escalated to a human agent.
You can also drill down into specific bot pages and view topic-specific metrics. Make changes to the bot to enhance its performance, including modifying the topic name and trigger phrases and adding more trigger phrases if needed.
Bookmarks for frequently used customer service data reports
Bookmark frequently used out-of-the-box historical analytics reports to personalize your workspace. You can set a default bookmark that will be loaded every time you start a new session. Navigate between bookmarks in the bookmarks side panel, update the corresponding report with filters, and delete bookmarks you no longer need.
Contact center operations monitoring in near real-time (preview)
One of the biggest challenges supervisors face is the constantly changing nature of the digital contact center. You must handle everything from spikes in incoming customer requests to new agent training to unexpected absences in your workforce. With near real-time visibility into your overall support organization, you can make quick decisions and allocate your agents appropriately.
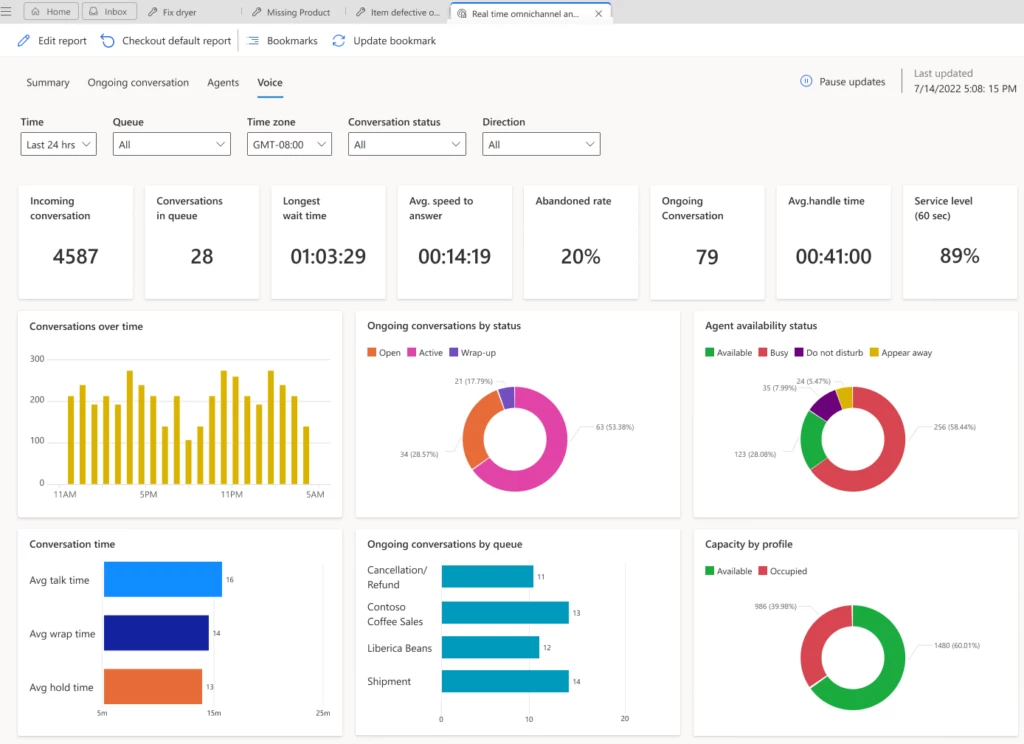
Using four new reports, you can monitor the volume of customer interactions, wait time, and other key metrics across multiple channels. Reports automatically refresh in real-time. However, you can pause the process to analyze the metrics and then resume automatic refresh when you’re finished. Near real-time analytics are in the following reports:
Summary report: View key performance indicators (KPIs) across the volume of customer interactions and service levels, along with the available capacity. You can filter metrics by time, channels, queue, time zone, or conversation status.
Ongoing conversation report: View a list of all current conversations along with the wait time and handle time, and drill down to the conversation form.
Agents report: View agent performance across all channels or a single channel. You can also see the current agent capacity and what each agent is working on, with detailed metrics for each agent.
Voice report: Shows key metrics across the voice channel, if the voice channel is configured in your Omnichannel environment. You can filter metrics by time, queue, time zone, conversation status, or direction.
Digital contact centers have diverse needs and goals, so they need metrics that are relevant to their industry and business. When out-of-the-box metrics don’t fit your unique business needs, you might build a separate analytics infrastructure to integrate and store your data. This leads to higher overhead and maintenance costs.
With data model customization, administrators can extend the out-of-the-box Customer Service Power BI data model. To track what matters most to your business, add new custom metrics, custom entities from Dataverse or any other data source, or integrate with an external data set. Customized reports can be embedded in the Customer Service workspace application.
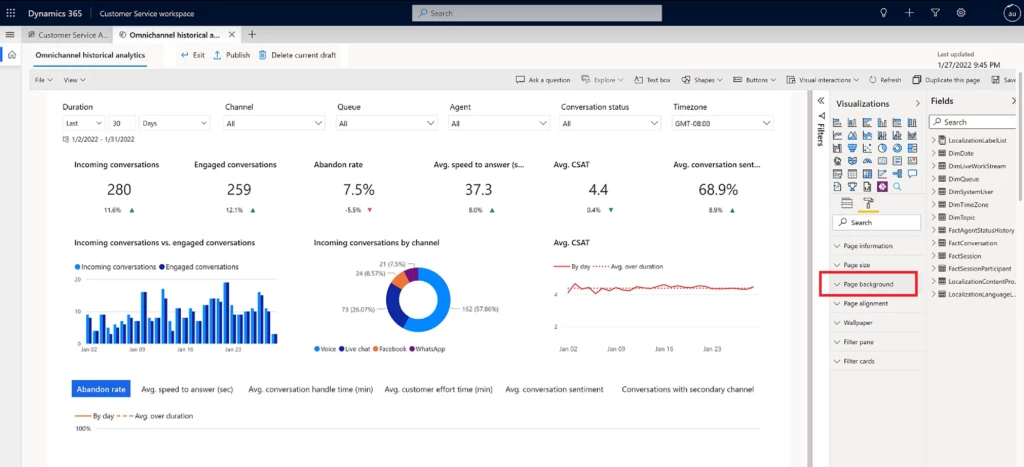
Report authors can also customize fields containing measurements and attributes, and visualizations such as filters, page size, and page background.
By extending out-of-the-box analytics available natively in Dynamics 365 Customer Service, every organization can handle its unique business requirements in a fraction of the time instead of reengineering and maintaining costly data warehouses.
This article is contributed. See the original author and article here.
TheAzure Well-Architected Framework (WAF) helps ensure that Azure workloads are reliable, stable, and secure while meeting SLAs for performance and cost. The WAF tenets are:
Security– Protecting applications and data from threats.
Applying the Azure WAF to your Azure Data Factory (ADF) workloads is critical and should be considered during initial architecture design and resource deployment. If you haven’t already, check out this companion blog on Azure Data Factory Patterns and Features for the Azure Well-Architected Framework. But how do you ensure that your ADF environment still meets WAF as workloads grow and evolve?
All Azure resources offer the capability to build dashboards over costs, but don’t necessarily give you the detail needed or have the alerting capabilities when an issue arises. You can view pipeline activity within the Data Factory itself, but this does not allow you to create aggregated reports over activities and pipelines over time.
Create alerts over ADF metrics, leverage Azure Monitor and Log Analytics for detailed and/or summarized information about your Data Factory activities and/or create your own notification framework within Data Factory, helping your Data Factories to continue to be optimized for cost, performance and reliability.
Using metrics and alerts in Data Factory
Metrics are essentially performance counters, always returning a number, and are leveraged when you configure alerts.
Configure alerts for failures
Configure ADF metrics and alerts to send notifications when triggers, pipelines, activities or SSIS packages fail. In the example below, an alert will be issued whenever the activity name “cdCopyTextToSQL” fails:
If the pipeline runtime exceeds the duration defined in the Elapsed time metric Pipeline Settings, an alert will be issued.
Set Alerts on Self-Hosted Integration Runtimes
Self-Hosted Integration Runtimes (SHIRs) are used to move and transform data that resides in an on-premises network or VNet. Set alerts to ensure resources are not overutilized or queuing data movement requests:
The following metrics are available:
Integration runtime available memory (IntegrationRuntimeAvailableMemory) – be notified when there are any dips in available memory
Integration runtime available node count (IntegrationRuntimeAvailableNodeNumber) – be notified when nodes in a SHIR cluster are not available or not being fully utilized
Integration runtime CPU Utilization (IntegrationRuntimeCpuPercentage) – be notified when there are spikes in CPU or when CPU is being maxed out
Integration runtime queue duration (IntegrationRuntimeAverageTaskPickupDelay) – be notified when the average activity queue duration exceeds a limit
Integration runtime queue length (IntegrationRuntimeQueueLength) – be notified when there are long waits between activities
ADF has resources limits per Azure subscription. If you expect a Data Factory will have a large number of pipelines, datasets, triggers, linked services, private endpoints and other entities, set alerts on the count of Total entities to be notified when Data Factories start approaching the limit (Default Limit is 5000). For example:
You can also set an alert or query on Total factory size (GB unit) to ensure the Data Factory will not exceed the data factory size limit (2 GB default).
Leveraging alerts in ADF allows you to be immediately notified when pipelines are failing or when resources are reaching their limits, supporting WAF tents of Cost Optimization, Reliability, Operational Excellence, and Performance Efficiency.
Use Azure Monitor with Log Analytics over Data Factory
Azure Monitor provides verbose information about your ADF triggers, pipelines, and activities for further analysis.
Add diagnostic settings
Add diagnostic settings to your Data Factory, enabling Azure Monitor to provide detailed information such as activity duration, trends, and failure information.
Send this data to Log Analytics to query in with the Kusto Query Language(KQL), build Azure workbooks from KQL queries, or export to Power BI for further transformation and analysis.
(In my Data Factories, I do not use SSIS therefore I do not have them configured.)
Explore logs with KQL
In the Azure Portal for the Data Factory where you configured the diagnostic settings, go to Monitoring -> Logs to query the corresponding Log Analytics tables containing the run information about my Data Factory:
Detailed Failure Information
Run queries to get detailed information or aggregated information around failures, as in the example below:
ADFActivityRun
| where Status == 'Failed'
| project ActivityName, TimeGenerated, Error, Input, Output
Extrapolate costs for orchestration
Costs in Azure Data Factory are based upon Usage. Costs are based upon the number of activities run or triggered, the type of Integration Runtime (IR) used, the number of cores used in an IR, and the type of activity. Get the latest pricing details here
Calculations for Orchestration activities are simple: sum up the number of failed or successful activities (ADFActivityRun) plus the number of triggers executed (ADFTriggerRun) plus the number of debug runs (ADFSandboxPipelineRun). The table below summarizes the cost per 1000 runs (as of 11/14/2022):
Activity Type
Azure IR
VNet Managed IR
Self-Hosted IR
Orchestration
$1/1000 Runs
$1/1000 Runs
$1.50/1000 Runs
Here’s a sample query to the number of activity runs, where you can apply the cost per IR:
ADFActivityRun
| where Status != "Queued" and Status != "InProgress"
| where EffectiveIntegrationRuntime != ""
| summarize count() by EffectiveIntegrationRuntime
Costs are also accrued based upon the type of activity, the activity run duration, and the Integration Runtime used. This data is available in the ADFActivityRun table. Below are the cost details for pipeline activities by IR (for West US 2, as of 11/14/2022):
Activity Type
Azure IR
VNet Managed IR
Self-Hosted IR
Data movement activities
$0.25/DIU-hour
$0.25/DIU-hour
$0.10/hour
Pipeline activities
$0.005/hour
$1/hour
$0.002/hour
External pipeline activities
$0.00025/hour
$1/hour
$0.0001/hour
The example query below derives the elements highlighted above that contribute to the Activity cost:
ADFActivityRun
| where Status != "Queued" and Status != "InProgress"
| project ActivityJson = parse_json(Output)
| project billing = parse_json(ActivityJson.billingReference.billableDuration[0]), ActivityType = parse_json(ActivityJson.billingReference.activityType)
| where ActivityType =="PipelineActivity"
| evaluate bag_unpack(billing)
| project duration, meterType, unit
Dataflow activity costs are based upon whether the cluster is General Purpose or Memory optimized as well as the data flow run duration (Cost as of 11/14/2022 for West US 2):
General Purpose
Memory Optimized
$0.274 per vCore-hour
$0.343 per vCore-hour
Here’s an example query to get elements for Dataflow costs:
ADFActivityRun
| where Status != "Queued" and Status != "InProgress" and ActivityType =="ExecuteDataFlow"
| project ActivityJson = parse_json(Output), InputJSon = parse_json(Input)
| project billing = parse_json(ActivityJson.billingReference.billableDuration[0]), compute = parse_json(InputJSon.compute)
| evaluate bag_unpack(billing)
| evaluate bag_unpack(compute)
Costs on Data Factory operations are also incurred, but these are generally insignificant (costs as of 11/14/2022, US West 2):
Some organizations prefer to build their own monitoring platform, extracting pipeline input, output, or error information to SQL or their data platform of choice. You can also send email notificationswhen an activity fails.
Monitoring your data factories, whether it is with the built-in features of Azure Metrics, Azure Monitor and Log Analytics or through your own auditing framework, helps ensure your workloads continue to be optimized for cost, performance and reliability to meet the tenets of the WAF. New features are continually added to Azure Data Factory and new ideas evolve as well. Please post your comments and feedback with other features or patterns that have helped you monitor your data factories!


Recent Comments