by Scott Muniz | Dec 14, 2021 | Security
This article was originally posted by the FTC. See the original article here.
As residents across Kentucky, Illinois, Tennessee, Arkansas, and Missouri begin taking stock following the devastating series of tornadoes that hit their states, you might be looking for ways to help the people and communities affected. Unfortunately, scammers also are busy trying to take advantage. You want to make sure your money gets in the hands of charities you want to help.
If you’re looking for a way to help, the FTC urges you to be cautious of potential charity scams. Do some research to ensure that your donation will go to a reputable organization that will use the money as promised.
Consider these tips:
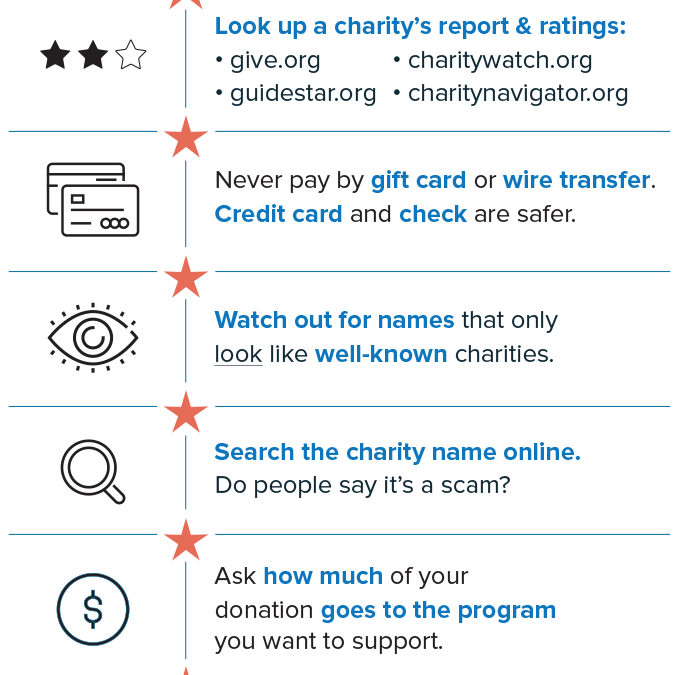
- Donate to charities you know and trust with a proven track record with dealing with disasters.
- Be alert for charities that seem to have sprung up overnight in connection with current events. Check out the charity with the Better Business Bureau’s (BBB) Wise Giving Alliance, Charity Navigator, Charity Watch, or GuideStar.
- Designate the disaster so you can ensure your funds are going to disaster relief, rather than a general fund that the charity could use for any of its work.
- If you get donation requests by email, never click on links or open attachments in e-mails unless you know who sent it. You could unknowingly install malware on your computer.
- Don’t assume that charity messages posted on social media are legitimate. Research the organization yourself.
- When texting to donate, confirm the number with the source before you donate. The charge will show up on your mobile phone bill, but donations are not immediate.
- Find out if the charity or fundraiser must be registered in your state by contacting the National Association of State Charity Officials. If they should be registered, but they’re not, consider donating through another charity.
To learn more, go to ftc.gov/charity. For tips to help you prepare for, deal with, and recover from a natural disaster or severe weather event, visit Dealing with Weather Emergencies.
Note: This blog, originally posted on September 3, 2021, has been updated following the December 11-12 series of tornadoes.
Brought to you by Dr. Ware, Microsoft Office 365 Silver Partner, Charleston SC.
by Contributed | Dec 14, 2021 | Technology
This article is contributed. See the original author and article here.
Organizational charts can be an essential tool for any growing organization, especially now when new hires are trying to figure out their place in the company without actually meeting their colleagues in person. Org charts can help visualize reporting structures and quickly provide employees with information they need—such as titles, roles, and responsibilities—to move processes forward. They can also be a practical tool for planning and evaluating re-structuring efforts or identifying open positions that need to be filled.
The Microsoft Visio desktop app has long supported the creation of org charts, complete with photos and personnel information, and the ability to automatically create org structures from data sources like Excel, Exchange, and Azure Active Directory.
As of today, users with a Visio Plan 1 or Visio Plan 2 license can now create org charts in the Visio web app, too. Alternatively, they can start creating org charts from data directly in Excel using the Data Visualizer add-in and further edit those diagrams using new org chart shapes in Visio for the web.
New org chart stencils and layouts in Visio for the web
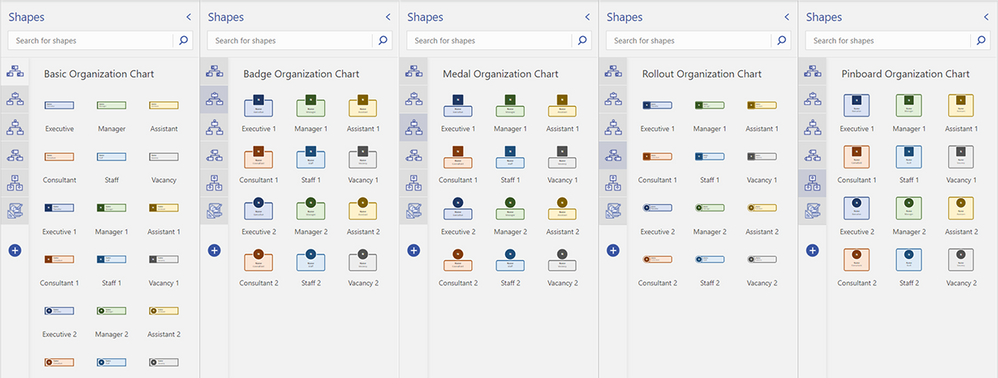
As part of this release, we’ve added five org chart stencils—Basic, Badge, Medal, Rollout, and Pinboard—with predefined, color-coded shapes that can easily be dragged onto the canvas to represent each employee or vacancy in your team, department, or organization. You can also choose from shapes that populate the initials of your employees’ names. Once you’ve added the new shapes to the canvas, you can add information, such as name, title/role, contact details, and location. Then, use connectors to show the hierarchy.
Five available org chart stencils now available—Basic, Badge, Medal, Rollout, and Pinboard—and shapes included in Visio for the web
We’ve also added eight new layout options—top to bottom, bottom to top, left to right, right to left, side-by-side, and hybrid combinations—so you can quickly visualize the hierarchy of your team, department, or organization how you want. Once your shapes are connected, select Layouts from the Organization Chart tab. Then, select your preferred layout.
 Eight org chart layout options available from the Organization Chart tab in Visio for the web
To help you get started quickly, we’ve also provided a few starter diagrams, representing various org chart scenarios, including HR management and Scrum Team structure.
 Available templates showing different organization charts in Visio for the web
To get started, visit office.com/launch/visio, select your preferred diagram template, and start visualizing your team structure. Visit our support article on how to create an organization chart in Visio to learn more.
Starting from the Visio Data Visualizer add-in in Excel
The Data Visualizer add-in is available for Excel on PC, Mac, and Excel for the web with a Microsoft 365 work or school account. You can access the add-in from the Visio Data Visualizer button in the ribbon of the Insert tab. If you are unable to find the button in the ribbon, select Get Add-ins and search for “Visio Data Visualizer” in the search box. Once the add-in has been added, you can select the Visio Data Visualizer button to quickly create a diagram from Excel data.
Select one of the five organization chart layouts available in the Data Visualizer add-in.
 Blank Excel spreadsheet showing the five org chart layout options available from the Visio Data Visualizer add-in
You can quickly replace the sample data in the Excel table with your organization’s data—including Employee ID, Name, Manager ID, Title, and Role Type—for each person you want to include in your org chart, then select Refresh.
 Data table and org chart in an Excel spreadsheet
If you have a subscription to Visio, you can further edit the diagram by changing the theme, modifying the layout, and adding and formatting the text. To further edit the org chart in Visio for the web, select either Edit in the diagram area or the ellipses (…) > Open in web.
After opening your diagram in Visio for the web, you will see the Basic Organization Chart stencil and shapes pinned to the Shapes pane. You can update your diagram using these basic shapes or also search for new shapes by typing a keyword in the search box and selecting the magnifying glass. Drag the shape you want from the stencil onto the canvas or pin the stencil to the Shapes pane for easy access.
 Organization chart in Visio for the web
When you’re done, hit the Share button in the upper right corner to invite your colleagues to collaborate on your diagram and provide feedback.
Please note: Any changes made in Visio for the web—beyond adding and formatting text, changing the theme, or changing the diagram’s layout—cannot be synced back to the original Excel source file. For more details on how to create an org chart based on Excel data using the Visio Data Visualizer add-in, please review our support article.
We’re excited about the future of Visio, and we look forward to hearing your feedback to make the Visio web app the diagramming tool to convey information and processes more effectively. Please tell us what you think in the comments below or send feedback via our new Feedback portal!
Continue the conversation by joining us in the Microsoft 365 Tech Community! Whether you have product questions or just want to stay informed with the latest updates on new releases, tools, and blogs, Microsoft 365 Tech Community is your go-to resource to stay connected!

by Contributed | Dec 14, 2021 | Dynamics 365, Microsoft 365, Technology
This article is contributed. See the original author and article here.
Today, nothing is certain for brands. Standing still means falling behind. Heritage brands are no different. Now more than ever, brands need to find authentic ways to engage with digitally-savvy consumers no matter where they are. How do brands steeped in tradition create modern experiences that resonate with today’s digital-native consumers?
Heritage brands like Campari and Leatherman are at a pivotal moment in their rich history, as consumer behavior shifts seemingly overnight. To adapt, these established brands turned to Microsoft Customer Experience Platform to forge direct relationships with consumers. Hyper-personalizing experiences while retaining their unique brand personality is made possible by combining digital technology with their brand and marketing strengths to attract and retain customers. Individualized journeys require real-time insights gleaned from customer data and infused into line-of-business applications, and seamless activation across a growing number of customer touchpoints. Privacy-aware, consent-enabled personalization powered by AI enables the brands to engage each customer at precisely the right moment with the right touch, at scale.
Unify and predict to personalize experiences
Campari Group, the 160-year-old alcohol spirits manufacturer, found it challenging to collect and analyze data to accurately predict customer needs. To derive value from the vast amount of customer data, Campari turned to Microsoft Dynamics 365 Customer Insights, a customer data platform (CDP) that’s part of Microsoft Customer Experience Platform to unify fragmented customer data and generate AI-powered insights that reveal the next best action.
Because of the sensitive nature of customer data, security and compliance were very important considerations. With the most advanced data governance and consent management capabilities, Dynamics 365 Customer Insights was the obvious choice.
Moving forward, Campari is taking experiences to the next level with real-time, customer-led journey orchestration in order to hyper-personalize experiences across different touchpointslike email, mobile, social, and in-personaccording to marketing segments and consumer types.
“Customer journey orchestration in Dynamics 365 Marketing promotes contextually relevant and consistent real-time conversations with every customer across all interaction points. We can more precisely align marketing messages for each communication channel to gain the greatest impact. We see the effects in in-store sales and also in e-commerce, which is particularly important during COVID-19We want to use this data in an end-to-end way, from marketing to sales to customer service, capturing and optimizing the entire customer journey.”Chad Niemuth, Vice President, Global IT Marketing and Sales, Campari Group.
By unifying data and deriving insights, Campari is now better prepared for new opportunities, whether it’s launching a new product, entering a new market, or building customer loyalty.
Engage in new ways
Whether customers are engaging with your brand virtually, in-person, or both, Microsoft can help create a seamless customer journey across channels. Leatherman, a leader in high-quality multi-tools, pocket tools, and knives for 37 years, needed a solution to meet their growing direct-to-consumer business. They wanted to curate a more personalized customer journey and to create user experience continuity with their online store. They leveraged customer journey orchestration to deliver an end-to-end welcome journey for their new customers.
Leatherman was able to create multi-touchpoints that allowed them to engage their customers across commerce and marketing using real-time custom events. This journey was executed every time a customer signed up or started to check out on their website. It allowed Leatherman to seamlessly activate new customers and to create opportunities for continued engagement along the way.
“We have the flexibility to trigger our journeys in multiple ways from our website and our other Dynamics products, and products from other vendors. The journey can also react to customer activities in real-time.”Liz Lee, IT Director, Leatherman Tool Group.
Leatherman gained a 360-degree view of their customer, was able to break down silos between existing systems, use the data to drive insights, and better tailor the customer experience.
When you have true multi-channel personalization that keeps your customer top of mind, you not only create a better experience for them, but also build brand loyalty. These individualized customer journeys keep them coming back for more and can turn customers into ambassadors for your brand.
Learn more
Take your brand into the future by creating tailored, delightful customer journeys with Microsoft Customer Experience Platform, an end-to-end solution that safely unifies and protects your customer data while inspiring trust and loyalty.
The post Shaping the future of retail with Microsoft Customer Experience Platform appeared first on Microsoft Dynamics 365 Blog.
Brought to you by Dr. Ware, Microsoft Office 365 Silver Partner, Charleston SC.
by Contributed | Dec 14, 2021 | Dynamics 365, Microsoft 365, Technology
This article is contributed. See the original author and article here.
When unified routing is running smoothly for your customer service organization, incoming work items are routed to the best agent and the service workload is optimized and efficient. Depending on the needs of your business, the underlying routing infrastructure can get complex over time. When something goes wrong, it can take some effort to troubleshoot the issue. Recent updates to the unified routing capability in Dynamics 365 Customer Service help you streamline the problem-solving process.
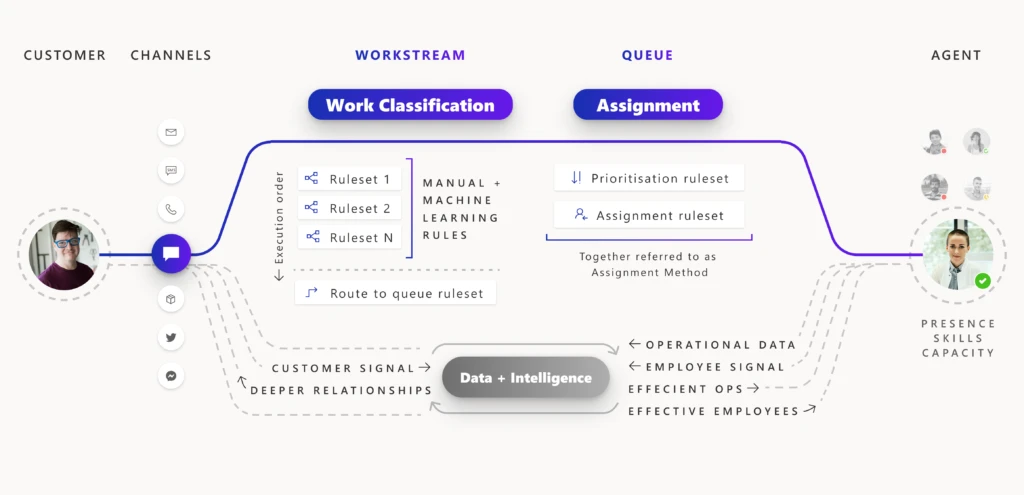
Unified routing stages for classification and assignment
The architecture of unified routing lets you divide your routing setup into stages, and then optimize each stage individually. The classification stage lets you create rules that use customer datawhether direct or subtleto add insights to the incoming work item. You can also use machine-learning models like intelligent skill finder, sentiment prediction, and effort estimation in this stage. The insights added are then used in the assignment stage to prioritize and assign the work item to the best suited agent or queue for resolution.
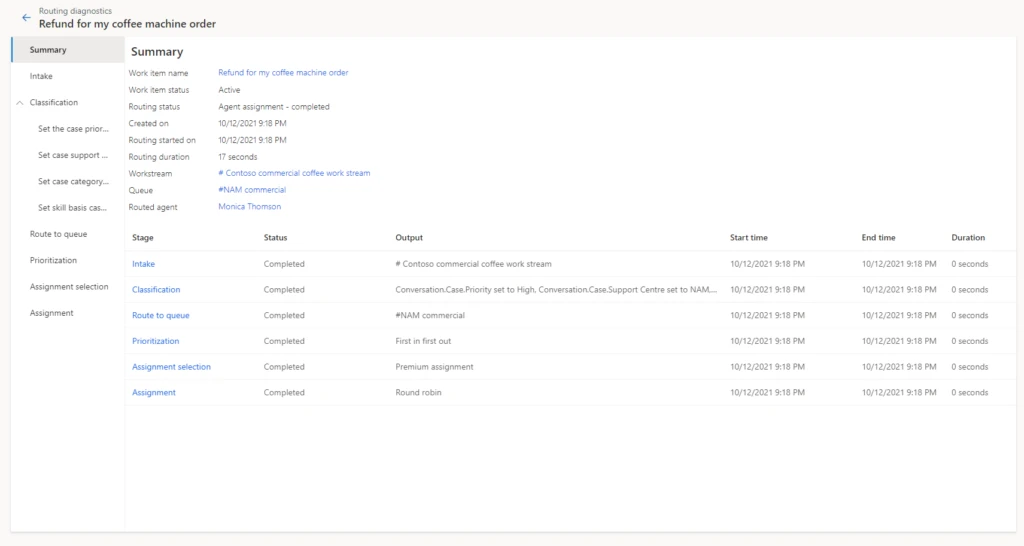
For every incoming work item, rules within each applicable stage are processed so that the work item is assigned to the best agent. Diagnostics are generated from this processing, and you can view those diagnostics on each stage. You can look at how a work item was classified, how it was routed to a certain queue, and how it was prioritized and assigned.
Problem solving with unified routing diagnostics
When there is a problem with this routing setup, you use diagnostics to get insights into what might be wrong. You can see why certain work items are taking longer to assign, and you can also see why an item could be incorrectly assigned. More information: Diagnostics for unified routing
Historically, only administrators had access to diagnostics from Customer Service Hub or the Omnichannel admin center app. So, only the administrator had the ability and responsibility to create rules, view diagnostics, search for misroutes, edit rules to fix issues, and optimize the routing setup.
But during day-to-day operations, it is the supervisors and customer service managers who are responsible for the performance of the queues and the agents they manage. Issues usually surface here first, before they come to the attention of the administrator. Therefore, supervisors and managers now have access to historical analysis for unified routing. These reports surface KPIs for measuring the efficiency of all resources. While analytics tell your staff that something is not right, they need more tools to dig deep and pinpoint the core issue.
To help with this, we have extended the access to diagnostics to supervisors. Now supervisors can look at individual work items in queues that they manage and diagnose why each work item was routed in a certain way. If the routing is not as expected, they can inform the administrator and even make suggestions to improve the current setup.
Unified routing diagnostics scenario
Let’s consider an example. Imagine a scenario where a supervisor is managing queues for coffee machine refund requests. Previously, there were only two queues, one for customers at the Bronze level and one for those at Gold or Silver service levels. Now, the organization has added a third queue exclusively for Gold-level service customers. The supervisor wants to ensure that the new queue for refunds to Gold status customers is working properly.
Reviewing analytics, the supervisor can see that work items in the Silver queue have a higher session transfer rate. With access to diagnostics, the supervisor can investigate further by opening Routing diagnostics, selecting the Silver queue, and reviewing the diagnostics records for some of the recent work items.
In our scenario, the supervisor looks at the rules that are applied to the work items, as seen in the image below, and quickly notices that the route to queue rule has incorrect logic that sends work items to the Silver refunds queue instead of Gold. Note that the finalidentified queue is displayed at the top of the page in the route to queue stage, which makes it even easier for the supervisor to check the queue identified.
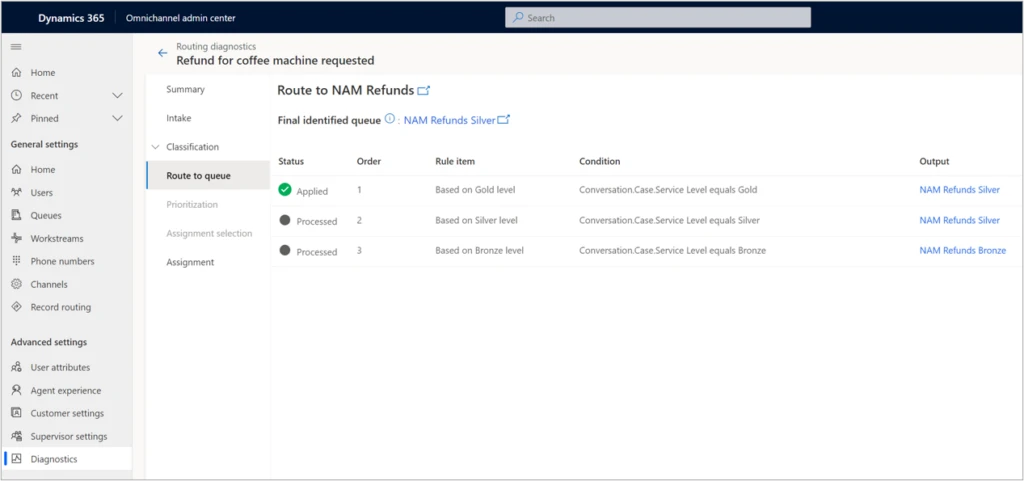
To quickly mitigate this issue, the supervisor can manually assign the appropriate work items to the correct queue, where they will then be assigned to the right agents. Now that the supervisor was able to unravel the mystery behind the increase in session transfer rate, they can bring up the issue to the administrator, who can make the required rule change and fix the problem.
Analytics and diagnostics are powerful tools. With broader access to these tools, your organization can gain better efficiency as you more quickly evolve your routing setup.
Next steps
With 2021 release wave 1, take advantage of the benefits of unified routing in Dynamics 365 Customer Service. Check out the system requirements and availability in your region. Also, read more in the documentation:
This blog post is part of a series of deep dives that will help you deploy and use unified routing at your organization. See other posts in the series to learn more.
The post Use diagnostics to optimize unified routing for your call center appeared first on Microsoft Dynamics 365 Blog.
Brought to you by Dr. Ware, Microsoft Office 365 Silver Partner, Charleston SC.

Recent Comments