by Contributed | Dec 31, 2021 | Technology
This article is contributed. See the original author and article here.
Overview:
We sometimes see customers asking questions related to a discrepancy between the server storage usage and their expectations on the actual data usage. In this blog we will go through how to investigate storage consumption for Azure Database for PostgreSQL.
Solution:
In this section, I am listing down some thoughtful insights and recommendations to breakdown the storage usage to some extent.
1) First and foremost, monitor the server storage usage using the available Azure PostgreSQL Metrics:
Storage percentage |
Percent |
The percentage of storage used out of the server’s maximum. |
Storage used |
Bytes |
The amount of storage in use. The storage used by the service may include the database files, transaction logs, and the server logs. |
Server Log storage percent |
Percent |
The percentage of server log storage used out of the server’s maximum server log storage. |
Server Log storage used |
Bytes |
The amount of server log storage in use. |
Server Log storage limit |
Bytes |
The maximum server log storage for this server. |
Storage limit |
Bytes |
The maximum storage for this server. |
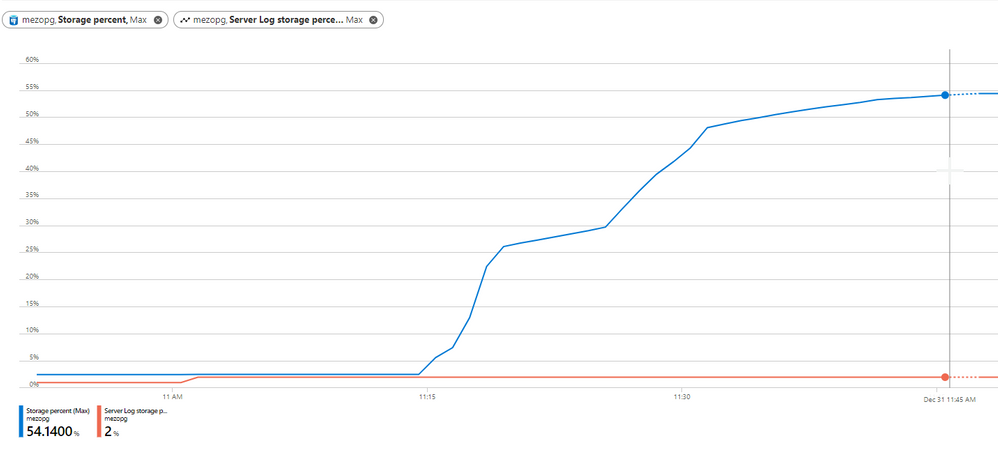
On Azure Portal, you can use more than one metrics as shown in below figure:
Note:- Azure PostgreSQL flexible server comes with “Transaction Log Storage Used” metric, which depicts the amount of storage space used by the transaction logs. |
2) The following queries can help you to have insights upon the database storage usage:
- run below query to know each database size
SELECT pg_database.datname as "database_name", pg_database_size(pg_database.datname)/1024/1024 AS size_in_mb FROM pg_database where datname not like ('%azure%') ORDER by size_in_mb DESC;
- Check out the tables’ vacuum status, if dead rows are being vacuumed using pg_stat_user_tables
SELECT relname,n_dead_tup, n_tup_del,n_tup_upd, last_vacuum, last_autovacuum,last_analyze,last_autoanalyze FROM pg_stat_user_tables;
- You can get each database temporary files and size using view pg_stat_database
SELECT * FROM pg_stat_database;
- A quick look at view pg_stat_archiver can be a good idea, the view is showing statistics about the WAL archiver process’s activity.
select * from pg_stat_archiver;
3) Examine the following server parameters which might contribute into the storage usage growth
The general advice that you should be careful with the verbose logging, More information can be found in my colleague blog How to configure Postgres log settings – Microsoft Tech Community
It worth to mention that you can set the retention period for this short-term log storage using the log_retention_period parameter. The default value is 3 days; the maximum value is 7 days. The short-term storage location can hold up to 1 GB of log files. However, after 1 GB, the oldest files, regardless of retention period, will be deleted to make room for new logs.
For longer term retention and larger storage, consider using Azure diagnostic settings. see the Azure PostgresSQL logging documentation for more information.
4) Logical Decoding
Unnecessary PostgreSQL Logical decoding replication slots can have high impact on the server availability and storage consumption, replication slots hold on to Postgres WAL logs and relevant system catalogs until changes have been read by a consumer. in case this is failing to do so, the unconsumed logs will pile up and fill the server storage.
Therefore, it is critical that logical replication slots are consumed continuously. If a logical replication slot is no longer used, you need to drop it immediately.
You can check replication slots on server by running:
select * from pg_replication_slots;
In case the slot is no longer needed, you can simply delete it using the command:
SELECT pg_drop_replication_slot('<slot-name>');
For more information, see Azure PostgreSQL Logical Decoding.
5) Leverage PostgreSQL VACUUM and Autovacuum to reclaim the unused space.
Note:- VACUUM FULL, which can reclaim more space, but takes much longer and exclusively locks the table. Plus an extra disk space will be needed, since it writes a new copy of the table and doesn’t release the old copy until the operation is complete. |
6) Enable Storage Auto-grow and set up an alert
Last but not least, we always recommend that you enable storage auto-grow or set up an alert to notify you when your server storage is approaching the threshold so you can avoid getting into the read-only state. For more information, see the documentation on how to set up an alert.

Note:- Keep in mind that storage can only be scaled up, not down. |
I hope you find this article helpful. If you have any feedback, please do not hesitate to provide it in the comment section below.
Ahmed S. Mazrouh

by Contributed | Dec 31, 2021 | Technology
This article is contributed. See the original author and article here.
Upgrading Radial Gauge from UWP to WinUI 3
Diederik Krols lives in Antwerp, Belgium. He is a principal consultant at U2U Consult where he leads, designs and develops C# and XAML apps for the enterprise and the store. He’s a Windows Development MVP since 2014. Diederik runs the XamlBrewer blog on WordPress and the XamlBrewer repositories on GitHub. Follow him on Twitter @diederikkrols.

Maturity levels of using GitHub Actions Securely
Rob Bos is a Developer Technologies MVP and DevOps consultant from The Netherlands. Rob is typically working with anything DevOps related to improve flow. As a Global DevOps Bootcamp team member, he loves to automate large setups for the yearly event and uses any tool to get things done. For more on Rob, check out his Twitter @robbos81

Surfaces of the Future Past
Hal Hostetler is an Office Apps and Services MVP who has been in the MVP program since 1996. Now retired, Hal is a Certified Professional Broadcast Engineer and remains the regional engineer for Daystar Broadcasting and a senior consultant for Roland, Schorr, & Tower. He lives in Tucson, Arizona. For more on Hal, check out his Twitter @TVWizard

AZURE FILE SYNC V14.1
Silvio Di Benedetto is founder and CEO at Inside Technologies. He is a Digital Transformation helper, and Microsoft MVP for Cloud Datacenter Management. Silvio is a speaker and author, and collaborates side-by-side with some of the most important IT companies including Microsoft, Veeam, Parallels, and 5nine to provide technical sessions. Follow him on Twitter @s_net.

Weekly Update December 2021 – New UI libraries for ACS, To Do Tasks API, New SEFAUtil PowerShell, Bye Bye Command Line
Tom Morgan is a Microsoft Teams Platform developer and Microsoft MVP with more than 10 years of experience in the software development industry. For the last 8 years, Tom has worked at Modality Systems, with responsibility for delivery of the Modality Systems product portfolio. Tom is passionate about creating great software that people will find useful. He enjoys blogging and speaking about Microsoft Teams development, Office365, Bot Framework, Cognitive Services and AI, and the future of the communications industry. He blogs at thoughtstuff.co.uk and tweets at @tomorgan.
by Contributed | Dec 30, 2021 | Technology
This article is contributed. See the original author and article here.
As we approach the new year, we often find ourselves reflecting on what we accomplished in the year that is coming to a close. Global pandemic aside, 2021 was a busy year for Azure Databricks. The platform expanded into new core use-cases while also providing additional capabilities and features to support mature and proven use-cases and patterns. Below you’ll find some of the highlights from 2021.
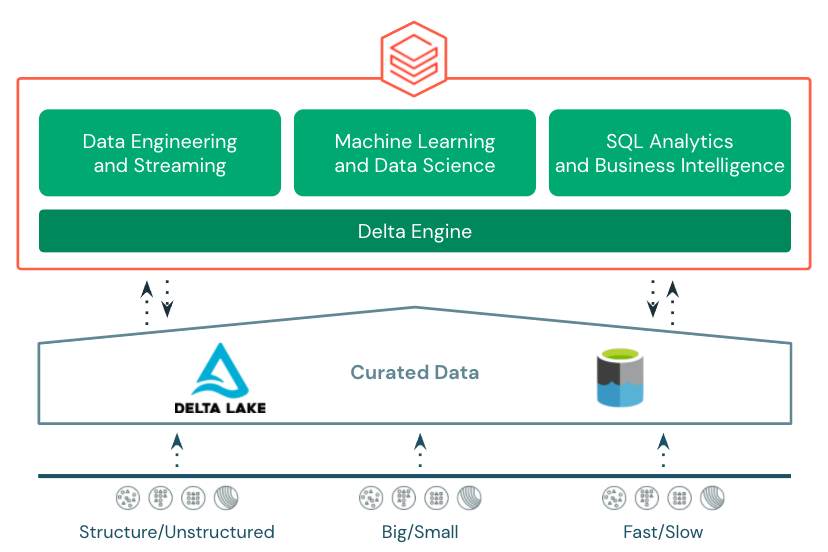
Lakehouse Platform
In 2021, the Lakehouse architecture really picked up steam. Early in the year, Lakehouse was mentioned in Gartner’s Hype Cycle for Data Management validating it as an architecture pattern being evaluated and leveraged across many different organizations and leading to many data and analytics companies and services adopting and providing guidance around the pattern.
The Azure Databricks Lakehouse Platform provides end-to-end, best in class support for data engineering, stream processing, data science and machine learning, and SQL and business intelligence all on top of transactional, open storage in Azure Data Lake Store.
The foundation for the Azure Databricks Lakehouse is Delta Lake. Delta Lake is an open storage format that brings reliability to curated data in the data lake with acid transactions, data versioning, time-travel, etc. 2021 saw a slew of new features introduced to Delta Lake and Azure Databricks’s integration with Delta Lake including:
Photon
Also in 2021, Photon was made available in Azure Databricks. Photon is the native vectorized query engine on Azure Databricks, written to be directly compatible with Apache Spark APIs so it works with your existing code.

It’s also the same engine that was used to set an official data warehousing performance record. Photon is the default engine for Databricks SQL and is also available as a runtime option on clusters in Azure Databricks. Try it out to see how it improves performance on your existing workloads.
New User Experiences
2021 also brought new user experiences to Azure Databricks. Previously, data engineers, data scientists, and data analysts all shared the same notebook-based experience in the Azure Databricks workspace. In 2021, two new experiences were added.

Databricks Machine Learning was added to cater more to the needs of data scientists and ML engineers with easy access to notebooks, experiments, the feature store, and the MLflow model registry. Databricks SQL was added to cater more to the needs of business analysts, SQL analysts, and database admins with a familiar SQL-editor interface, query catalog, dashboards, access to query history, and other admin tools. An important characteristic of the three distinct user experiences is that all of them share a common metastore with database, table, and view definitions, consistent data security, and consistent programming languages and APIs to Delta Engine.
Databricks SQL
One of the biggest additions to Azure Databricks in 2021 was Databricks SQL. Databricks SQL was announced earlier in the year during the Data and AI Summit and went GA in Azure Databricks in December.

Databricks SQL provides SQL users and analysts with a familiar user experience and best-in-class performance for querying data stored in Azure Data Lake Store. Users can query tables and views in the SQL editor, build basic visualizations, bring those visualizations together in dashboards, schedule their queries and dashboards to refresh, and even create alerts based on query results.

Databricks SQL also provides SQL and database admins with the tools and controls necessary to manage the environment and keep it secure. Administrators can monitor SQL endpoint usage, review query history, look at query plans, and control data access down to row and column level with familiar GRANT/DENY ACLs.

Along with Databricks SQL came stronger and easier integration with Power BI. Over the course of 2021, the Power BI connector for Azure Databricks went GA and got several major performance improvements including Cloud Fetch for faster retrieval of larger datasets into Power BI. With the inclusion of Power BI in the Azure Databricks Partner Connect portal, users can now connect their Databricks SQL endpoint to Power BI with just a few clicks.
Data Engineering
2021 also saw several new features and enhancements to help make data engineers more efficient.

One of those is Delta Live Tables. Delta Live Tables provides a framework for building data processing pipelines. Users define transformations and data quality rules, and Delta Live Tables manages task orchestration, dependencies, monitoring, and error handling. Transformations and data quality rules can be defined using basic declarative SQL statements. Delta Live Tables can also be combined with the Databricks Auto Loader to provide simple, consistent incremental processing of incoming data. The Auto Loader also saw several enhancements including:

Another new capability that was added in 2021 is multi-task job orchestration. Prior to this capability, Databricks jobs could only reference one code artifact (i.e a notebook) per job. This meant that an external jobs orchestration tool was needed to string together multiple notebooks and manage dependencies. Multi-task job orchestration allows multiple notebooks and dependencies to be orchestrated and managed all from a single job. It also enables some additional future capabilities like the ability to reuse a jobs cluster across multiple tasks and even calculate a single DAG across tasks.
Databricks Machine Learning
Finally, 2021 brought some notable new features to an already industry leading data science and machine learning platform in Azure Databricks.

One of those features, announced during the Data and AI Summit, is Databricks AutoML. Databricks AutoML takes an open, glass-box approach to apply machine learning to a selected dataset. It includes prepping the dataset, training models, recording the hyperparameters, metrics, models, etc. using MLflow experiments, and even a Python notebook with the source code for each trial run (including feature importance!). This allows data scientists to easily build on top of the models and code generated by Databricks AutoML. Databricks AutoML automatically distributes trial runs across a selected cluster so that trials run in parallel.

Another feature introduced to Databricks Machine Learning in Azure Databricks was the Databricks Feature Store. The Databricks Feature Store is built on top of Delta Lake and is stored in Azure storage giving it all the benefits of Delta Lake like an open format, built in versioning, time-travel, and built in lineage. When used in an MLflow model, the Databricks Feature Store injects the feature information and feature lookup code right into the MLflow model artifact. This takes the burden off of the data scientist and MLOps engineer. The Databricks Feature Store even includes a sync for online storage like Azure MySQL for low latency feature lookups for real time inference.
Both the Databricks AutoML and Databricks Feature Store are available in the Databricks Machine Learning experience in the Azure Databricks Workspace.
More to Come in 2022
While 2021 was a busy year for Azure Databricks, there’s already some highly anticipated features and capabilities expected in 2022. Those include:
- The Databricks Unity Catalog will make it easier to manage and discover databases, tables, security, lineage, and other artifacts across multiple Azure Databricks workspaces
- Managed Delta Sharing will allow for secure sharing of Delta Lake datasets stored in Azure Data Lake Store to internal consumers and external consumers all with an open, vendor/tool agnostic standard (already available in Power BI!)
- Databricks Serverless SQL will allow for nearly-instant SQL compute startup with minimal management likely resulting in lower costs for BI and SQL workloads
- New low-code/no-code capabilities will enable and empower both data scientists and citizen data scientists to explore, visualize, and even prepare data with just a few clicks.
Get Started
Ready to dive in and get hands on with these new features? Register for a free trial, attend this 3-part training series, and join an Azure Databricks Quickstart Lab where you can get your questions answered by Databricks and Microsoft experts.
by Contributed | Dec 29, 2021 | Technology
This article is contributed. See the original author and article here.
Azure Data explorer team is constantly focused on reducing COGS and making sure users are paying only for value they are getting.
As part of this initiative, we’re now adding a new automatic capability to stop unused clusters.
In case, you created a cluster and did not ingest any data to it or even if you ingested data and later, you’re not running any queries or ingesting new data for days, we will automatically stop that cluster.
Stopping the cluster reduces cost significantly as it releases the compute resources which are the bulk of the overall cluster cost.
Once a cluster is stopped you will need to actively start it when you need it again. It will not start automatically when a new query is sent or ingest operation performed.
When a cluster is stopped it does not lose any of the already ingested data, since the storage resources are not released. This means, that once you start the cluster it will be ready for use in minutes with all databases, tables and functions fully operational.
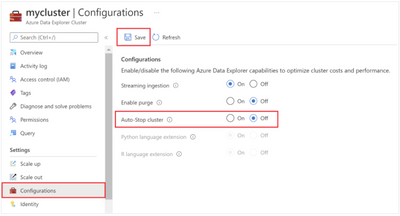
It is possible to manage cluster auto-stop either using SDKs or using the Azure Portal. For more details on automatic stop of inactive Azure Data Explorer clusters, read this – https://docs.microsoft.com/en-us/azure/data-explorer/auto-stop-clusters
This new feature is another piece in the cost reduction effort the Azure Data Explorer team is making.
You’re welcome to add more proposals and ideas and vote for them here – https://aka.ms/adx.ideas
ADX dashboards team


 7.8.png")
 7.9.png")
 8.5.png")


Recent Comments