by Contributed | Jun 10, 2021 | Technology
This article is contributed. See the original author and article here.
Yes, yes, yes, SharePointDsc v4.7 has just hit the PowerShell Gallery! This release introduces two new resource (SPService and SPUsageDefinition) and fixes a bunch of issues. It also contains a small change to the way we create the lock table in the TempDB. We recently discovered an issue where lack of permissions in SQL prevented a successful installation.
You can find the SharePointDsc v4.7 in the PowerShell Gallery!
NOTE: We can always use additional help in making SharePointDsc even better. So if you are interested in contributing to SharePointDsc, check-out the open issues in the issue list, check-out this post in our Wiki or leave a comment on this blog post.
Improvement/Fixes in v4.7:
Added
- SPSearchServiceApp
- Added ability to correct database permissions for the farm account, to prevent issue as described in the Readme of the resource
- SPSecurityTokenServiceConfig
- Added support for LogonTokenCacheExpirationWindow, WindowsTokenLifetime and FormsTokenLifetime settings
- SPService
- SPUsageDefinition
- SPUserProfileProperty
- Added check for unique ConnectionNames in PropertyMappings, which is required by SharePoint
- SPWebAppAuthentication
- Added ability to configure generic authentication settings per zone, like allow anonymous authentication or a custom signin page
Fixed
- SharePointDsc
- Fixed code coverage in pipeline
- SPConfigWizard
- Fixed issue with executing PSCONFIG remotely.
- SPFarm
- Fixed issue where developer dashboard could not be configured on first farm setup.
- Fixed issue with PSConfig in SharePoint 2019 when executed remotely
- Corrected issue where the setup account didn’t have permissions to create the Lock table in the TempDB. Updated to use a global temporary table, which users are always allowed to create
A huge thanks to the following guys for contributing to this project:
Thomas Lieftüchter, Johan Ljunggren, Jens Otto Hatlevold and Paul Woudwijk
Also a huge thanks to everybody who submitted issues and all that support this project. It wasn’t possible without all of your help!
For more information about how to install SharePointDsc, check our Readme.md.
Let us know in the comments what you think of this release! If you find any issues, please submit them in the issue list on GitHub.
Happy SharePointing!!

by Grace Finlay | Jun 10, 2021 | Marketing
In online marketing and lead generation strategies, one of the best techniques that can help generate new leads is Search Engine Optimization or SEO for short. There are many advantages to using this kind of technique to create traffic. Below are some of these advantages:
First, by optimizing your website and other social media sites like Facebook, you will increase your page rank on Google’s search engine. This way, people who type in the keyword you target in the search engine’s search bar will find you and see your website, which is better than your competition’s. This also means that you will have a greater chance of getting people to sign-up or buy your products/services from you. By having a high page rank, you will have more chances of getting traffic through organic search results. Therefore, this would result in more possible customers and clients.
Second, content marketing is one of the best lead generation tactics by most online marketers because it does not require too much investment in advertising. All you need to do is post your articles on article directories, blogs, etc., to publish your content on the internet. By doing this, you will be creating more opportunities to get readers to your website. By having a higher number of readers, you will have a higher chance of gaining new leads
Third, you can use the power of email marketing to make sure that you have plenty of leads. Email marketing allows you to capture names and email addresses of potential leads through offers such as free ebooks, reports, etc. You can even make sure that your subscriber list is updated. One of the best ways to do this is to submit your articles to newsletters. If your subscribers have good subscriptions, then you can be assured that they will look for your products or services on the internet.
Fourth, you can use the power of social media to your advantage. Social media allows you to network with people from all walks of life. Some of these people are your competitors, so you have to ensure that you always stay on their toes. Staying consistent on social media is so important. Posting 2-3 times a week is recommended.
Fifth, you can leverage the power of social media by taking advantage of Facebook, Instagram, LinkedIn, and Twitter. You can create accounts on these social media platforms and start sharing articles and information with your potential clients. You can also post links that will lead your leads to your landing page, where they can sign up to your mailing list. In this way, you can generate leads by simply posting updates on your blog.
In a nutshell, if you want to be successful in your online business endeavor, you have to make sure that you are using the best lead-gen tactics so that you will be able to generate new leads for your company or brand. With social media, you will never go wrong.
by Contributed | Jun 10, 2021 | Technology
This article is contributed. See the original author and article here.
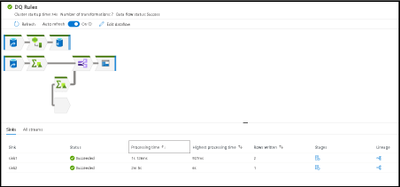
Azure Data Factory and Azure Synapse Analytics have a new update for the monitoring UI to make it easier to view your data flow ETL job executions and quickly identify areas for performance tuning.
Large data flows are now much easier to visualize and traverse inside the monitoring view in ADF and Synapse. The visual indicators of data flow streams from source to sink is now easily viewable by selecting the related sink in either the graph or the details pane at the bottom.

To switch back into large icon mode with visible labels, increase your zoom in ratio with the right-hand zoom slider:

Note that every data point collected from your data flow ETL job execution can be sorted in that results table. This feature makes it easy to find transformations that had partitioning issues via skew or kurtosis as well as quickly identifying which stages of your transformation had the longest execution times by sorting processing time. Sort by rows written to find which stages wrote the most data.
At any zoom level, you can always search for your transformations using the search icon and search bar:

Detailed rows and lineage analysis of each stage of your transformations is available from the Stages and Lineage links on the “Sinks” detail pane.


Selecting a transformation icon from the graph will present details about partitions and timings:

We’ve also added more details in the sink transformation monitoring. When you select the sink transformation in your monitoring graph, you can view properties that now include pre-processing and post-processing times for SQL sinks as well as the temp table name utilized during staging and the time taken for each SQL operation. This will provide more details around the amount of time each data flow ETL job takes to complete.

by Contributed | Jun 10, 2021 | Technology
This article is contributed. See the original author and article here.
Hear Microsoft leaders present the latest announcements about Azure Arc–enabled data services as well as news about other Azure Arc and Azure Stack HCI offerings. Also, watch engineering demos on how to organize and govern environments and use native Azure services—like data services—to run them outside of Azure datacenters. And, listen to customers discuss how they’re using Azure to achieve their goals and turn their hybrid strategies into reality.
Register for the free, two-hour Azure Hybrid and Multicloud Digital Event on June 29 from 9:00 AM–11:00 AM Pacific Time and learn how to be more productive and agile by extending Azure management and running Azure data services across your on-premises, multicloud, and edge environments. The event kicks off with a short keynote followed by these deep dives into key topics and real companies’ experiences:
- Be among the first to hear a major Azure Arc announcement. Learn how to bring cloud capabilities to your data workloads across hybrid and multicloud environments.
- Intel and Microsoft: Partnering to deliver scalable, secure, and flexible hybrid infrastructure to customers.
- Run Azure data services anywhere with the latest developments in Azure Arc–enabled data services. See how SKF Group and Dell Technologies are getting the most out of the latest generation of hybrid data offerings.
- Quickly build, deploy, and update apps anywhere with Azure Arc. Learn how to ensure governance, compliance, and security for all deployments.
- Get consistent operations and security for hybrid and multicloud environments—and learn to automate systems to meet security, governance, and compliance standards.
- Modernize your datacenter and use Azure Stack HCI hybrid capabilities to help improve availability and performance across environments.
You’ll also have the chance to get answers to your hybrid questions from product experts during the live chat and from Microsoft leaders during the live Q&A panel.
Join us to hear more about these benefits, engage with Microsoft leaders and product experts, and explore solutions from the cloud built for hybrid. We hope to see you there!
Azure Hybrid and Multicloud Digital Event
Tuesday, June 29, 2021
9:00 AM–11:00 AM Pacific Time (UTC-7)
Delivered in partnership with Intel.
REGISTER NOW >
by Contributed | Jun 10, 2021 | Technology
This article is contributed. See the original author and article here.
The Workplace Analytics team is excited to announce our feature updates for June 2021. (You can see past blog articles here). This month’s update describes the following features:
• Expanded support for plans
• Updated wpa R package
• Organizational Network Analysis (ONA) updates
• Organization data uploads for licensed employees
• Expanded support for mailboxes in datacenters globally
Expanded support for plans
In response to customer feedback, the Workplace Analytics team has made it possible for users with the Insights by MyAnalytics (basic) service plan to enroll in Workplace Analytics plans.
Previously, the Workplace Analytics plan enrollment page displayed an error when an analyst or PM tried to enroll a user who did not have the MyAnalytics (Full) service plan (made available through the E5 plan). Now, employees can have either MyAnalytics service plan, but note that users must still be assigned valid Workplace Analytics licenses. (See Prerequisites for plans for the updated requirements for enrolling users in Workplace Analytics plans.)
Updated wpa R package is released
We are pleased to announce two release updates to the wpa R library. We have (1) gone live with our release on CRAN, which enables a faster and easier installation process for users, and we have (2) released our first Microsoft Learn module on analysing Workplace Analytics with the wpa R library.
The wpa R package CRAN release
In April 2021, the wpa R library was accepted to CRAN (Comprehensive R Archive Network), which is the official repository for peer-reviewed R packages. Here is our official entry on CRAN:
CRAN – Package wpa (r-project.org)
For users of the package, this means that it will be easier to install or update the package. Instead of installing through GitHub, you can install wpa like most other R packages, with install.packages(“wpa”). If you’ve had issues installing from GitHub, this release should resolve them.
Being available on CRAN also means that the wpa package has been reviewed and accepted as an R package of publication quality, as the package must pass a series of stringent checks and tests before it can be published on CRAN.
Your usage of the package will not be affected by this release, as the CRAN version is always a stable version of the package that’s available on GitHub. We highly recommend updating your local version by following these update instructions. Details of our version release history can be found on the package website.
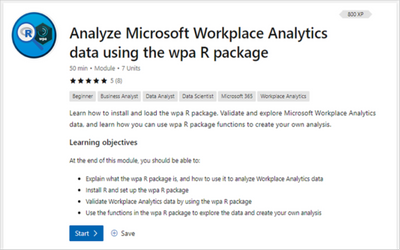
A new Microsoft Learn module
We are also offering a new Microsoft Learn module for the wpa R library:
Analyze Microsoft Workplace Analytics data using the wpa R package – Learn | Microsoft Docs
This module is designed for those who have little or no experience with the wpa R package and want to learn how to use it to extend the capabilities of Workplace Analytics. The module provides a step-by-step walkthrough on:
- what the wpa R package is and how it can be useful when analyzing Workplace Analytics data
- how to install R and set up the wpa R package
- how to validate and explore Workplace Analytics data with the wpa R package
- how to use the functions in the wpa R package to create your own analysis
Like all Learn modules, this one is free, interactive, and available to everyone; that is, you do not need a Workplace Analytics role to use it.
Microsoft Learn
Microsoft Learn is a hands-on training platform that helps people develop in-demand technical skills. To see a full list of Workplace Analytics Learn modules, including the wpa R package module, go to aka.ms/learn OR docs.microsoft.com/learn and search for “Workplace Analytics”. If you took and enjoyed the module, please leave it a rating so we can keep developing more useful, engaging content on how to get more out of Workplace Analytics.
Organizational Network Analysis (ONA) updates
To help customers more easily measure team and manager connectivity, we have released a set of ONA updates. These updates include new visual insights for leaders, query updates that make it easier to consume ONA metrics, and metric enhancements. Now, leaders can more easily get answers to questions like, “Are my teams cohesive?” and “Are managers well-connected across the company for better cross-group engagements?”
This release includes these metric enhancements:
- All ONA metrics are now accessible through one query interface to make it easy to consume in assets such as the Power BI templates.
- More targeted analyses such as evaluating local influencers are now possible.
- Metric enhancements such as Influence rank are now available.
The new visual insights show up in both the Viva insights Teams app as well as in the Workplace Analytics Web app under the Home menu:


All ONA metrics now appear under one query in the Network: Person query, which enables easy use in assets such as Power BI templates:

All ONA metrics can also be analyzed for a specific population or type of collaboration, which lets customers perform more targeted influencer or connectivity analyses. This function is available in Workplace Analytics in the Network: Person and Network: Person-to-person queries:

Finally, additional metric enhancements such as Influence rank and overlapping and unique ties for managers are available in Workplace Analytics in the Network: Person query:

For more information, see the product documentation: Workplace Analytics insights, ONA person queries, ONA person-to-person queries, ONA metrics
Organization data uploads for licensed employees
The Workplace Analytics team has added notifications to alert Workplace Analytics admins of missing data and a straightforward means to upload that data.
Admins upload organizational data when setting up the product and afterward, as needed, to maintain that data. Part of this task is to upload HR data for all licensed employees in the organization.
If Workplace Analytics detects that data is missing for one or more licensed employees, it alerts admins with a bell-icon notification and with a banner on the Upload > Organizational data page. Admins can then download a .csv file that contains the names of the employees whose data is missing, after which they can append the missing data and upload the file to Workplace Analytics. For complete information about this new capability, see Include all licensed employees.
Expanded support for mailboxes in datacenters globally
Microsoft now offers full Workplace Analytics functionality for organizations whose mailboxes are in all Microsoft 365 datacenter geo locations. (See Environment requirements for more information about Workplace Analytics availability and licensing.) Previously, analysts in organizations in various regions worldwide could not conduct employee analyses through Workplace Analytics. Now, those analyses are possible.

Recent Comments