by Contributed | May 5, 2021 | Technology
This article is contributed. See the original author and article here.
Last year we released the Reply-all Storm Protection feature to help protect your organization from unwanted reply-all storms. This feature uses global settings applicable to all Microsoft 365 customers for reply-all storm detection and for how long the feature will block subsequent reply-alls once a storm has been detected. Today we’re pleased to announce you’ll now have the ability to make these settings specific to your Microsoft 365 organization; email admins will have the flexibility to enable/disable the feature, and set customized detection thresholds and block duration time. This not only makes it more flexible to tailor for your organization, but it also allows more Microsoft 365 customers to take advantage of the Reply-all Storm Protection feature since the minimum number of reply-all recipients for detection can now be as low as 1000 when previously it was hard-coded at 5000.
The current Reply-all Storm Protection settings for Microsoft 365 are as follows:
Setting
|
Default
|
Enabled/disabled
|
Enabled
|
Minimum number of recipients
|
5000
|
Minimum number of reply-alls
|
10
|
Detection time sliding window
|
60 minutes
|
Block duration (once detected)
|
4 hours
|
Based on our telemetry and customer feedback we’re also taking this opportunity to update a few of the default settings. Once this change has rolled out, the default settings for each Microsoft 365 organization will be the following:
Setting
|
Default
|
Enabled/disabled
|
Enabled
|
Minimum number of recipients
|
2500 (previously 5000)
|
Minimum number of reply-alls
|
10
|
Detection time sliding window
|
60 minutes
|
Block duration (once detected)
|
6 hours (previously 4 hours)
|
The customizations possible for each setting will be as follows:
Setting
|
Customizable options
|
Enabled/disabled
|
Enabled or Disabled
|
Minimum number of recipients
|
1000 to 5000
|
Minimum number of reply-alls
|
5 to 20
|
Detection time sliding window
|
60 minutes (not customizable)
|
Block duration (once detected)
|
1 to 12 hours
|
Admins will be able to use the Set-TransportConfig Remote PowerShell cmdlet to update the settings for their organization:
Setting
|
Cmdlet
|
Enabled/disabled
|
Set-TransportConfig -ReplyAllStormProtectionEnabled [$True:$False]
|
Number of recipients threshold
|
Set-TransportConfig -ReplyAllStormDetectionMinimumRecipients [1000 – 5000]
|
Number of reply-alls threshold
|
Set-TransportConfig -ReplyAllStormDetectionMinimumReplies [5 – 20]
|
Block duration
|
Set-TransportConfig -ReplyAllStormBlockDuration [1 – 12]
|
These updates are rolling out now and should be fully available to all Microsoft 365 customers by mid-June. While this should come as a welcome update for customers wanting to better take advantage of the Reply-all Storm Protection feature, we are not done yet! In future updates we plan to provide an insight, report, and optional notifications for the feature as well. And if there’s enough customer feedback for it, we’ll consider also exposing the ability to customize these settings in the Exchange Admin Center. Let us know what you think!
The Exchange Transport Team
by Contributed | May 5, 2021 | Technology
This article is contributed. See the original author and article here.
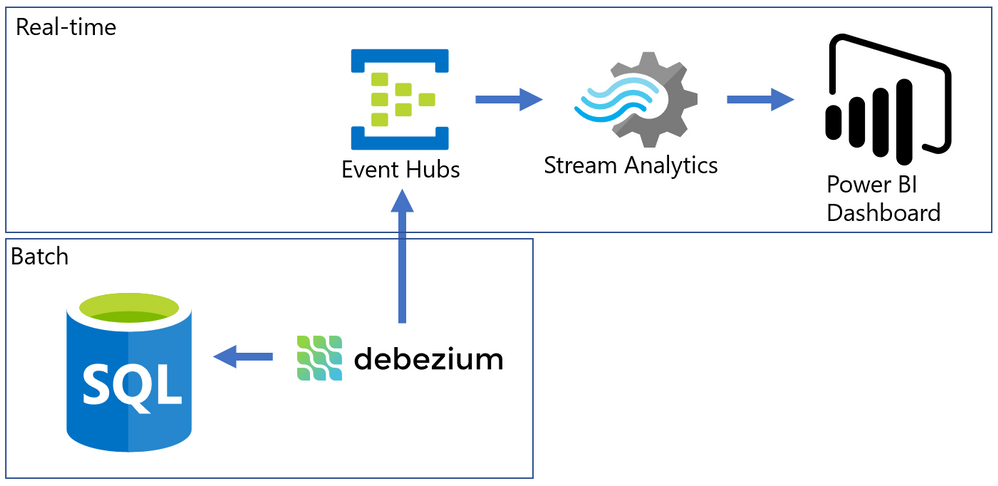
Almost every modern data warehouse project touches the topic of real-time data analytics. In many cases, the source systems use a traditional database, just like SQL Server, and they do not support event-based interfaces.
Common solutions for this problem often require a lot of coding, but I will present an alternative that can integrate the data form SQL Server Change Data Capture to a Power BI Streaming dataset with a good help of an Open-Source tool named Debezium.
The Problem
SQL Server is a batch-oriented service, just like any DBMS. This means that one program must query it in order to get the result – so to have real time analytics we would have to change this batch behavior to a streaming /event/push behavior.
On the other side, we have Azure Event Hubs, Stream Analytics and Streaming datasets on Power BI. They work pretty well together if the data source is a stream producing events (something we can have with a custom code application or some Open Source solution like Kafka).
The challenge here was to find something to make the bridge between SQL Server and Event Hubs.
After some time looking for solutions, I found this Docs page (Integrate Apache Kafka Connect on Azure Event Hubs with Debezium for Change Data Capture – Azure Event Hubs | Microsoft Docs) with an approach to bring CDC data from Postgres to Event Hubs.
The solution presented on Docs was more complex than I needed, so I simplified it by using a container deployment and by removing unnecessary dependencies, then I wrote this post where I hope I can present it is a simpler way.
The solution looks like this: On one side, we have SQL Server with CDC enabled in a few tables, on the other we have Azure ready to process events that came to Event Hub. To make the bridge, we have Debezium that will create one event per row found on the CDC tables.
Have you ever used Docker?
For my development environment, I decided to go for Docker Desktop. The new WSL2 backend makes it easy to run Linux containers (such as those needed by Debezium). It works well on Windows 10 and on recent builds of Windows Server (Semi-Annual Channel). If you still never tried WSL2, I highly recommend it. (See: Install Docker Desktop on Windows | Docker Documentation)
After a few steps, I have installed the WSL2 feature, chose the Ubuntu 20.04 distro (there other distros available on Windows Store) and finished the setup of Docker Desktop on my Windows 10 Surface Laptop :smiling_face_with_smiling_eyes:.
Spoiler (Highlight to read)
Docker Desktop works well for your development enviorement. For production, if your company don’t have a container orchestration environment, you can try
Azure Kubernetes Service (AKS) | Microsoft Azure.
Docker Desktop works well for your development enviorement. For production, if your company don’t have a container orchestration environment, you can try Azure Kubernetes Service (AKS) | Microsoft Azure.
How to install a Debezium container?
Debezium has a Docker Image available on hub.docker.com, named “debeziumserver”.
Debezium Server is a lightweight version that do NOT have Kafka installed. The image has already the connector you need for SQL Server and can output the events directly to Event Hubs.
To install and configure the container, I ran only this single line on PowerShell.
docker run -d -it --name SampleDebezium -v $PWD/conf:/debezium/conf -v $PWD/data:/debezium/data debezium/server
This will download the docker image “debezium/server” and start a container named “SampleDebezium”
We are mounting 2 folders from the host machine to the container:
/conf – Holds the configuration file.
/data – Will store the status of Debezium. This avoids missing or duplicate data once the container is recreated or restarted.
On my lab, I used the configuration file bellow (place it on the /conf folder named as application.properties). (Don’t worry about the keys here, I changed them already)
You will have to change the SQL Server and Event Hubs connections to match to match your enviorement.
Sample application.properties file:
debezium.sink.type=eventhubs
debezium.sink.eventhubs.connectionstring=Endpoint=sb://er-testforthisblogpost.servicebus.windows.net/;SharedAccessKeyName=TestPolicy;SharedAccessKey=O*&HBi8gbBO7NHn7N&In7ih/KgONHN=
debezium.sink.eventhubs.hubname=hubtestcdc
debezium.sink.eventhubs.maxbatchsize=1048576

debezium.source.connector.class=io.debezium.connector.sqlserver.SqlServerConnector
debezium.source.offset.storage.file.filename=data/offsets.dat
debezium.source.offset.flush.interval.ms=0
debezium.source.database.hostname=sqlserverhostname.westeurope.cloudapp.azure.com
debezium.source.database.port=1433
debezium.source.database.user=UserDemoCDC
debezium.source.database.password=demo@123
debezium.source.database.dbname=TestCDC
debezium.source.database.server.name=SQL2019
debezium.source.table.include.list=dbo.SampleCDC

debezium.source.snapshot.mode=schema_only
debezium.source.max.queue.size=8192
debezium.source.max.batch.size=2048
debezium.source.snapshot.fetch.size=2000
debezium.source.query.fetch.size=1000

debezium.source.poll.interval.ms=1000

debezium.source.database.history=io.debezium.relational.history.FileDatabaseHistory
debezium.source.database.history.file.filename=data/FileDatabaseHistory.dat
Setting up the Change Data Capture
My SQL Server is hosted on Azure (but this is not a requirement) and to create a lab enviorement, I created a single table and enabled CDC on it by using this script:
-- Create sample database
CREATE DATABASE TestCDC
GO
USE TestCDC
GO


-- Enable the database for CDC
EXEC sys.sp_cdc_enable_db
GO

-- Create a sample table
CREATE TABLE SampleCDC (
ID int identity (1,1) PRIMARY KEY ,
SampleName nvarchar(255)
)

-- Role with privileges to read CDC data
CREATE ROLE CDC_Reader

-- =========
-- Enable a Table
-- =========
EXEC sys.sp_cdc_enable_table
@source_schema = N'dbo',
@source_name   = N'SampleCDC',
@role_name     = N'CDC_Reader',     -- The user must be part of this role to access the CDC data
--@filegroup_name = N'MyDB_CT',     -- A filegroup can be specified to store the CDC data
@supports_net_changes = 0           -- Debezium do not use net changes, so it is not relevant

-- List the tables with CDC enabled
EXEC sys.sp_cdc_help_change_data_capture
GO

-- Insert some sample data
INSERT INTO dbo.SampleCDC VALUES ('Insert you value here')

-- The table is empty
select * from SampleCDC

-- But it recorded CDC data
select * from [cdc].[dbo_SampleCDC_CT]


/*
-- Disable CDC on the table
--EXEC sys.sp_cdc_disable_table
--@source_schema = N'dbo',
--@source_name   = N'SampleCDC',
--@capture_instance = N'dbo_SampleCDC'
*/
Debezium will query the latest changed rows on CDC based on its configuration file and create the events on Event Hub.
Event Hub and Stream Analytics
I created a Event Hub Namespace with a single Event Hub to hold this experiment. There is no special requirement for the event hub. The size will depend only on the volume of events your application will send to it.
Once it is done, we have to create a Shared Access Policy. The connection string is what you need to add to the Debezium application.properties file.

To consume the events and create the Power BI streaming dataset, I used Azure Stream Analytics.
Once the Stream Analytics job is created, we have to configure 3 things: Inputs, Outputs and Query.
Inputs
Here is where you say what the stream analytics will listen to. Just create a Inputs for your Event Hub with the default options. Debezium will generate uncompressed JSON files encoded on UTF-8.

Outputs
Here is where we will configure the Power BI streaming dataset. But you first need to know on which Power BI Workspace it will stay.
On the left menu, click on Outputs and then Add -> Power BI.
The options “Dataset name” and “Table name” are what will be visible to Power BI.

The a test, the “Authentication mode” as “User Token” is a good one, but for production, better use “Managed Identity”
Query
Stream used a query language very similar to T-SQL to handle the data that comes in a stream input.
Check this link to find more about it Stream Analytics Query Language Reference – Stream Analytics Query | Microsoft Docs
On the example, I’m just counting row many rows (events) were generated on the last 10 minutes FROM an input INTO an output. The names on the query must match the ones you defined on prior steps.

Here it is in the text version:
SELECT
    count(*) over( LIMIT DURATION (minute, 10)) as RowsLast10Minutes
INTO
    [TestCDC]
FROM
    [InputCDC]
Make it Run
If everything is correctly configured, we will be able to start our Stream Analytics and our Container.
Stream Analytics:

Docker Desktop:

Power BI
Once the Stream Analytics is started, we will go to the Power BI workspace and create a tile based on the streaming dataset.
If you don’t have a Power BI Dashboard on your workspace, just create a new one.

On the Dashboard, add a Tile.

Click on Real-time data and Next.

The dataset with the name you chose on Stream Analytics should be visible here.

Select the Card visual and the column RowsLast10Minutes, click Next, and Apply.

It should be something like this if there is no data being inserted on the table.

Now it comes the fun time. If everything is configured correctly, we just have to insert data on our sample table and see it flowing to the dashboard!
.gif")
Known problems
It seems when a big transaction happens (like an update on 200k rows), Debezium stops pointing that the message size was bigger than the maximum size defined from Event Hubs. Maybe there is a way to break it on smaller messages, maybe it is how it works by design. If the base (CDC) table are OLTP oriented (small, single row operations), the solutions seem to run fine.
References
Enable and Disable Change Data Capture (SQL Server)
Debezium Server Architecture
Docker image with example
SQL Server connector
Azure Event hubs connection

by Contributed | May 5, 2021 | Technology
This article is contributed. See the original author and article here.
Accessibility is about making our products accessible and inclusive to everyone, including the 1 billion+ people with disabilities around the world. It is a core Excel and Microsoft priority, and an area where we continuously strive to improve. For more information about Microsoft’s commitment to accessibility, visit microsoft.com/accessibility.
Excel’s approach
Making Excel more accessible is a journey, and we will always have room for improvement as we strive to make spreadsheets work for everyone. We have three overarching objectives to guide us:
- Work seamlessly with assistive technology. Our partners around the globe and within Microsoft create amazing technology to support people with disabilities. A few examples of assistive technology include screen readers, dictation software, magnifiers, and physical devices. Our priority is to collaborate with these partners so that everyone can use Excel in the way that works best for them, with tools that are already familiar.
- Build inclusive and delightful experiences inspired by people with disabilities. Beyond “just working,” Excel should be efficient and delightful to use. We are always looking for opportunities to simplify your workflow, summarize your content, or suggest information. By learning from and being inspired by the experiences of people with disabilities, we can make Excel better for all.
- Support authors to create accessible content. Making Excel as an application accessible is only half the battle; the other half is making sure workbooks created in Excel are accessible. For that, we rely heavily on you, the author…but that doesn’t mean we can’t help! We look for opportunities to automatically create accessible content on your behalf, support you while you create accessible content, let you know when something is inaccessible, and help you fix accessibility issues before sharing your workbook with others.
Feature Spotlight: Accessibility ribbon
As a part of our goal to help you create accessible content, there is a new contextual ribbon called “Accessibility” coming to Excel. The Accessibility ribbon will be available when you open the Check Accessibility pane on the Review tab. On the Accessibility ribbon you will find a collection of the most common tools you need to make your workbook accessible. The ribbon is available today to those in the Office Insiders program.
Contextual Accessibility ribbon in Excel shows when the Check Accessibility pane is open.
To learn more about the Accessibility ribbon, view our announcement on the Office Insiders blog. If you are interested in learning more about how to create accessible workbooks, check out our support article Make your Excel documents accessible to people with disabilities.
Next steps
Please let us know what you think! Your feedback and suggestions shape our approach to accessibility and inclusive design. To get in touch, contact the Disability Answer Desk or use Help > Feedback. We look forward to hearing from you!
This is the first in a series of blogs about our accessibility work in Excel. We hope you will join us over the next several months as we discuss exciting new improvements to Excel through an inclusive lens.
Subscribe to our Excel Blog and join our Excel Community to stay connected with us and other Excel fans around the world.
by Contributed | May 5, 2021 | Technology
This article is contributed. See the original author and article here.
The Azure Sentinel: Zero Trust (TIC3.0) Workbook provides an automated visualization of Zero Trust principles cross walked to the Trusted Internet Connections framework. Compliance isn’t just an annual requirement, and organizations must monitor configurations over time like a muscle. This workbook leverages the full breadth of Microsoft security offerings across Azure, Office 365, Teams, Intune, Windows Virtual Desktop, and many more. This workbook enables Implementers, SecOps Analysts, Assessors, Security & Compliance Decision Makers, and MSSPs to gain situational awareness for cloud workloads’ security posture. The workbook features 76+ control cards aligned to the TIC 3.0 security capabilities with selectable GUI buttons for navigation. This workbook is designed to augment staffing through automation, artificial intelligence, machine learning, query/alerting generation, visualizations, tailored recommendations, and respective documentation references.
Azure Sentinel: Zero Trust (TIC3.0) Workbook
Mapping technology to Zero Trust frameworks is a challenge in the federal sector. We need to change our thinking in security assessment as the cloud evolves at the speed of innovation and growth, which often challenges our security requirements. We need a method to map Zero Trust approaches to technology while measuring change over time like a muscle.
What Are the Use Cases?
There are numerous use cases for this workbook including role alignment, mappings, visualizations, time-bound measurement, and time-saving features:
Roles
- Implementers: Build/Design
- SecOps: Alert/Automation Building
- Assessors: Audit, Compliance, Assessment
- Security & Compliance Decision Makers: Situational Awareness
- MSSP: Consultants, Managed Service
Mappings
- Framework to Requirement to Microsoft Technology
Visualization
- Hundreds of Visualizations, Recommendations, Queries
Time-Bound
- Measure Posture Over Time for Maturity
Time-Saving
- Aggregation & Analysis
- Capabilities Assessment
- Navigation
- Documentation
- Compliance Mapping
- Query/Alert Generation
 Microsoft Offerings Overlay to TIC Capabilities
What is Zero Trust?
Zero Trust is a security architecture model that institutes a deny until verified approach to access resources from both inside and outside the network. This approach addresses the challenges associated with a shifting security perimeter in a cloud-centric and mobile workforce era. The core principle of Zero Trust is maintaining strict access control. This concept is critical to prevent attackers from pivoting laterally and elevating access within an environment.
At Microsoft, we define Zero Trust around universal principles.
- Verify Explicitly: Always authenticate and authorize based on all available data points, including user identity, location, device health, service or workload, data classification, and anomalies.
- Use Least Privileged Access: Limit user access with just-in-time and just-enough-access (JIT/JEA), risk-based adaptive policies, and data protection to secure both data and productivity.
- Assume Breach: Minimize blast radius for breaches and prevent lateral movement by segmenting access by the network, user, devices, and app awareness. Verify all sessions are encrypted end to end. Use analytics to get visibility, drive threat detection, and improve defenses.
These principles are technology-agnostic and aligned to six Zero Trust pillars.
 Zero Trust Defined
- Identity: Whether they represent people, services, or IoT devices—define the Zero Trust control plane. When an identity attempts to access a resource, verify that identity with strong authentication, and ensure access is compliant and typical.
- Endpoints: Once an identity accesses a resource, data can flow to different endpoints—from IoT devices to smartphones, BYOD to partner-managed devices, and on-premises workloads to cloud-hosted servers. This diversity creates a massive attack surface area. Monitor and enforce device health and compliance for secure access.
- Data: Ultimately, security teams are protecting data. Where possible, data should remain safe even if it leaves the devices, apps, infrastructure, and networks the organization controls. Classify, label, and encrypt data, and restrict access based on those attributes.
- Apps: Applications and APIs provide an interface for data consumption. They may be legacy on-premises, lifted-and-shifted to cloud workloads, or modern SaaS applications. Apply controls and technologies to discover shadow IT, ensure appropriate in-app permissions, gate access based on real-time analytics, monitor for abnormal behavior, control user actions, and validate secure configuration options.
- Infrastructure: Infrastructure—whether on-premises servers, cloud-based VMs, containers, or micro-services—represents a critical threat vector. Assess for version, configuration, and JIT access to harden defense. Use telemetry to detect attacks and anomalies, and automatically block and flag risky behavior and take protective actions.
- Network: All data transits over network infrastructure. Networking controls can provide critical controls to enhance visibility and prevent attackers from moving laterally across the network. Segment networks and deploy real-time threat protection, end-to-end encryption, monitoring, and analytics.
What is Trusted Internet Connections (TIC3.0)?
Trusted Internet Connections (TIC) is a federal cybersecurity initiative to enhance network and perimeter security across the United States federal government. The TIC initiative is a collaborative effort between the Office of Management and Budget (OMB), the Department of Homeland Security (DHS), Cybersecurity and Infrastructure Security Agency (CISA), and the General Services Administration (GSA). The TIC 3.0: Volume 3 Security Capabilities Handbook provides various security controls, applications, and best practices for risk management in federal information systems.
Is Zero Trust Equivalent to TIC 3.0?
No, Zero Trust is a best practice model and TIC 3.0 is a security initiative. Zero Trust is widely defined around core principles whereas TIC 3.0 has specific capabilities and requirements. This workbook demonstrates the overlap of Zero Trust Principles with TIC 3.0 Capabilities. The Azure Sentinel Zero Trust (TIC 3.0) Workbook demonstrates best practice guidance, but Microsoft does not guarantee nor imply compliance. All TIC requirements, validations, and controls are governed by the Cybersecurity & Infrastructure Security Agency. This workbook provides visibility and situational awareness for security capabilities delivered with Microsoft technologies in predominantly cloud-based environments. Customer experience will vary by user and some panels may require additional configurations for operation. Recommendations do not imply coverage of respective controls as they are often one of several courses of action for approaching requirements which is unique to each customer. Recommendations should be considered a starting point for planning full or partial coverage of respective requirements.
Deploying the Workbook
It is recommended that you have the log sources listed above to get the full benefit of the Zero Trust (TIC3.0) Workbook, but the workbook will deploy regardless of your available log sources. Follow the steps below to enable the workbook:
Requirements: Azure Sentinel Workspace and Security Reader rights.
1) From the Azure portal, navigate to Azure Sentinel
2) Select Workbooks > Templates
3) Search Zero Trust and select Save to add to My Workbooks
Navigating the Workbook
The Legend Panel provides a helpful reference for navigating the workbook with respective colors, features, and reference indicators.
 Workbook Navigation
The Guide Toggle is available in the top left of the workbook. This toggle allows you to view panels such as recommendations and guides, which will help you first access the workbook but can be hidden once you’ve grasped respective concepts.
 Guide Toggle
The Resource Parameter Options provide configuration options to sort control cards by Subscription, Workspace, and Time Range. The Parameter Options are beneficial for Managed Security Service Providers (MSSP) or large enterprises that leverage Azure Lighthouse for visibility into multiple workspaces. It facilitates assessment from both the aggregate and individual workspace perspectives. Time range parameters allow options for daily, monthly, quarterly, and even custom time range visibility.
 Resource Parameter Options
The Capabilities Ribbon provides a mechanism for navigating the desired security capabilities sections highlighted in the TIC3.0 framework. Selecting a capability tab will display Control Cards in the respective area. An Overview tab provides more granular detail of the overlaps between the Microsoft Zero Trust model and the TIC3.0 framework.
 Capabilities Selector
This workbook leverages automation to visualize your Zero Trust security architecture. Is Zero Trust the same as TIC 3.0? No, they’re not the same, but they share numerous common themes which provide a powerful story. The workbook offers detailed crosswalks of Microsoft’s Zero Trust model with the Trusted Internet Connections (TIC3.0) framework to better understand the overlaps.
 TIC 3.0 Overlay to Microsoft Offerings and Zero Trust Principles
The Azure Sentinel Zero Trust (TIC3.0) Workbook displays each control in a Capability Card. The Capability Card provides respective control details to understand requirements, view your data, adjust SIEM queries, export artifacts, onboard Microsoft controls, navigate configuration blades, access reference materials, and view correlated compliance frameworks.
 Capability Card
How to Use It?
There are several use cases for the Azure Sentinel Zero Trust (TIC 3.0) Workbook depending on user roles and requirements. The graphic below shows how a SecOps analyst can leverage the workbook to review requirements, explore queries, configure alerts, and implement automation. There are also several additional use cases where this workbook will be helpful:
- Security Architect: Build/design a cloud security architecture to compliance requirements.
- Managed Security Services Provider: Leverage the workbook for Zero Trust (TIC3.0) Assessments.
- SecOps Analyst: Review activity in query, configure alerts, deploy SOAR automation.
- IT Pro: Identify performance issues, investigate issues, set alerts for remediation monitoring.
- Security Engineer: Assess security controls, review alerting thresholds, adjust configurations.
- Security Manager: Review requirements, analyze reporting, evaluate capabilities, adjust accordingly.
 SecOps Analyst Use-Case
Configurations & Troubleshooting
It’s important to note that this workbook provides visibility and situational awareness for control requirements delivered with Microsoft technologies in predominantly cloud-based environments. Customer experience will vary by user, and some panels may require additional configurations and query modification for operation. It’s unlikely that all 76+ panels will populate data, but this is expected as panels without data highlight respective areas for evaluation in maturing cybersecurity capabilities. Capability Cards without data will display the custom error message below. Most issues are resolved by confirming the log source’s licensing/availability/health, ensuring the log source is connected to the Sentinel workspace, and adjusting time thresholds for larger data sets. Ultimately this workbook is customer-controlled content, so panels are configurable per customer requirements. You can edit/adjust Control Card queries as follows:
- Zero Trust (TIC3.0) Workbook > Edit > Edit Panel > Adjust Panel KQL Query > Save
 Custom Error Messaging
While using Microsoft offerings for the Zero Trust (TIC3.0) Workbook is recommended, it’s not a set requirement as customers often rely on many security providers and solutions. Below is a use-case example for adjusting a Control Card to include third-party tooling. The default KQL query provides a framework for target data, and it is readily adjusted with the desired customer controls/solutions.
 3rd Party Tool Use-Case
Get Started with Azure Sentinel and Learn More About Zero Trust with Microsoft
Below are additional resources for learning more about Zero Trust (TIC3.0) with Microsoft. Bookmark the Security blog to keep up with our expert coverage on security matters and follow us at @MSFTSecurity or visit our website for the latest news and cybersecurity updates.
Disclaimer
The Azure Sentinel Zero Trust (TIC 3.0) Workbook demonstrates best practice guidance, but Microsoft does not guarantee nor imply compliance. All TIC requirements, validations, and controls are governed by the Cybersecurity & Infrastructure Security Agency. This workbook provides visibility and situational awareness for control requirements delivered with Microsoft technologies in predominantly cloud-based environments. Customer experience will vary by user, and some panels may require additional configurations and query modification for operation. Recommendations do not imply coverage of respective controls as they are often one of several courses of action for approaching requirements which is unique to each customer. Recommendations should be considered a starting point for planning full or partial coverage of respective control requirements.
by Contributed | May 5, 2021 | Technology
This article is contributed. See the original author and article here.
This week we are announcing the preview support of Microsoft Azure SQL Edge on Red Hat Enterprise Linux (RHEL). Developers can now easily extend their existing SQL Server 2019 offerings for RHEL and Red Hat Openshift to IoT edge gateways and devices for consistent edge to cloud data management.
Azure SQL Edge is a small-footprint, edge-optimized database delivered as an Open Containers Initiative (OCI) compatible container for connected, disconnected or hybrid environments and supports the latest generation of the Podman container management tools on RHEL 8. Features include built-in data streaming and time series, with in-database machine learning and graph features for low-latency analytics as well as capabilities for machine learning at the edge to optimize bandwidth, reaction time, and cost. The availability of Azure SQL Edge on RHEL expands the existing ecosystem of tools, applications, frameworks, and libraries for building and running containers on the edge.
Because Azure SQL Edge is packaged as a container, it is easy to deploy and update on RHEL. You can pull the latest image down from an internal repository directly to your edge devices, from the official Microsoft container repository, or manage everything directly from Azure. A basic installation for an Azure SQL Edge developer edition on RHEL is as simple as running:
$ podman run –cap-add SYS_PTRACE -e ‘ACCEPT_EULA=1’ -e ‘MSSQL_SA_PASSWORD=StrongPassword’ -p 1433:1433 –name azuresqledge -d mcr.microsoft.com/azure-sql-edge
That’s it! The Azure SQL Edge database is up and running and you are ready to start developing your RHEL-based project on the edge.
It needs to be noted that in the connected deployment scenario, Azure SQL Edge is deployed as a module of Azure IoT Edge. Azure IoT Edge’s platform support documentation states RHEL as Tier 2 systems. This means RHEL is compatible with Azure IoT Edge but is not actively tested or maintained by Microsoft.
To learn more about Azure SQL Edge visit the product page or watch the latest customer evidence stories

Recent Comments