by Contributed | May 4, 2021 | Technology
This article is contributed. See the original author and article here.
Today we’re excited to announce public preview of OneDrive Sync Admin Reports in Microsoft 365 Apps admin center.
These reports give you more visibility into who in your organization is running the OneDrive Sync client and any errors they might be experiencing. OneDrive Sync is a lot like electricity or internet—people tend to take it for granted until they have a problem and they’re in the middle of an important project. This is even more the case now with so many people working from home and relying on cloud capabilities like OneDrive and SharePoint Online to help them be productive. Having insights into what’s happening with OneDrive Sync across your organization can help you proactively reach out to educate people to resolve common issues and improve user experience to help increase OneDrive adoption.
Get an at-a-glance view of OneDrive Sync across your organization
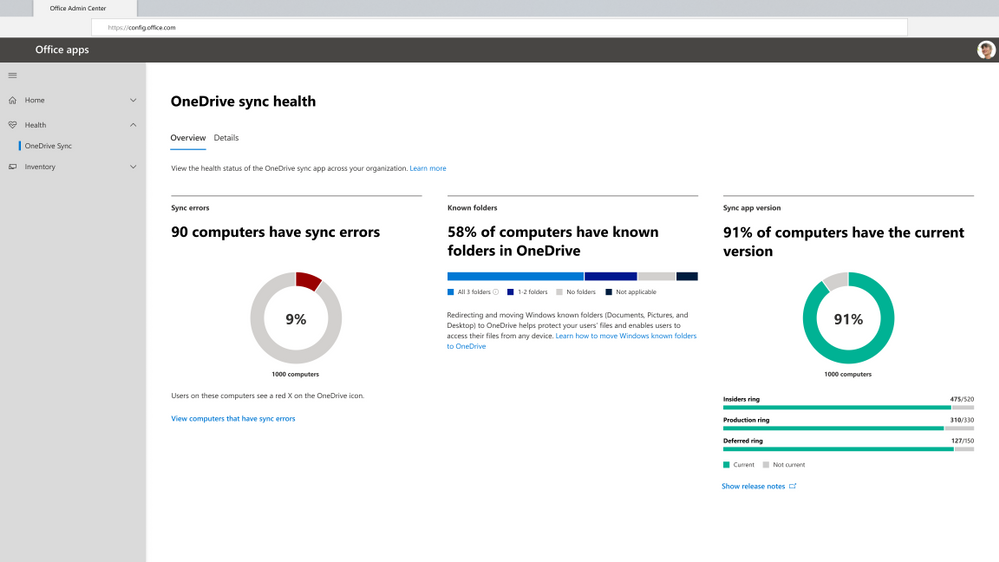
When you open the OneDrive Sync health dashboard, you’ll see an executive summary of what’s going on with OneDrive Sync in your organization. On the left, you can see how many devices have at least one sync error. In the middle, you can see at a glance what percentage of the devices in your organization have known folders OneDrive is helping to protect. You can see what percentage of devices have all three folders (Desktop, Documents, and Pictures) syncing with OneDrive, which have only one or two folders, and which have not opted in to sync those folders at all, meaning if something were to happen to those devices, all the contents of those folders would be lost. On the right, you can see how many devices are running on the current version of OneDrive, meaning they have all the latest and greatest fixes and features from Microsoft that you saw in the Release Notes.
Get an at-a-glance view of OneDrive Sync across your organization
Quickly resolve sync issues to help people stay productive.
When someone in your organization reports a problem syncing files to OneDrive, you can investigate quickly without having to ask for additional details and screenshots of the error message via Microsoft Teams chat or Outlook email. This can save valuable time for both you and the user. Having these insights into sync errors helps you react quickly to requests for help and be more proactive in driving down occurrence of the most common sync errors by providing more education for users in general or reaching out to specific users directly as needed.
In the Details view, you can see all the information for users running OneDrive Sync. To resolve help requests, you can easily look up the person’s name and get a glimpse of the problem by seeing how many sync errors they have. To see details about the error type, you can click on the user name to open the detail panel. There you can see what device they are using and what build of the OneDrive Sync client they are using. You can also see the specific errors that are occurring on their device, such as issues related to unsupported file and folder names. With that information, you can reply with details about the error and the steps to resolve the issue—no back and forth about what error the user was seeing in the first place, just quick resolution!
At a glance in the Details table, you can see other users who have high numbers of sync errors. You can click on any user’s name to see the exact errors. This is especially helpful if you’re looking for ways to drive down sync errors across the organization to help improve adoption of OneDrive. This way, you can reach out to groups of users who are experiencing similar errors to provide training materials that can help them resolve sync errors and improve the user experience. You can also filter to devices with sync errors, to focus actions on driving down those unhealthy sync clients.
 Quickly resolve sync issues to help people stay productive.
Easily track the status of Known Folder Move rollouts
If you’re rolling out Known Folder Move (KFM) for your organization to help people across the organization keep their Desktop, Documents, and Pictured folders protected by syncing them to the cloud with OneDrive, this is a great way for you to monitor progress. You can easily see what errors have occurred, how many people have opted in to protect some or all folders, and how many devices have been updated with the latest OneDrive Sync client.
Let’s say you’re deploying KFM to your team, which has around 75 people. You can check the status of your KFM deployment by clicking into the Details view, which gives you a better look at devices belonging to specific people, so you can see clearly which folders users have selected to sync.
 Easily track the status of Known Folder Move rollouts
Give remote workers confidence their information is synced securely in the cloud
With more people working from home, you also need a better way to transition users over to new devices while helping to ensure they don’t lose any data from their old devices. For example, you need to check on the sync status of someone’s older laptop before you let her know she can safely begin using her new one and send the old one back to corporate. Before you give her the green light, you want to ensure all her data was uploaded through KFM, so she will see it as soon as she logs onto her new device. When you view the user’s name in the Details pane, you can see she has opted in to sync all three folders with OneDrive, and you can also see her last sync time was recent and that all the uploads completed successfully. You can also easily see whether she has any sync errors. This means you can get back to her right away and let her know whether she can send back her old device.
 Give remote workers confidence their information is synced securely in the cloud
With these new admin reports, you can get easy access into everything that’s going on with OneDrive Sync in your organization, from what sync errors people are facing to the status of a KFM rollout or what version of the app they’re on, helping you resolve issues quickly so you can focus on other strategic tasks.
Please note that currently only Windows machines are supported.
To manage and set up OneDrive Sync admin dashboard please refer to our documentation here.
Learn more and stay engaged..
We continue to evolve OneDrive as a place to access, share, and collaborate on all your files in Office 365, keeping them protected and readily accessible on all your devices, anywhere.
You can stay up-to-date on all things via the OneDrive Blog and the OneDrive release notes.
Check out the new and updated OneDrive documentation.
Take advantage of end-user training resources on our Office support center.
Check out our episodes of Sync Up- a OneDrive podcast to learn more about OneDrive from the experts.
Thank you again for your support of OneDrive. We look forward to your continued feedback and hope to connect with you at another upcoming Microsoft or community-led event.
Thanks for your time reading all about OneDrive,
Ankita Kirti
OneDrive | Microsoft
by Contributed | May 4, 2021 | Technology
This article is contributed. See the original author and article here.
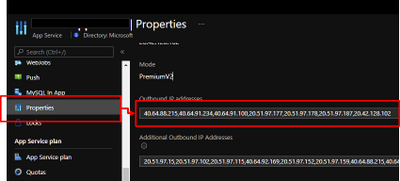
App Service are powerful features to retrieve Azure computer resources as PaaS platform. In other hands, PaaS is shared services for multi-tenant, so it might be caused as issues to collaborate with legacy applications. As one of such issues, external services sometimes require to fixed IP addresses from your applications. It was not allowed to fix outbound IPs for App Services in past, because the IPs are randomly selected by runtime from assigned ones like below.
In addition that, the outbound IPs might be changed. Refer to Inbound and outbound IP addresses in Azure App Service for the detail.
Here is brief architecture to fix outbound IPs for App Service. It’s required to utilize NAT Gateway and VNet Integration of App Service. You can fix outbound IP as Public IP on NAT Gateway by using this architecture.

Follow steps below to setup.
- Create VNET and NAT Gateway
- Associate NAT Gateway to a subnet
- Enable VNet Integration
- Setup WEBSITE_VNET_ROUTE_ALL = 1
- Confirm outbound IP with Kudu
You can setup to fix outbound IP on your App Service by following this post.
1. Create VNET and NAT Gateway
Follow Quickstart: Create a virtual network using the Azure portal to create a VNET. Next, Create NAT Gateway by following Tutorial: Create a NAT gateway using the Azure portal. It’s required to specify Public IP like below and the Public IP will be an outbound IP for your App Service.

2. Associate NAT Gateway to a subnet
It’s required to integrate your App Service with VNET to utilize NAT Gateway, so visit your NAT Gateway and choose “Subnets” menu from left side. Choose a subnet which your will enable VNet Integration for your App Service in later.

3. Enable VNet Integration
Visit your App Service and enable VNet Integration by choosing a subnet which you have already associated NAT Gateway.

4. Setup WEBSITE_VNET_ROUTE_ALL = 1
Next, it’s also required to route all your outbound traffic to your VNET, so visit your App Service and choose configuration menu from left side. Put WEBSITE_VNET_ROUTE_ALL = 1 like below. Refer to Integrate your app with an Azure virtual network for the detail.

5. Confirm outbound IP with Kudu
App Service offers useful feature as Kudu not only development usage. Visit your App Service and open Kudo on it. Run curl command and you can confirm returned IP is same with Public IP on your NAT Gateway.

by Contributed | May 4, 2021 | Technology
This article is contributed. See the original author and article here.
Today we are excited to announce the initial availability of Power BI connected PivotTables in Excel for the web. As part of our journey to simplify enterprise data discovery and analysis in Excel, this new capability unlocks more ways to consume such analysis from Excel for the web, empowering more users to make critical decisions with the benefits of Excel and Power BI. For example, you can get up-to-date insights by refreshing the PivotTable, or conduct explorations by manipulating the PivotTable fields all in a browser. You can also include live Excel PivotTables connected to Power BI data directly within your Power BI solutions and apps.
Furthermore, a layer of data protection is added by respecting any existing Microsoft Information Protection labels applied to the Power BI datasets as you connect to it with PivotTables in Excel for the web.
This will work on any workbooks in OneDrive for Business, SharePoint, and Teams, as well as those uploaded to the Power BI service. Users will need access to the underlying dataset to interact with PivotTables connected to Power BI datasets (see how to share Power BI datasets). *Note: refresh and interactivity of Power BI datasets with a live connection to Analysis Services in Excel for the web is not supported.
This new feature has started rolling out across Microsoft 365 tenants, and we expect full roll out over the next few months.
Other Improvements
We are making a few other improvements to help you to be more productive with Power BI connected PivotTables.
Drag-and-Drop Aggregations
PivotTables connected to Power BI datasets will now support drag-and-drop aggregation of fields (e.g. sum, average, distinct count, etc.). This helps you to quickly get answers within Excel without needing pre-defined measures in the underlying Power BI datasets.
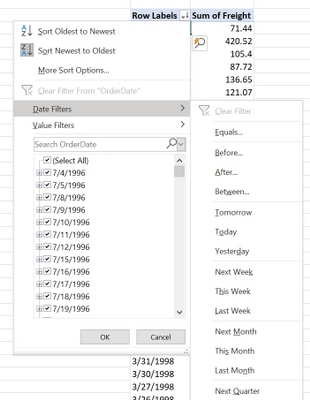
Date Fields
PivotTables connected to Power BI datasets will now support date fields, which means that date filters timelines, and date sorting will now be available.
Field list updates
In addition, we are making some small modifications to the field list, namely pre-defined measures will now be shown within the table they are stored in. We are also updating some of the icons.

We Made it Faster Too
You may have noticed that PivotTables connected to Power BI also got faster. This is due to the recent updates to the Analysis Service engine in Power BI. Learn more details here: Analysis Services Tabular improves MDX query performance in the cloud.
Support for drag-and-drop aggregations, date fields, and the field list improvements will start rolling out in Excel Windows to Office Insiders soon and will be brought to Excel for web at a later stage.
Getting Started Now
We invite you to try out these new capabilities for yourself as they become available to you in the upcoming weeks. Send us your feedback via Help > Feedback in the app.
To learn more:
Subscribe to our Excel Blog and join our Excel Community to stay connected with us and other Excel fans around the world.
by Contributed | May 4, 2021 | Technology
This article is contributed. See the original author and article here.
Azure VMware Solution is a hyperconverged vSphere cluster that leverages an all-flash VMware vSAN software-defined storage system. vSAN is a powerful software-defined storage system, offering many great features available when using Azure VMware Solution.
Like with any storage solution, there are ways to optimize the consumption of the disk. VMware vSAN enables tuning of each VMs storage policy. The granularity goes much deeper than just the VM; each disk attached to the VM can have its own storage policy.
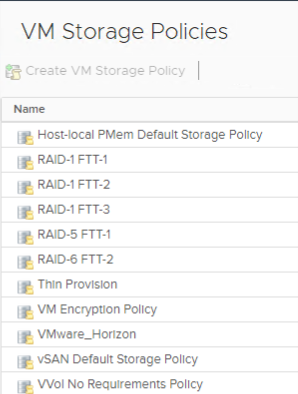
This default storage policy applied to any disk created in the Azure VMware Solution private cloud is 1 failure – RAID-1 (Mirroring). In other words, one host can fail, and no data will be lost. Twice the amount of raw disk is needed to support the consumed disk in this configuration. When a vSAN cluster is only three nodes, this is the only policy available. See this blog article to understand how to modify Azure VMware Solution disk storage policies as the cluster grows.
The typical lifecycle of an Azure VMware Solution private cloud is the initial three (3) node deployment; then, the migration of virtual machines begins from on-premises to Azure VMware Solution, or workloads grow organically. Of course, as more and more VMs begin to fill the three-node cluster, at some point, the cluster nodes need to be expanded to a 4th, 5th, 6th, etc. This ability to grow and shrink the cluster on demand is the beauty of cloud-scale, and more explicitly, running VMware in the cloud. On-premises VMware clusters so many times are overprovisioned, which presents a whole new set of challenges. No need to do that with Azure VMware Solution.
As the cluster grows, more storage policies are available. Here is a complete list of storage policies that are available for Azure VMware Solution VM disks.
If the storage policy used on the virtual machine disks continues to be the same, as the cluster grows, the vSAN cluster will quickly fill. RAID 5/6 policies give a much more efficient use of storage vs. the RAID 1 configuration.
As the Azure VMware Solution private cloud grows beyond three nodes, choose which type of storage policy is best for the VM disks. Then go back and reconfigure the storage policies on the disks of the VMs deployed when the cluster was a three-node cluster.
By doing this, you are optimizing the storage consumption of the Azure VMware Solution cluster, maximizing the investment.
The table below is from the VMware vSAN Design Guide. As you can see, it outlines the types of RAID configurations available and the number of hosts required based on the failures to tolerate needed.

by Contributed | May 4, 2021 | Technology
This article is contributed. See the original author and article here.
Many IT executives are concerned about the security of Operational Technology (OT). This concern is valid based on my experience, but sometimes the approaches to alleviating this anxiety creates a divide between the IT and OT sides of the ‘house’. This blog will attempt to address this divide with practical suggestions about how to get the best results from a thoughtful approach. It will also address methods to accomplish useful but non-intrusive monitoring in the OT environment. It will provide specific technical examples to guide you. If this tickles your interest, read further.
Passive network monitoring is one of the most effective and least intrusive tools to gain visibility into OT networks. Installed properly it provides information on inventory, network topology, protocols in use, endpoint types, switches and routers, etc. Much of this information is not generally well documented and is only vaguely known by enterprise security teams. It lives below OT edge firewalls and is carefully guarded by the engineers who are responsible to make sure their factories continue to operate reliably. As most security experts know, it is impossible to protect equipment you don’t know you have.
There is a natural push-pull between enterprise security teams who are tasked with overall business protection and operational engineers who are more focused on production. It is common for operational engineers to express concern that a network monitoring tool will affect the reliability of the OT equipment. While they may be honestly concerned about cyber security, they fear repercussions if reliability is affected. If corporate policy mandates monitoring, the security team is usually instructed to install their monitoring equipment as far away from the production equipment as possible. This usually results in an installation at or near the enterprise edge firewall. The most common argument is that anything bad will come from the internet which is on the other side of that firewall. This is usually NOT the best location for OT network monitoring and the assumption relating to the source of threats is not accurate either. However, based on the urgency of schedules, this location is often accepted as better than nothing. It is important to understand that the AD4IoT sensor is completely passive. It only listens to copies of network traffic and as such is not a threat to operational technology.
I would like to suggest a more reasoned approach, which admittedly takes more time and possibly resources, but results in a win-win for both groups if implemented well. OT networks are often complicated by a variety of interconnected systems as shown in the next diagram. The red sections of this diagram show the ideal locations for connections to the AD4IoT. It is important to start implementation with a diagram of the OT system. Diagrams of this sort are often provided as proposal documentation when Industrial Control Systems are purchased. They may often be found in on control house walls, or in the OT engineer’s office. Because these systems continue to evolve, and are often upgraded in piecemeal fashion, these drawings are seldom up to date. However, they still provide a reasonable starting point for understanding the best placement for sensors. The point is to accurately and completely document the inventory of control equipment and the network architecture of the system. If a sensor is only installed in the outgoing DMZ, much of this inventory information will not be available. Information identifying the types and versions of Purdue level 0 to 2 devices will not be available. To determine this information, the actual downloads to these devices must be seen by the AD4IoT sensor.

This is an example of an ICS diagram with the recommended locations of sensors (in red).
How can we identify if we are located at the best location?
A sample traffic taken too high in the network is analyzed below using the sensor.
In these screen shots, the sensor is too high in the network, too close to the enterprise firewall. Note that no devices in the Process Control Level 0/1 are shown. The monitoring in this network shows the workstations and their interactions with database server, engineering, HMIs, and AD, some exiting traffic, but no PLC control traffic.
 In the inventory, no firmware or model information is identified because the traffic to the PLCs is not being seen at this location in the network.
 Another similar instance is where the majority of the traffic is broadcast or multicast. While some industrial control systems use this method for information transfer, the indications here are that the sensor is not seeing much of the control traffic. Only one PLC is shown in the Process Control area and most devices are sending multicast traffic. The switches are seen, the HMIs and database servers but not much control traffic as shown in the inventory view below.


A properly configured system will look like this. Notice the OT Protocols; Profinet DCP, Profinet Real-Time, Siemens S7 and S7 Plus. Notice the balance between Supervisory and Process Control. The sensor is seeing the traffic between the engineering workstation and the PLCs when they are downloaded as evidenced by the presence of firmware versions and PLC model numbers in the inventory.


Why not just monitor the enterprise edge?
I would like to address the reason for monitoring networks in the ICS in addition to monitoring at the enterprise edge. Many people assume that this is adequate since they see this as the source of all threats. I will use the sample ICS network shown above to discuss some potential access points for malware or data compromise, see below.

With your security ‘blue team’ hat on, think about these scenarios identified by numbers in blue ovals on the diagram:
- The ICS (or DCS) may be maintained by an external contractor, possibly the system integrator in the case of PLC systems, or generally the Original Equipment Maker (OEM), for DCS equipment. Sometimes these people are authorized to utilize laptops with specialized OEM software to perform upgrades, troubleshoot problems, install new hardware or do routine system maintenance. Even if they are not permitted to utilize their laptops, they may install software, OS and firmware upgrades, and other activities utilizing programs they bring in on USB or other devices.
- Many large organizations have network engineers who manage all or most network devices, including but not necessarily limited to switches, routers, firewalls, and the like. Smaller organizations may contract networking engineers. This being a rather specialized function, these folks usually operate somewhat independently of the normal operations personnel. Exceptions would be when the ICS or DCS supplier either utilizes unmanaged devices or provides the management function as a part of their service. Switch management and required firmware upgrades in addition to reasonable hardening is not normally on the ‘radar screen’ for many system upgrades. The adage, ‘if it ain’t broke, don’t fix it’ is commonly the norm.
- Variable Frequency Drives (VFDs) are generally maintained by the supplier. Problem-solving, firmware upgrades, and system modifications are accomplished through contracts or purchase orders with the equipment provider. These changes once again introduce uncontrolled laptops into the OT environment where these devices may be networked to the ICS.
- Very expensive process analyzers and industrial robots may be leased from the manufacturers. This equipment often comes with a required data connection to the manufacturer for usage monitoring and troubleshooting purposes. These connections should be and often are firewalled but may allow incoming traffic for firmware updates and other related activities.
- Most large organizations have physical security operations handled by separate internal organizations or through an externally contracted firm. It is common to see security cameras that are used for both ICS and security functions. Sometimes, the operator can even view the perimeter cameras or other cameras on his/her operator screens.
- It is also common to see voice communication equipment sharing switches or infrastructure devices with OT networks. While these are generally on different VLANs, errors can connect these devices with OT equipment.
- Additionally, there may be data links to Uninterruptible Power Systems (UPSs), again usually maintained by the OEM.
- Plant historian packages often have links to share plant data, inventory, and other information with the enterprise.
- Sometimes contracts are established for the maintenance of corporate printers. Since most of these devices have unpatched apache web servers, maintenance could introduce issues carried over from enterprise equipment.
- Operators have even been known to utilize USB ports on HMI devices to charge their phones thereby unknowingly placing the HMIs on a cellular network.
- Cleaning contracts, maintenance of support systems such as HVAC and fire protection generally allow access to controlled areas where physical access to ICS equipment could be leveraged by unscrupulous parties.
And the list can go on… with every industrial facility having different variations on this theme. As any security-minded individual can readily see, the opportunities for compromise, malware infection, and data exfiltration in any large industrial campus are numerous.
Conclusions
Coordination with operational engineers is the starting point to a win-win engagement. The benefits are apparent to both enterprise and operations personnel. With correct sensor placement, a complete inventory with full device information, firmware versions and model numbers can be derived. This is a benefit to both parties. Additionally, the actual network flows can be confirmed, unexpected paths can be identified and potential vulnerabilities can be found and corrected.
Monitoring Industrial Control Systems at the enterprise edge, while important, is by no means adequate. Malware introduced, even if prevented from beaconing home by enterprise edge firewall rules, can still damage operational equipment and affect production or operational safety. Data can be modified, control system programs could be changed to perform dangerous actions, company secrets could be stolen, and system backups corrupted.

Recent Comments