by Contributed | Mar 18, 2021 | Technology
This article is contributed. See the original author and article here.
Written by Jason Yi, PM on the Azure Edge & Platform team at Microsoft.
Acknowledgements: Dan Lovinger
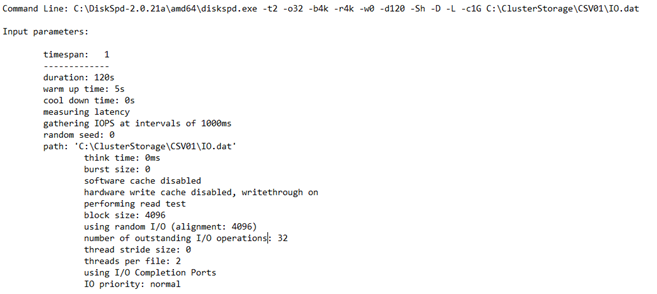
Imagine this, you have an Azure Stack HCI cluster set up and ready to go. But you have that lingering question: What is your cluster’s storage performance potential? In such cases, you can rely on micro-benchmarking tools such as DiskSpd. And if you are not aware, the tool helps you customize and configure your own synthetic workloads by tweaking built in parameters. For more information, you can read about it here.
“Visible” and Clean Data
Most folks who already have experience with DiskSpd are likely familiar with the txt output option, which is also displayed in the terminal. The purpose behind this output was to present the data in a human readable format. We also aggregated some of the finer details to generate practical metrics for the users. This also means that we determined which metrics would be considered valuable. But, did you know that there is an option to output in XML, which reveals additional, granular data such as the total IOs achieved per second.
Let’s first take a few moments to review the txt output. As you may know, this output is split into four different sections:
Input settings:
CPU utilization details:

Total IO performance metrics:

Latency percentile analysis (-L parameter):

This result produces a detailed view of a couple performance metrics. That’s great, but what if you are interested in other data insights? If you did not read carefully through the DiskSpd wiki page, you may have missed the fact that there is a “hidden feature.” There is another output format that generates an XML file. This can be invoked by the -Rxml parameter and piped into an XML file with your preferred file name. But wait, there’s more! If you peep into the XML file, you will notice that there is more data than what was originally shown in the txt output, such as the total IOs achieved per second. More specifically, the XML output reveals more granular data as opposed to the aggregated data for the human eyes. If you wish to take a look, be warned – your eyes will burn from the squinting.
Table of Contents: XML
Before your eyes burn, let’s create a brief table of contents for the XML file.
<System> Under this element, you have some basic information regarding the system itself, such as the server/VM name, DiskSpd version, number of processors, etc.

<Profile> Under this element, you will find your input parameters from when you ran DiskSpd. To name a few, this includes the queue depth, thread count, warm up time, test duration, etc. There are quite a few sub-elements within this section. Luckily, most of them are self-explanatory, and so let us focus on a few of them.
- <TimeSpans> Under this element, you will find <TimeSpan> elements. Each of those <TimeSpan> elements represent one DiskSpd test run. As you may have guessed, the content within <TimeSpan> contains a set of parameters that you, the user, specifies. For example, you can see that the <requestcount> element is set to 32 since we initially set the queue depth to be 32 when we ran DiskSpd. You can think of this section as being analogous to the “input settings” result in the txt output.

<TimeSpan> This element is not to be confused with the above <TimeSpan> element. This section contains the results of your DiskSpd test. It is similar to the data presented in the txt file, but with added granular data. More specifically, you can view the CPU usage, IOPS statistics and latency statistics (average total milliseconds, standard deviation, etc.), in their respective sub-elements:
- <CpuUtilization>
- The CPU data is broken down per core.
- <Latency>
- The latency data is broken down into separate “buckets” where each bucket corresponds to 1 percentile rank, in ascending order from 0 to 100%.
- <Iops>
- The IOPS data is broken down into separate “buckets” where each bucket corresponds to the IO data for 1 millisecond.

This may give rise to the question; can you modify the contents of this XML file and pipe it back into DiskSpd? Yes, you absolutely can! In fact, there is another parameter precisely for this purpose (-X). Here are the following steps to get you started: (great for batch testing!)
- Before using this parameter (-X), you will need to preserve the contents within the <Profile> element. Any other data that exists in the XML file may be discarded. If you plan to run the DiskSpd test with modified input parameters, be sure to make the appropriate changes in the <Profile> section.
- Optional: If you plan to run multiple DiskSpd tests, you can add more <TimeSpan> elements under <Profile>, with your desired input parameters.
- You can then run DiskSpd with the -X parameter which will take the XML file path as input and output a new XML (or txt) file with the newly generated result.

Bonus: Script to Extract IOPS
In case you wanted to start somewhere, I’ve included a short script that takes in a DiskSpd XML output named “output.xml” and extracts the total IOs achieved per second into a neat CSV file for you to view (ensure they are in the same path). This might be a good place to start if you want to get more data insights about IOPS. **Foreshadowing**
Final Remarks
Hopefully, this provides a solution for those situations where you always wanted a more detailed form of data or to run DiskSpd batch tests. You can also imagine that there are a variety of ways you can manipulate the XML output through PowerShell scripts. Alas, this is for another day.
*Script Below*
# Written by Jason Yi, PM
# 12/2020
<#
.PARAMETER d
integer number of diskspd runs (can consider it as duration since each run is one second long)
.PARAMETER path
the path to the test file
.PARAMETER rw_flag
the default is 0. 0 represents that the user wants to input their custom read/write ratio whereas 1 represents that the user wants a randomized read/write ratio
.PARAMETER g_min
the minimum g parameter (g parameter is the throughput threshold)
.PARAMETER g_max
the maximum g parameter (g parameter is the throughput threshold)
.PARAMETER b
the block size in bytes
.PARAMETER r
random IO aligned to specified size in bytes
.PARAMETER o
the queue depth
.PARAMETER t
the number of threads
.PARAMETER w
the ratio of write tests to read tests
#>
Param (
[Parameter(Position=0,mandatory=$true)][int]$d,
[Parameter(Position=2,mandatory=$true)][string]$path, # C:ClusterStorageCSV01IO.dat
[int]$rw_flag = 0,
[int]$g_min = 0,
[int]$g_max = 8000,
[int]$b = 4096,
[int]$r = 4096,
[int]$o = 32,
[int]$t = 4,
[int]$w = 0)
Function Create-Timespans{
<#
.DESCRIPTION
This function takes the input number of diskspd runs (or duration) and lasts for that input number of seconds while randomizing
the throughput threshold within a specified range. Includes same parameters initially passed in by user.
#>
Param (
[int]$d,
[string]$path,
[int]$g_min,
[int]$g_max,
[int]$b,
[int]$r,
[int]$o,
[int]$t,
[int]$w,
[int]$rw_flag
)
[xml]$xml=@”
<Profile>
<Progress>0</Progress>
<ResultFormat>xml</ResultFormat>
<Verbose>false</Verbose>
<TimeSpans>
<TimeSpan>
<CompletionRoutines>false</CompletionRoutines>
<MeasureLatency>true</MeasureLatency>
<CalculateIopsStdDev>true</CalculateIopsStdDev>
<DisableAffinity>false</DisableAffinity>
<Duration>1</Duration>
<Warmup>0</Warmup>
<Cooldown>0</Cooldown>
<ThreadCount>0</ThreadCount>
<RequestCount>0</RequestCount>
<IoBucketDuration>1000</IoBucketDuration>
<RandSeed>0</RandSeed>
<Targets>
<Target>
<Path>$path</Path>
<BlockSize>$b</BlockSize>
<BaseFileOffset>0</BaseFileOffset>
<SequentialScan>false</SequentialScan>
<RandomAccess>false</RandomAccess>
<TemporaryFile>false</TemporaryFile>
<UseLargePages>false</UseLargePages>
<DisableOSCache>true</DisableOSCache>
<WriteThrough>true</WriteThrough>
<WriteBufferContent>
<Pattern>sequential</Pattern>
</WriteBufferContent>
<ParallelAsyncIO>false</ParallelAsyncIO>
<FileSize>1073741824</FileSize>
<Random>$r</Random>
<ThreadStride>0</ThreadStride>
<MaxFileSize>0</MaxFileSize>
<RequestCount>$o</RequestCount>
<WriteRatio>$w</WriteRatio>
<Throughput>0</Throughput>
<ThreadsPerFile>$t</ThreadsPerFile>
<IOPriority>3</IOPriority>
<Weight>1</Weight>
</Target>
</Targets>
</TimeSpan>
</TimeSpans>
</Profile>
“@
# 1 flag means that the user wishes to randomize the rw ratio
# 0 flag means that the user wishes to control the rw ratio
# Basically, throw an error when the flag is no 0 or 1
if ( ($rw_flag -ne 1) -and ($rw_flag -ne 0) ){
throw “Invalid rw_flag value. Please choose 0 to provide your own rw ratio, or 1 to randomize the rw ratio.
“
}
$path = Get-Location
# loop up until the number of runs (duration) and add new timespan elements
for($i = 1; $i -lt $d; $i++){
$g_param = Get-Random -Minimum $g_min -Maximum $g_max
$true_w = Get-Random -Minimum 0 -Maximum 100
# if there is only one timespan, add another
if ($xml.Profile.Timespans.ChildNodes.Count -eq 1){
# clone the current timespan element, modify it, and append it as a child
$new_t = $xml.Profile.Timespans.Timespan.Clone()
$new_t.Targets.Target.Throughput = “$g_param”
if ($rw_flag -eq 1){
$new_t.Targets.Target.WriteRatio = “$true_w”
}
$null = $xml.Profile.Timespans.AppendChild($new_t)
}
else{
# clone the current timespan element, modify it, and append it as a child
$new_t = $xml.Profile.Timespans.Timespan[1].Clone()
$new_t.Targets.Target.Throughput = “$g_param”
if ($rw_flag -eq 1){
$new_t.Targets.Target.WriteRatio = “$true_w”
}
$null = $xml.Profile.Timespans.AppendChild($new_t)
}
}
# show updated result
$xml.Profile.Timespans.Timespan
# save into xml file
$xml.Save(“$pathexpand_profile.xml”)
}
#
# SCRIPT BEGINS #
#
# create the xml file with diskspd parameters
Create-Timespans -d $d -g_min $g_min -g_max $g_max -path $path -b $b -r $r -o $o -t $t -w $w -rw_flag $rw_flag
# create path, input file, and node variables
$path = Get-Location
# feed profile xml to DISKSPD with -X parameter (Running DISKSPD)
Invoke-Expression “.diskspd.exe -X’$pathexpand_profile.xml’ > output.xml”
$file = [xml] (Get-Content “$pathoutput.xml”)
$nodelist = $file.SelectNodes(“/Results/TimeSpan/Iops/Bucket”)
$ms = $nodelist.getAttribute(“SampleMillisecond”)
# store the bucket objects into a variable
$buckets = $file.Results.TimeSpan.Iops.Bucket
# change the millisecond values to seconds
$time_arr = 1..$d
foreach ($t in $time_arr){
$buckets[$t-1].SampleMillisecond = “$t”
}
# select the objects you want in the csv file
$nodelist |
Select-Object @{n=’Time (s)’;e={[int]$_.SampleMillisecond}},
@{n=’Total IOs’;e={[int]$_.Total}} |
Export-Csv “$pathiops_stat_seconds.csv” -NoTypeInformation -Encoding UTF8 -Force # Have to force encoding to be UTF8 or data is in one column (UCS-2)
# import modified csv once more
$fileContent = Import-csv “$pathiops_stat_seconds.csv”
# if duration is less than 7 (number of percentile ranks), then add empty rows to fill that gap
if ($d -lt 7 ) {
for($i=$d; $i -lt 7; $i++) {
# add new row of values that are empty
$newRow = New-Object PsObject -Property @{ “Time (s)” = ” }
$fileContent += $newRow
}
}
# show output in the terminal
$fileContent | Format-Table -AutoSize
# export to a final csv file
$fileContent | Export-Csv “$pathiops_stat_seconds.csv” -NoTypeInformation -Encoding UTF8 -Force
by Contributed | Mar 18, 2021 | Technology
This article is contributed. See the original author and article here.
Introduction
This is John Barbare and I am a Sr Customer Engineer at Microsoft focusing on all things in the Cybersecurity space. In a previous blog back in July, 2020, I walked through a demo of setting up an Attack Surface Reduction (ASR) rule policy in Microsoft Endpoint Manager (MEM) for your Windows Operating Systems and how to view the detections once applied.
Since then, Microsoft has introduced a new “Warn Mode” in addition to the Audit and Block modes previously. With that said, I will give a brief overview of ASR Rules, demo what the differences are in the different modes, show custom security notifications for your organization, and the hunt for ASR rule alerts in the new Microsoft 365 Defender unified portal.
What are Attack Surface Reduction Rules?
Attack surface reduction rules help prevent software behaviors that are often abused to compromise your device or network. For example, an attacker might try to run an unsigned script off a USB drive, or have a macro in an Office document make calls directly to the Win32 API. ASR rules can constrain these kinds of risky behaviors and improve your organization’s defensive posture to decrease your risk considerably from being attacked with Ransomware, various other types of malware, and other attack vectors.
If you are evaluating or executing a proof of concept from a 3rd party HIPS (Host Intrusion Prevention System) over to ASR rules, this article will assist you in the planning, development, and proper configuration in MEM. With the complete end to end protection Microsoft offers, this article will focus on the Attack Surface Reduction component of Windows Defender Exploit Guard. Prevent actions and apps that are commonly used by malware, such as launching executables from email (.exe, .dll, .scr, .ps, .vbs, and .js).
- Scripts or applications that launch child processes
- Most rules can be set to Audit to monitor activity prior to being set to enforce
- All rules support exclusions based on file or folder names
- ASR rules support environmental variables and wildcards
ASR rules may block legitimate applications from making changes, so these features come with both an Audit mode and a Block mode and a newly released Warn mode. I always recommend to my customers when configuring ASR rules for the first time to conduct the changes in Audit mode first so it will allow for testing of the policy before moving any of the rules into Block mode. But now we can audit, then warn, before placing into block mode so our users know that a risky behavior is being detected. This is exactly like using SmartScreen where the user goes to website that is malicious, and is warned but given the choice to bypass or not continue at all. This is great before rolling out a new feature and will provide some great context around the warn mode feature.
Warn mode
With the new warn mode, whenever content is blocked by an ASR rule, users see a dialog box that indicates the content is blocked. The dialog box also offers the user an option to unblock the content. The user can then retry their action, and the operation completes. When a user unblocks content, the content remains unblocked for 24 hours, and then blocking resumes. Warn mode helps your organization have ASR rules in place without preventing users from accessing the content they need to perform their tasks.
Supported OS for Warn Mode and Requirements
Warn mode is supported on devices running the following versions of Windows OS:
Microsoft Defender Antivirus must be running with real-time protection in Active mode.
In addition, make sure Microsoft Defender Antivirus and antimalware updates are installed.
- Minimum platform release requirement: 4.18.2008.9
- Minimum engine release requirement: 1.1.17400.5
Exceptions to Warn Mode
The following three ASR rules are not supported in Warn Mode:
- Block JavaScript or VBScript from launching downloaded executable content (GUID d3e037e1-3eb8-44c8-a917-57927947596d)
- Block persistence through WMI event subscription (GUID e6db77e5-3df2-4cf1-b95a-636979351e5b)
- Use advanced protection against ransomware (GUID c1db55ab-c21a-4637-bb3f-a12568109d35)
In addition, warn mode is not supported on devices running older versions of Windows. In those cases, ASR rules that are configured to run in warn mode will run in block mode.
Setting up Warn Mode Using Microsoft Endpoint Manager
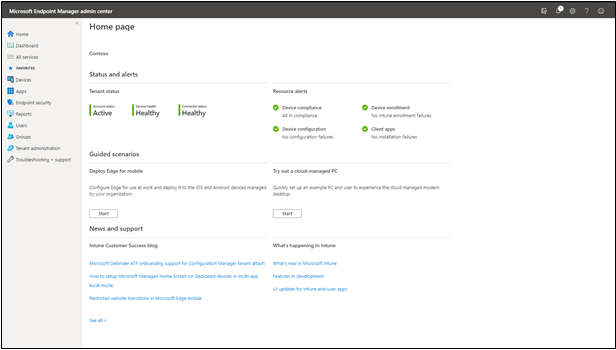
The first item we want to do is make sure that all the devices we want to push the new ASR rule policy are showing up inside MEM admin center. This paper assumes you have enrolled all the devices for your preferred method, and we are checking to make sure the devices are shown before creating or pushing out a new policy. Navigate to the Microsoft Endpoint Manager admin center and login with your credentials. Once logged in you will arrive at the home page.
MEM Home
Select “Devices” and then “All devices” to make sure the device you will be applying the new ASR rule Policy has been synchronized.
 All Devices Page
Next, we will select the “Endpoint Security” tab which is under the “Device” tab.
 Endpoint Security Home
This will bring you into the main policy dashboard to create the new ASR Warn rule policy. First you will select “Attack Surface Reduction” under the “Manage” tab. Select “create policy” at the top, and then a window will open to pick the operating system “Platform” and “Profile”. For “Platform”, select Windows 10 and later and for “Profile”, select Attack Surface Reduction Rules and click “Create” at the bottom.
 Creating the Profile/Policy
This will bring you to the creation of the profile for ASR. Name the profile in the “basics” tab and then provide a brief description and click next.
 Name the Profile
Configuration Settings
The next tab, “Configuration settings” is where you will configure the ASR rules. Here we have placed all the ASR rules in warn except the ones that are not allowed. From selecting the third ASR rule, one can see all the settings for the rule including the new Warn mode. You can also search for a setting in the top box underneath the settings and before the ASR rules. After placing them in the correct mode, select next.
 Selecting Warn Mode for the ASR Rule Policy
Assignments
Next, we will have the option to assign the policy to select groups, all users, all devices, or all users and devices. Here we are targeting just a select group and will pick the IT Group for this new policy. Selecting the groups to include and IT Group will target the devices inside the group and then click select and then click next. This is the equivalent to applying a policy to an organizational unit in Group Policy Objects.
 Adding Assignments
Many users ask when to use user groups and when to use device groups. The answer depends on your goal. Use device groups when you do not care who is signed in on the device, or if anyone is signed in. You want your settings to always be on the device. Use user groups when you want your settings and rules to always go with the user, whatever device they use.
Review and Create
Now let’s head over to finalizing up the newly created profile on the review and create profile page. You will see all the settings for our new Warn ASR policy, and you can confirm before selecting create. Go ahead and click on create to save the new ASR policy.
 Creating the Profile
The next page will bring you to the summary page where you can view the new ASR rule policy you just created. When you select the policy name that you have created, you will be redirected to the overview page which will display more detailed information.
 Viewing the new Profile
When you select a tile from this view, MEM displays additional details for that profile if they are available. In this case, it applied my new ASR Rule Warn Mode policy to my lab test machine that I targeted successfully.
 Profile Synced to Targeted Machine
Testing Out the New Warn Mode
In my lab, I will test out one of the rules to show you what Warn mode looks like when triggering an ASR Rule with my newly applied ASR Warn mode policy. In the first instance I have a malicious Microsoft Word Document that will create multiple child processes. As seen below, I open the document and then bypass the security warning and click on Enable Content.
 Bypassing Security Warning
After bypassing the alert, a Windows Security notification is presented with a dialog box that indicates the content is blocked. The dialog box also offers me the new option to unblock the content. The dialog box below has been increased in size to show you the full warning.
 Warn Mode Notification
If the ASR Policy would have been in Block mode, the below dialog box would have been presented to the user.
 Block Mode Notification
As one can see during testing or implementation of ASR Rules, you can see the real value of using Warn mode versus going strait to Audit and then full Block mode. This way you can let your users know you will be implementing a new security policy and they will be warned before full implementation.
Customizing the Dialog Box
If your organization wants to display a customized notification from Windows Security to display options to call, email, or redirect the user to a help portal, the instructions can be found here. I will not walk through the steps, but the screenshot below depicts what a customized notification would look like when an ASR Rule or any other Windows Security notification is displayed.
 Customized Dialog Box from Defender
Advanced Hunting with ASR Rules in Microsoft 365 Defender
Microsoft Defender 365 provides detailed reporting for events as part of its alert investigation scenarios. You can query Microsoft Defender 365 data by using advanced hunting using KQL (Kusto Query Language). Login into Microsoft 365 Defender and select Hunting and then Advanced Hunting blade at the top. The query we will run is the following:
DeviceEvents
| where ActionType startswith ‘Asr’
 Advanced Hunting for ASR Triggers
Monitoring the ASR Rules in Microsoft 365 Defender
In the same window, select Configuration Management blade under Endpoints and then select Go to Attack Surface Management. Select the detections tab to see a more fine-grained ASR rule detection graph in Audit and Block mode over a period time and what has been detected.
 Microsoft 365 Defender ASR Rule Line Chart Triggers
Conclusion
Thanks for taking the time to read this article and I hope you understand the new Warn mode for ASR rules and how you can use it in your organization during testing and pre-implementation. Using the new unified portal – Microsoft Defender 365 – to hunt for ASR detections and see a graph of what is getting triggered will further show the value for any IT Manager the value of the Microsoft 365 security stack. Hope to see you in the next blog and always protect your endpoints!
Thanks for reading and have a great Cybersecurity day!
Follow my Microsoft Security Blogs: http://aka.ms/JohnBarbare and also on LinkedIn.
by Contributed | Mar 17, 2021 | Technology
This article is contributed. See the original author and article here.
こんにちは。SQL Server サポート チームです。
今回は1つの OS 上に SQL Server x64 版 と x86 版が両方インストールされており、x64 版でフェールオーバークラスターインスタンス(以下、FCI)を構成している環境に対して、x86 版の更新プログラムを適用した場合に発生する問題について説明します。
本現象が発生すると、FCI 構成の SQL Server の役割を移動(フェールオーバー)する際に失敗しますので、発生した場合は後述する回避策を実施ください。
■概要
任意のバージョンの SQL Server x64 版と、x86 版を両方インストールしている環境に、x86 版の更新プログラムを適用した場合、FCI で使用する x64 版用の DLL ファイルが、意図せず x86 版用の DLL ファイルで置き換えられてしまう事があります。
具体的には、x86 版の更新プログラムの動作により、本来 x86 版用の「C:WindowsSysWOW64SQSRVRES.DLL」を置き換えるべきところが、誤って x64 版用の「C:WindowsSystem32sqsrvres.dll」を置き換えてしまうことによって発生します。
なお、「C:WindowsSystem32sqsrvres.dll」や「C:WindowsSysWOW64SQSRVRES.DLL」は、FCI 構成において、役割の移動時などリソースの操作や管理に使用されるライブラリです。
■影響
x64 版の SQL Server にて FCI を構成している環境において本現象が発生すると、「C:WindowsSystem32sqsrvres.dll」がx86 版用のファイルで置き換えられたノードに SQL Server の役割を移動(フェールオーバー)させようとすると、エラーとなり役割の移動(フェールオーバー)や起動が行えません。
■発生条件
以下の条件を全て満たす場合に発生します。
・SQL Server(x64)の任意のバージョンで FCI 構成をしているインスタンスが存在する。
・SQL Server(x86)のインスタンスが存在する。
※ SQL Server 2016 以降 64ビット OS で 32ビットで稼働する WOW64 のサポートが終了しているため、SQL Server 2014 以前が対象となります。
・C:WindowsSysWOW64 フォルダーに SQSRVRES.DLL が存在する。
■問題が発生する手順
・SQL Server(x86) のインスタンスに更新プログラムを適用します。
■発生状況の確認方法
「C:WindowsSystem32sqsrvres.dll」が、下記例のようなパスに格納される x86 版のファイルと同じであれば、本現象が発生していると判断できます。
同じか否かは、ファイルのプロパティを開き、[詳細] タブから [製品バージョン] を比較することが可能です。
(x86 版の sqsrvres.dll の格納先例)
C:Program Files (x86)Microsoft SQL ServerMSSQL12.SQLEXPRESSMSSQLBinnSQSRVRES.DLL
※ バージョン(12)やインスタンス ID(SQLEXPRESS)により上記パスは異なります。適宜読み替えてください。
■回避策
上記条件に該当する環境にて、x86 版 SQL Server の更新プログラムを適用する際、適用前に「C:WindowsSysWOW64」に「SQSRVRES.DLL」がある場合には、削除を行ってください。
また、更新プログラムを続けて複数インストールする場合には、インストールした更新プログラムで「C:WindowsSysWOW64SQSRVRES.DLL」にファイルを配置する可能性があるため、各インストールごとに上記ファイルの削除の手順を実施ください。
※ SQL Server の更新プログラムはサービスパックごとに累積型となっており、適用予定の更新プログラムのうち最新の更新プログラムを適用するのみで、対処可能ですので、併せてご検討ください。
既に「C:WindowsSystem32sqsrvres.dll」が置き換わってしまっている場合や、更新プログラムが多くあり上記回避策が難しい場合には、x64 版 SQL Sever のインストール フォルダーの「Binn」フォルダーより「SQSRVRES.DLL」を、「C:Windowssystem32」へ、コピーすることで対処できます。
例)
コピー元: C:Program FilesMicrosoft SQL ServerMSSQL15.MSSQLSERVERMSSQLBinn
コピー先: C:Windowssystem32
※ バージョン(15)やインスタンスID(MSSQLSERVER)により上記パスは異なります。適宜読み替えて下さい。
※ファイルが使用中で置き換えられない場合、クラスター サービスを停止する必要があります。まずは、パッシブノードから実施することをご検討ください。
以上となります。
by Contributed | Mar 17, 2021 | Technology
This article is contributed. See the original author and article here.
The 21.03 Azure Sphere OS quality update is now available for evaluation in the Retail Eval feed. The retail evaluation period provides 14 days for backwards compatibility testing. During this time, please verify that your applications and devices operate properly with this release before it is deployed broadly via the Retail feed. The Retail feed will continue to deliver OS version 21.02 until we publish 21.03 in two weeks.
This evaluation release of 21.03 includes updates to mitigate against the following CVEs. It does not include an updated SDK.
For more information on Azure Sphere OS feeds and setting up an evaluation device group, see Azure Sphere OS feeds and Set up devices for OS evaluation.
For self-help technical inquiries, please visit Microsoft Q&A or Stack Overflow. If you require technical support and have a support plan, please submit a support ticket in Microsoft Azure Support or work with your Microsoft Technical Account Manager. If you would like to purchase a support plan, please explore the Azure support plans.
![[Guest Blog] Human Touch with Microsoft Teams](https://www.drware.com/wp-content/uploads/2021/03/large-1155)
by Contributed | Mar 17, 2021 | Technology
This article is contributed. See the original author and article here.
This blog is written by Mario Trentim as a part of our Humans of IT guest blogger series. Mario has a passion for creativity, problem solving, continuous improvement and technology. He shares his best practices to adding a human touch to your remote experience on Microsoft Teams.
I delivered a webinar about team building and teamwork. To my surprise, I got a lot of comments mentioning that it is challenging to engage with colleagues virtually. People even mentioned that we are losing touch with our human side because of technology. What are your thoughts on this, especially as we’ve shifted to remote work?
As we’ve all experience remote work now and picked up a tip or two, we know virtual meetings do not have to be boring, inflexible, impersonal neither meetings have to be always “straight to the point.” It is important to know that if you feel disconnected from your coworkers, you can make a change in the way you’re conducting or participating in meetings, and ultimate, it’s on you. The technology is “just” a tool.
In this article, I bring some tricks and tricks to engage and motivate coworkers using Microsoft Teams. Please read on if this is relevant to you.
By working in a physical space, you have the chance to approach your colleagues in various ways. You meet informally at the cafeteria, you have lunch together. You can walk across the office and ask for help or chat about personal topics.
Working from home and moving to virtual-only meetings, are we sentenced to behave like machines? The answer is no.
It is on you and your team to build productive habits. To be a valuable team member, it is essential that you:
- Participate actively in the discussions;
- Provide feedback;
- Be empathetic.
As we reflect on the principles above, we can come up with simple behaviors for our daily virtual meetings and teamwork collaboration. Let’s start with virtual meetings:
1) Turn on your camera;
2) Take a few minutes to talk about personal topics;
3) Pay attention to people’s reactions and ask questions;
4) Take notes, paraphrase, and summarize.
I discovered that by changing my Microsoft Teams’ background can spark interesting warm-up conversations. I use photos from the places I visited, sometimes cartoons or movie scenes.
Warming-up questions are a cornerstone of every meeting. Ask direct questions about hobbies, family, or other appropriate topics. For example, “How is Ana doing with homeschooling?”, “Is your dog okay?”, “Did you had a chance to go for a run yesterday?”. Well, use your imagination.
It is not a chore. You have to be genuinely interested in the other person. Start doing that, and you will feel better.
Multi-tasking and half-hearted attention are obstacles to productivity and team morale. Avoid them at all costs. To get people focused, ask questions, engage people, summarize.
By using Microsoft Teams, I take full advantage of collaboration with Microsoft Whiteboard. It is an engaging and fun process.

Finally, don’t forget to define action plans and owners. Assigning responsibility and following up on decisions is a final touch on team motivation. In the physical office, we could have those Post-It notes.
You can do the same with Microsoft Teams by using Lists or Planner. Visually tracking goals and activities is another tool for engagement and motivation.

Hope that this article was a reminder of the human touch we’re are all capable of having from our homes. As we are all now well-versed in remote work, what other suggestions do you have? Share in the comments below!

Recent Comments