
by Contributed | Mar 25, 2021 | Technology
This article is contributed. See the original author and article here.
Out of the tens of thousands of students from 163 countries who registered for the 2021 Imagine Cup, 39 teams advanced to the World Finals to showcase their original tech innovations.
Our World Finalists represent four competition categories: Earth, Education, Healthcare, and Lifestyle. Using Artificial Intelligence, IoT, Augmented Reality, gamification, and so much more, these students have developed their ideas into impactful and inspiring solutions to make a difference. During Round 1 of the World Finals, each team gave a 3-minute project pitch followed by a demo presented to expert judges, answering questions and discussing their ideas in depth.
Twelve teams were selected to move forward based on their innovative use of Azure technology, diversity and inclusive design, and potential to make an impact in their selected category. They’re heading on to Round 2 of the World Finals – congratulations to all these incredible students for making it this far!
Meet the World Finalists!
Intelligent Hives, Poland
Earth category
Project: Intelligent Hives – Bee Monitoring System
On average, 30% of bee colonies are unable to survive into the next season. Intelligent Hives brings beekeeping into the 21st century. The team’s intelligent solution helps save bees, beekeepers, money, and time. |
|
ProTag, New Zealand
Earth category
Project: ProTag
ProTag is a smart ear tag for livestock that can detect the early onset of illness in real-time, lowering costs and increasing animal welfare along with farmers’ peace of mind.
|
 |
Virtual Radiologist, Nepal
Earth category
Project: Pico Sat
Pico Sat is a miniature version of an environmental satellite, which provides users information about environmental parameters like altitude, temperature, humidity, pressure, dust, and pressure.
|
 |
Hands-On Labs, United States
Education category
Project: Hands-On Labs – How can we enable every student to have a truly ‘hands-on’ learning experience’ online?
Hands-On Labs is a set of remote laboratories that allows students to observe and remotely control physical tools online in real-time for their courses. The team aims to provide an active learning experience to students from any background all around the world.
|
 |
Nyansapo AI, United States
Education category
Project: Digital Literacy Assessment
The team’s mobile app enables instructors to assess the literacy level of multiple children at once and track the individual literacy progress of children over time. As a digital assessment tool, the projects makes it easy for instructors to collect, organize, and analyze assessment data to effectively place students in the best educational level.
|
 |
Tandemly, United States
Education category
Project: Tandemly
Using an array of built-in services and Augmented Reality, Tandemly aims to enhance and transform the educational experience for individuals with learning disabilities. |
 |
Cepha, United States
Healthcare category
Project: Cepha
Team Cepha created an early detection platform for Parkinson’s disease utilizing smartphone sensor data.
|
 |
Intelli-Sense, India
Healthcare category
Project: Vision – the Blind Assist
The solution seeks to aid difficulties faced by blind individuals in understanding their surroundings in situations such as walking through a road or reading a book. The solution’s main goal is to provide a sense of vision to the visually impaired.
|
 |
REWEBA, Kenya
Healthcare category
Project: REWEBA (Remote Well Baby)
The team’s solution is an early warning system that digitally monitors growth parameters of babies and sends data to doctors remotely for timely intervention. It combines a variety of technologies to provide innovative functionalities for infant screening.
|
 |
Assurance Team, United States
Lifestyle category
Project: Assurance – Re(Imagine) Safety
Team Assurance created a proactive and affordable system to prevent mass shootings. It works by scanning the aggregate input from security camera feeds for firearms and alerts all parties it needs to alert as soon as a firearm is detected. The system is fully extensible and is able to run on low-cost hardware.
|
 |
DataMasker, China
Lifestyle category
Project: WellMask
WellMask is an Artificial Intelligence social mask based on semantic extraction & symbol communication. The team hopes to solve the problems of inefficient communication and high social threshold caused by masks, so that masks are no longer synonymous with isolation.
|
 |
Threeotech, Thailand
Lifestyle category
Project: JustSigns
JustSigns is a web application for content creators to create sign language captions to improve media accessibility for hard-of-hearing viewers.
|
 |
Follow these teams’ journeys on Instagram and Twitter as they advance to the next round of the World Finals. Four winning teams will be selected, taking home USD10,000 and Azure credits. These teams will also move forward to the World Championship for the chance to win USD75,000 and mentorship with Microsoft CEO, Satya Nadella. Two runner-up teams in each category will take home USD2,500 plus Azure credits. Good luck to all our competitors!
by Contributed | Mar 25, 2021 | Technology
This article is contributed. See the original author and article here.
this blog post we will provide Microsoft Azure Sentinel customers with hunting queries to investigate possible on-premises Exchange Server exploitation and identify additional attacker IOCs (Indicators of compromise) such as IP address and User Agent. These hunting techniques can also be applied to web shell techniques targeting other web applications.
The techniques we discuss below have been adapted from the June 2020 blog post: Web shell threat hunting with Azure Sentinel and Microsoft Threat Protection. The previous blog post analysed an attack against a SharePoint server, however, many of the techniques can also be applied to Exchange servers since it also uses IIS to host its web interfaces.
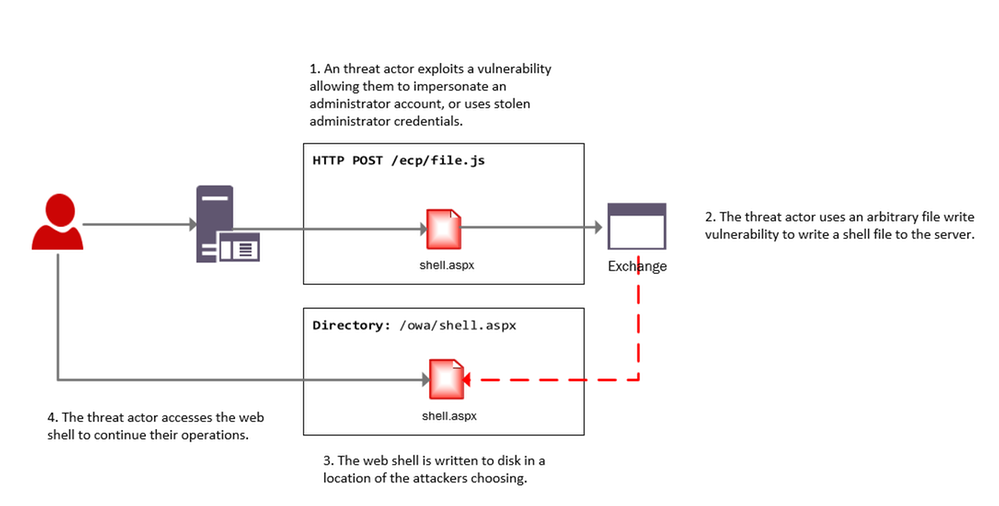
Recent vulnerabilities in on-premises Microsoft Exchange servers have led to deployment of web shells by threat actors. More information on these vulnerabilities can be found in this MSRC blog, details on threat actor HAFNIUM using these vulnerabilities can be found in this MSTIC blog. MSRC has also provided guidance for responders, a one-click tool for remediation and automatic remediation is delivered through Microsoft Defender for Endpoint.
Our colleagues in Microsoft Defender Threat Intelligence have authored another blog that provides additional details on use of web shells in attacks taking advantage of the Exchange Server.
The below diagram provides a high-level overview of an attacker leveraging these vulnerabilities to install a web shell on an Exchange server.
Investigating web shell alerts
Microsoft 365 Defender (M365D) detects web shell installation and execution activity. Security alerts and incidents generated by M365D can be written to the SecurityAlert table in Azure Sentinel by enabling the appropriate connector. An example of a web shell installation alert in the Azure Sentinel SecurityAlert table can be seen below.

These alerts can be enriched in Azure Sentinel with new information from other log sources. When dealing with remote attacks on web application servers, one of the best enrichment sources available are the web logs that have been generated. In the case that the application server is Microsoft Exchange the W3CIISLog can be used to enrich M365D alerts with potential attacker information. Information on collecting IIS logs using the Log Analytics agent can be found here.
Identifying the Attacker IP address from Microsoft 365 Defender alerts
The query below extracts alerts from M365D where a web script file has been observed as part of the alert. In the below example, alerts containing ASP, ASPX, ASMX and ASAX files will be extracted; these are web script files commonly used by Exchange servers.
After extracting relevant web shell alerts the query will join the alert information with the W3CIIS log, this allows the query to identify any clients that have accessed the potential shell file, allowing the potential attacker to be identified. A version of the query below is already available as an Azure Sentinel detection and can be found here.
let timeWindow = 3d;
//Script file extensions to match on, can be expanded for your environment
let scriptExtensions = dynamic([".asp", ".aspx", ".asmx", ".asax"]);
SecurityAlert
| where TimeGenerated > ago(timeWindow)
| where ProviderName == "MDATP"
//Parse and expand the alert JSON
| extend alertData = parse_json(Entities)
| mvexpand alertData
| where alertData.Type == "file"
//This can be expanded to include more file types
| where alertData.Name has_any(scriptExtensions)
| extend FileName = tostring(alertData.Name), Directory = tostring(alertData.Directory)
| project TimeGenerated, FileName, Directory
| join (
W3CIISLog
| where TimeGenerated > ago(timeWindow)
| where csUriStem has_any(scriptExtensions)
| extend splitUriStem = split(csUriStem, "/")
| extend FileName = splitUriStem[-1]
| summarize StartTime=min(TimeGenerated), EndTime=max(TimeGenerated) by AttackerIP=cIP, AttackerUserAgent=csUserAgent, SiteName=sSiteName, ShellLocation=csUriStem, tostring(FileName)
) on FileName
| project StartTime, EndTime, AttackerIP, AttackerUserAgent, SiteName, ShellLocation
Identifying Exchange Servers & Associated Security Alerts
Exchange servers can be challenging to identify in default log data; however using data available in W3CIISLog, Exchange servers can be identified using predictable URI strings without relying on the hostname or site name.
The query below extracts the host name from W3CIISLog where a known Exchange URI path is observed, this provides a list of hostnames that are running Exchange. This list of host names can then be used to aggregate information from the alerts in the SecurityAlert table.
W3CIISLog
| where csUriStem has_any("/owa/auth/", "/ecp/healthcheck.htm", "/ews/exchange.asmx")
| summarize by computer=tolower(Computer)
| join kind=leftouter (
SecurityAlert
| extend alertData = parse_json(Entities)
| mvexpand alertData
| where alertData.Type == "host"
| extend computer = iff(isnotempty(alertData.DnsDomain), tolower(strcat(tostring(alertData.HostName), "." , tostring(alertData.DnsDomain))),tolower(tostring(alertData.HostName)))
| summarize Alerts=dcount(SystemAlertId), AlertTimes=make_list(TimeGenerated), AlertNames=make_list(AlertName) by computer
) on computer
| project ExchangeServer=computer, Alerts, AlertTimes, AlertNames

The results of the query provide insights into whether additional security alerts beyond web shell alerts have been observed on the host. Following deployment of a web shell it’s highly likely the threat actor will begin to execute further commands on the server, triggering additional alerts. In the above example three Exchange servers were observed with security alerts.
This same technique can be used to locate other web applications within the network that use common or predictable web paths.
W3CIISLog Analysis
W3CIISLog provides detailed logging on actions performed on Microsoft Internet Information Servers (IIS). Even when an Endpoint detection alert is not available, it is possible to explore W3CIISLogs for indicators of compromise. W3CIISLog can also provide additional insights into which hosts in the network are web application servers.
Note: As part of the original Microsoft HAFNIUM blog post, several hunting and detection queries were created to search for artefacts specific to the use of recent vulnerabilities.
Identifying generic exploitation activity
If the URI associated with the vulnerable file on the server is known, a query can be constructed to identify log entries that match the URI pattern. W3CIIS logging stores the URI in the column named “csUriStem”, the below query can be used to search for a specific URI in logs and provide information on which clients have accessed them. Local IP addresses have been removed.
W3CIISLog
| where TimeGenerated > ago(3d)
| where not(ipv4_is_private(cIP))
//Insert potentially exploited URI here
| where csUriStem =~ "/owa/auth/x.js"
| project TimeGenerated, sSiteName, csMethod, csUriStem, sPort, cIP, csUserAgent

For HAFNIUM attacks observed by MSTIC an indicator feed has been made available (CSV, JSON). A detection query, that will check for the presence of indicators in multiple data sources, has also been made available by the Azure Sentinel team. The detection can be found here, and IOC’s released as feeds by MSTIC can be found in this directory.
The recent Exchange vulnerabilities do not need to be targeted at a specific file. Analysis of automated exploitation tools online shows that many randomise the filenames used; this means that no legitimate user will visit these files as they do not exist on the server. As these filenames are randomly generated, static string matching cannot be used.
The Kusto “matches_regex” function can be used to perform regular expression matching on URI’s. The below example extracts events where the URI matches files associated with the exploitation of CVE-2021-27065 from W3CIISLog.
W3CIISLog
| where TimeGenerated > ago(3d)
| where not(ipv4_is_private(cIP))
| where (csUriStem matches regex @"/owa/auth/[A-Za-z0-9]{1,30}.js") or (csUriStem matches regex @"/ecp/[A-Za-z0-9]{1,30}.(js|flt|css)")
| project TimeGenerated, sSiteName, csMethod, csUriStem, sPort, cIP, csUserAgent

The previous queries can be limited when the files being exploited are commonly accessed. They would produce many candidate attacker IP addresses, making analysis challenging.
Microsoft has seen malicious automated tools released publicly that are being used to exploit the Exchange vulnerabilities. These tools are designed to only visit specific URIs on the server that are required to perform the exploit. This activity differs from normal and legitimate Administrator or User application browsing activity and if observed should be investigated.
It is possible to craft a query that uses basic statistical analysis to identify instances where a client has visited a disproportionately high number of exploit-related URI’s when compared to other URIs on the site., The query below calculates the total number of suspicious URIs that have been visited by each user, it then calculates the total number of URIs visited by the user. Where the number of exploit related URIs is a significant proportion of URIs visited, a result is returned. default, the query requires over 90% of the URIs visited by the user to be suspicious.
let timeRange = 7d;
//Calculate number of suspicious URI stems visited by user
W3CIISLog
| where TimeGenerated > ago(timeRange)
| where not(ipv4_is_private(cIP))
| where (csUriStem matches regex @"/owa/auth/[A-Za-z0-9]{1,30}.js") or (csUriStem matches regex @"/ecp/[A-Za-z0-9]{1,30}.(js|flt|css)") or (csUriStem =~ "/ews/exchange.asmx")
| extend userHash = hash_md5(strcat(cIP, csUserAgent))
| summarize susCount=dcount(csUriStem), make_list(csUriStem), min(TimeGenerated), max(TimeGenerated) by userHash, cIP, csUserAgent
| join kind=leftouter  (
//Calculate unique URI stems visited by each user
W3CIISLog
| where TimeGenerated > ago(timeRange)
| where not(ipv4_is_private(cIP))
| extend userHash = hash_md5(strcat(cIP, csUserAgent))
| summarize allCount=dcount(csUriStem) by userHash
) on userHash
//Find instances where only a common endpoint was seen
| extend containsDefault = iff(list_csUriStem contains "/ews/exchange.asmx", 1, 0)
//If we only see the common endpoint and nothing else dump it
| extend result = iff(containsDefault == 1, containsDefault+susCount, 0)
| where result != 2
| extend susPercentage = susCount / allCount * 100
| where susPercentage > 90
| project StartTime=min_TimeGenerated, EndTime=max_TimeGenerated, AttackerIP=cIP, AttackerUA=csUserAgent, URIsVisited=list_csUriStem, suspiciousPercentage=susPercentage, allUriCount=allCount, suspiciousUriCount=susCount
While this query is designed to detect recent Exchange exploit activity, it can be easily adapted to other exploit chains if the pages or URIs used are known.
Rare Client File Access
A previously published hunting query can be used to detect instances where resources on a server are requested by a single client – a behaviour that should be investigated in the context of web shell exploits. After the actor creates web shell on the server, it’s likely that they will be the only user to access the file to complete their intended objective.
Investigating the Attacker
In the previous blog post covering SharePoint exploitation, a Jupyter Notebook Guided Investigation is provided. This notebook can also be used to investigate on-prem Exchange compromises within your environment.
The notebook extracts alerts from Microsoft 365 Defender related to web shell activity, these can then be enriched with information from W3CIIS to identify the attacker IP and User Agent. The attackers IP and User Agent can be used to hunt through multiple log sources for potential post-compromise activity.
After the attacker details have been identified, the notebook can be used to locate files that were accessed by the attacker prior to the web shell being installed. The notebook will also locate the first instance that the attacker visited the server.
Azure-Sentinel-Notebooks/Guided Investigation – MDE Webshell Alerts.ipynb at master · Azure/Azure-Sentinel-Notebooks (github.com)
Instructions for getting the notebook up and running can be found in the original blog post, under the title “Building out the Investigation using Jupyter Notebooks”.
You can stay up to date with the latest information at https://aka.ms/exchangevulns.
by Contributed | Mar 25, 2021 | Technology
This article is contributed. See the original author and article here.
Today we begin the rollout of Windows release health to the Microsoft 365 admin center. Windows and Microsoft 365 IT admins now have easy, integrated access to essential information about monthly quality and feature updates, the latest features and enhancements for IT, servicing milestones, and lifecycle updates. The Windows release health experience on the admin center also offers insights into known issues, workarounds, and resolutions related to Windows updates. This will be a phased rollout and we expect this information experience to be available to all applicable customers by the end of April.
As we announced at Microsoft Ignite 2021, our goal is inform you about known issues and give you the information you need to roll out Windows feature updates and monthly quality updates effectively and without end user disruption. We also want to ensure that you have early awareness of policy changes, new resources, deprecations, and advisories.
In order to access Windows release health in the admin center, you will need an applicable Microsoft 365[1] or Windows[2] licensing subscription, and to have the role of Service support admin for your tenant.
To find Windows release health in the Microsoft 365 admin center, visit https://admin.microsoft.com, log in, and scroll down to Health in the navigation menu. Windows release health will be listed underneath the existing Service health menu option.
In addition, you can also see Windows-related notifications in the Message center and customize your notification preferences just as you would for any other product or service in the Microsoft 365 admin center. If you do not automatically see these messages once Windows release health appears in your Health menu, select Message center and then Preferences. Once in the Preferences pane, select Microsoft Windows in the Custom View tab.
You can also opt in to receive a weekly digest via email for Windows-related updates posted to the Message center by selecting the Email tab in Preferences. Select the box for Microsoft Windows and the box for Send me a weekly digest about services I select. You can enter up to two additional email addresses to receive those notifications. For more information about how to use the Message center, see Manage messages in Message center.
What does Windows release health in the admin center provide?
For IT admins managing complex Windows environments, the public Windows release health hub and known issues pages (example) provide an authoritative place to check for known issues, safeguard holds, servicing announcements, and important reminders.
At this point, you might be asking: Will the Windows release health content published on the Microsoft 365 admin center be different? The answer is yes. Because the admin center is specifically designed for IT admins, you will find greater technical detail about known issues, earlier reminders about important milestones like end of service, and more resources to help you plan for and deploy Windows updates. Our goal is to help you diagnose issues in your environment fast, provide steps to mitigate them quickly, and provide a root cause analysis for better support.
For further guidance on how to navigate Windows release health on Microsoft 365 admin center, see How to check Windows release health.
If you are not familiar with the Microsoft 365 admin center, and its ability to make it easier for you to manage applications, services, data, devices, and users across your Microsoft 365 services, see About Microsoft 365 admin center.
[1] Requires Microsoft 365 Enterprise E3/A3/F3 or Microsoft 365 Enterprise E5/A5
[2] Requires Windows 10 Enterprise E3/A3 or Windows 10 Enterprise E5/A5

by Contributed | Mar 25, 2021 | Technology
This article is contributed. See the original author and article here.
One of the performance projects I’ve focused on in PostgreSQL 14 is speeding up PostgreSQL recovery and vacuum. In the PostgreSQL team at Microsoft, I spend most of my time working with other members of the community on the PostgreSQL open source project. And in Postgres 14 (due to release in Q3 of 2021), I committed a change to optimize the compactify_tuples function, to reduce CPU utilization in the PostgreSQL recovery process. This performance optimization in PostgreSQL 14 made our crash recovery test case about 2.4x faster.
The compactify_tuples function is used internally in PostgreSQL:
- when PostgreSQL starts up after a non-clean shutdown—called crash recovery
- by the recovery process that is used by physical standby servers to replay changes (as described in the write-ahead log) as they arrive from the primary server
- by VACUUM
So the good news is that the improvements to compactify_tuples will: improve crash recovery performance; reduce the load on the standby server, allowing it to replay the write-ahead log from the primary server more quickly; and improve VACUUM performance.
In this post, let’s walk through the change to compactify_tuples, how the function used to work, and why the newly-rewritten version in Postgres 14 is faster.
Profiling the recovery process highlighted a performance problem
In PostgreSQL, the write-ahead log (called the WAL) contains sets of records with instructions and data to go with the instructions. These WAL records describe changes which are to be made to the underlying data. WAL is used to make sure each change to the data is durable in the event that PostgreSQL stops running before the underlying data is written to disk. When PostgreSQL restarts after a shutdown, all of the WAL since the last checkpoint must be replayed as part of the recovery process. The WAL is replayed in order, to reapply changes to pages which may not have been written out to disk before the database shutdown.
We did some profiling of the PostgreSQL recovery process after purposefully crashing the database after running a benchmark of an UPDATE-heavy, OLTP type workload. These profiles showed that much of the CPU load was coming from the replay of “HEAP2 CLEAN” WAL records. HEAP2 CLEAN records defragment pages in tables to remove free space left by dead tuples. HEAP2 CLEAN records are added to WAL whenever the page becomes full and more space is needed on the page.
A tuple is PostgreSQL’s internal representation of a row in a table. A single row may have many tuples representing it, but only one of these tuples will be applicable at any single point in time. Older running transactions may require access to older versions of the row (another tuple) so they can access the row as it was at the point in time when the transaction started. UPDATEs to rows cause new versions of the tuple to be created. Creating multiple versions of each row in this way is called multi-version concurrency control (MVCC.)
Removing unused space from heap pages
To understand what HEAP2 CLEAN does in PostgreSQL, we’ll need to peer into the heap page format. Let’s look at a typical (simplified) heap page with some tuple fragmentation:
 Figure 1: A PostgreSQL heap page with fragmentation due to removed tuples
We can see that after the page header comes an array of “items.” The items act as pointers to the start of each tuple. PostgreSQL writes tuples to the page starting at the end and works backwards. The page is full when the item array and tuple space would overlap.
You should also notice that the tuples at the end of the page are not exactly in the reverse order of the item pointers. Tuples 2 and 3 appear out of order here. Tuples can become out of order after some records have been updated in the page and an old item pointer gets reused.
We can also see that that there’s quite a bit of unused space on the page in figure 1. The unused space is due to VACUUM removing tuples. The HEAP2 CLEAN operation will get rid of this unused space.
In PostgreSQL 13 and earlier, the HEAP2 CLEAN operation would turn the above into:
 Figure 2: A defragmented heap page in PostgreSQL before the performance improvement in PostgreSQL 14 that speeds up the recovery process and VACUUM.
We can see that the empty space is gone and the tuples are now pushed up to the end of the page. Notice the tuples remain in the same order as they were, with tuples 2 and 3 remaining in the same swapped order.
How heap page compactification used to work, prior to PostgreSQL 14
The compactify_tuples function takes care of the page compactification operation for us. All the changes made are in the compactify_tuples function. Before this change, the compactify_tuples function would perform a sort on a copy of the items array. This sort allowed the tuples to get moved starting with tuples at the end of the page. In this case, the tuples are moved starting with tuple1, followed by tuple3, tuple2 and tuple4. To determine which tuples to move first, compactify_tuples used the generic C qsort function with a custom comparator function. Sorting the item array in reverse tuple offset order allowed the tuples to be moved starting at the tuples at the end of the page.
Since heap pages can contain up to a few hundred tuples, and due to how often pages can be compactified in UPDATE-heavy workloads, the qsort call could use a lot of CPU. The sort overhead was not as bad with pages just containing a few tuples.
Do we really need to sort? … Well, yes and no. If we moved tuples in item array order and didn’t sort, then we could overwrite tuples later in the page. For example, in figure 2, if we moved tuple2 toward the end of the page before moving tuple3, then we’d overwrite tuple3. When moving the tuples in-place like this, we must make sure we move tuples at the end of the page first. So, we must sort when doing this in-place move.
How to make HEAP2 CLEAN faster?
To speed up the page compactification done during HEAP2 CLEAN, we could have written a custom qsort function which inlines the comparator function. Creating a custom qsort would have reduced some function call overhead, but, no matter what we did, qsort would still average an O(n log n) complexity. It would be nice to get rid of the sort completely.
The qsort is only required so that we don’t overwrite any yet-to-be-moved tuples. So, instead of sorting, we could instead copy those tuples to a temporary in-memory buffer, that way the order we move the tuples does not matter.
The new version of compactify_tuples in PostgreSQL 14 completely eliminates the need to use qsort. Removing the sort allows us to move tuples to the end of the page in item-array order. The temporary in-memory buffer removes the danger of tuples being overwritten before they’re moved and also means that the tuples are put back in the correct order with the first tuple at the end of the page.
The new heap page format, after compactification in PostgreSQL 14, looks like this:
 Figure 3: A newly compactified heap page after the performance improvement in PostgreSQL 14.
Notice that tuples 2 and 3 have now swapped places and the tuples are now in backwards item array order.
The new Postgres 14 code is further optimized by having a pre-check to see if the tuples are already in the correct reverse item pointer offset order. If the tuples are in the correct order, then there is no need to use the temporary buffer. We then move only tuples that come earlier (working backwards) in the page than the first empty space. The other tuples are already in the correct place. Also, now that we put the tuples back into reverse item pointer order again, we hit this pre-sorted case more often. On average, we’ll only move half the tuples on the page. New tuples which generate a new item pointer will also maintain this order for us.
Having the tuples in reverse item order may also help some CPU architectures prefetch memory more efficiently than if the tuples were in a random order in the page.
How much faster is the recovery process now in PostgreSQL 14?
My test case used a table with two INT columns and a “fillfactor” of 85 with 10 million rows. Accounting for the tuple header, this allows a maximum of 226 tuples to fit on each 8 kilobyte page.
To generate some WAL to replay, I used pgbench, a simple benchmarking program that comes with PostgreSQL, to do 12 million UPDATEs to random rows. Each of the 10 million rows will receive an average of 12 updates. I then did an unclean shutdown of PostgreSQL and started it back up again, forcing the database to perform crash recovery. Before the performance improvement, crash recovery took 148 seconds to replay the 2.2 GB of WAL.
The new version of the compactify_tuplescode took the same test 60.8 seconds. With this change and the given test case, PostgreSQL’s crash recovery became about ~2.4x faster.
|
Before the change to compactify tuples |
After the change to compactify tuples |
Performance impact of compactify tuples change |
Time to replay a
2.2 GB WAL as part of crash recovery |
148 sec |
60.8 sec |
~2.4X faster |
Previously, before the compactify_tuples change, pages with large numbers of tuples were the slowest to compactify. This was due to the qsort taking longer with large arrays. After changing compactify_tuples the performance is much more consistent with varying numbers of tuples on the page. The change does still result in a small speedup on pages even with very few tuples per page. However, the change helps the most when the number of tuples per page is large.
VACUUM performance also improved in PostgreSQL 14
VACUUM (and autovacuum) happens to make use of the same code after they remove dead tuples from a heap page. So, speeding up compactify_tuples also means a nice performance improvement for vacuum and autovacuum, too. We tried performing a VACUUM of the table updated my benchmark from earlier and saw that VACUUM now runs 25% faster in PostgreSQL 14 than it did before the compactify_tuples change. Previously it took 4.1 seconds to VACUUM the table and after the change that time went down to 2.9 seconds.
Speeding up the recovery process also means that physical standby servers are more likely to keep up pace and replay the primary’s WAL as quickly as it is being generated. So making this change to compactify_tuples also means that standby servers are less likely to lag behind the primary.
So the recovery process and vacuum will be faster in PostgreSQL 14—and there’s more work in progress, too
The change to compactify_tuples does help improve the performance of the recovery process in many cases. However, it’s also common for the recovery process to be bottlenecked on I/O rather than CPU. When recovering databases which are larger than the system’s available RAM, recovery must often wait for a page to be read from disk before any changes can be applied to it. Luckily, we’re also working on a way to make the recovery process pre-fetch pages into the kernel’s page cache so the physical I/O can take place concurrently in the background rather than having the recovery process wait for it.
For those of you who want an even bigger peek into how Postgres development happens, you can subscribe to any of the Postgres mailing lists. The PostgreSQL mailing list archives are also searchable. And if you want to learn even more about this compactify_tuples performance fix, here is the text of the actual commit to PostgreSQL 14, plus a link to the discussion on this optimization topic on the pgsql-hackers mailing list.
Author: David Rowley <drowley@postgresql.org>
Date: Wed, 16 Sep 2020 01:22:20 +0000 (13:22 +1200)
commit 19c60ad69a91f346edf66996b2cf726f594d3d2b

Optimize compactify_tuples function

This function could often be seen in profiles of vacuum and could often
be a significant bottleneck during recovery. The problem was that a qsort
was performed in order to sort an array of item pointers in reverse offset
order so that we could use that to safely move tuples up to the end of the
page without overwriting the memory of yet-to-be-moved tuples. i.e. we
used to compact the page starting at the back of the page and move towards
the front. The qsort that this required could be expensive for pages with
a large number of tuples.

In this commit, we take another approach to tuple compactification.

Now, instead of sorting the remaining item pointers array we first check
if the array is presorted and only memmove() the tuples that need to be
moved. This presorted check can be done very cheaply in the calling
functions when the array is being populated. This presorted case is very
fast.

When the item pointer array is not presorted we must copy tuples that need
to be moved into a temp buffer before copying them back into the page
again. This differs from what we used to do here as we're now copying the
tuples back into the page in reverse line pointer order. Previously we
left the existing order alone.  Reordering the tuples results in an
increased likelihood of hitting the pre-sorted case the next time around.
Any newly added tuple which consumes a new line pointer will also maintain
the correct sort order of tuples in the page which will also result in the
presorted case being hit the next time.  Only consuming an unused line
pointer can cause the order of tuples to go out again, but that will be
corrected next time the function is called for the page.

Benchmarks have shown that the non-presorted case is at least equally as
fast as the original qsort method even when the page just has a few
tuples. As the number of tuples becomes larger the new method maintains
its performance whereas the original qsort method became much slower when
the number of tuples on the page became large.

Author: David Rowley
Reviewed-by: Thomas Munro
Tested-by: Jakub Wartak

by Contributed | Mar 25, 2021 | Technology
This article is contributed. See the original author and article here.
For the next four weeks MidDay Café is moving to an Open Q&A format. Have questions around Microsoft Teams voice, Viva, SharePoint, Teams administration, and more? Bring ‘em to MidDay Café and let’s get those questions answered. In addition to Open Q&A the MidDay Café crew will have the weekly news, upcoming events, plus some surprise tips and tricks!
Join us Monday’s 3/29, 4/5, 4/12, and 4/19 for MidDay Café Open QA Sessions.
MidDay Café Open QA Sessions Agenda:
- Welcome and Introductions.
- Mid-Day Café News and Events
- Tips and Tricks of the Week.
- Open Q&A
- Wrap Up
For the Event:
Keep up to date with MidDay Café:
Thanks for visiting – Michael Gannotti LinkedIn | Twitter
 Michael Gannotti

Recent Comments