
by Contributed | Mar 26, 2021 | Technology
This article is contributed. See the original author and article here.
What is Microsoft Graph Explorer

Microsoft Graph offers us a single endpoint https://graph.microsoft.com to access data in Microsoft 365, Windows 10, and Enterprise Mobility and Security and can be used by makers and developers. To get started to use the Graph API, the Graph Team offers us a very fantastic tool called Graph Explorer.
What does it do? Well, it lets us explore Graph! It’s a learning playground where we can try out requests, get responses, learn about permission scopes, and more. To access Graph Explorer, visit aka.ms/ge and make yourself familiar with it:

Authentication
You can decide if you want to sign in or if you want to try out with sample data provided by Microsoft. I recommend ‘playing’ in your developer tenant; if you don’t have one, learn here how to join the Microsoft 365 developer program and get a developer tenant. The benefit of signing in with your (developer) account is, that you can execute all requests including POST and DELETE requests, which is not possible in the sample account.
When you click the gear icon, you will find a shortcut to the Microsoft 365 developer program website (to get your sandbox with sample data), and you can change the theme as it suits your needs best. I like dark mode most :black_heart:.

Sample queries
You will find sample queries below authentication – some may be disabled if you are not logged in. If you click on a sample, like I did in the screenshot below, Graph Explorer will send this HTTP request to Microsoft Graph – and get my joined teams. We can see this in the request area (upper part) and the response area (lower part):

We now want to create a channel called ‘Microsoft Graph’ in the Team ‘Insidious Word Domination Plans’. We first copy the ID of the Team from the response of that request and then use this ID in the next sample we try out, which is:

We then replace the `{teams-id}` placeholder with the copied ID value from the previous request and change the body to our needs:

In the **Modify permissions** tab, we can learn about – and consent to permissions needed to execute this request:

But the awesomeness of this tool doesn’t stop here – we get ready-to-use code snippets in different languages to insert them into our applications:

And for some GET requests, we even get Adaptive Cards:

We can also try out Microsoft Graph Toolkit components right here, although I would personally recommend doing this in the dedicated Microsoft Graph Toolkit Playground. If you are unfamiliar with Microsoft Graph Toolkit, you can read how I started to use it – in my blog series about MGT – I also recommend having a look at the beautiful [Microsoft Graph component](https://developer.microsoft.com/en-us/graph/components ) browser.
Last but not least: Documentation to every sample is nicely tied in – click on the pop-out icon next to the sample queries:

How does Graph Explorer help building apps?
I use Microsoft Graph in Power Apps with custom connectors or in Power Automate and Azure Logic Apps with the HTTP action to execute actions that are not present (yet). If you never did that but want to learn about it, here are two blog posts that will get you started:
* How to use a custom connector
* How to get started with HTTP requests in Power Automate
To get from the rough idea to a working up, I follow this process:
- Read the docs. I mean, seriously. learn, which endpoint you will need to call, which permissions you will need.
- Try out in Graph Explorer; when it works, proceed to step 3, in case it doesn’t, go back to step 1 :’)
- Register your application in Azure AD with the permission scope that was needed for the request in Graph Explorer
- Try out the flow/the action of your custom connector in a basic sample flow/app.
- Now replace all hard-coded values like a Teams ID with Dynamic Content from within your flow
You see, Graph Explorer is an amazing tool to learn and try out – it gets you a step closer to a working solution, but you do not need to worry upfront about app registration, permissions etc. It’s a cool way to do a proof of concept – trying out if you can get, post, patch, update or delete the resources you like to before you start building your app.
Feedback and what’s next?
I am curious – which other tools help you developing with Microsoft Graph? Recently, Elio Struyf published a VSCode extension, that auto-completes Graph URLs for you, read more about it here. Also, please share below what you build with Microsoft Graph? And how you use Graph Explorer? If you like to contribute, you can check out Graph Explorer on GitHub. I am looking forward to your feedback!
❤ Sharing is Caring
by Contributed | Mar 26, 2021 | Technology
This article is contributed. See the original author and article here.
The following two procedures guide on how to collect traces of exceptions when the application is not using a logging or telemetry solution – such as Application Insights – to record those exceptions. This post complements my article about how exceptions are handled and how to collect memory dumps to study them.
Both tools below – ProcDump and DebugDiag – work similarly: they can attach themselves as debuggers to a process, then monitor and log exceptions for that process. Optionally, these tools can collect a memory dump for the monitored process under certain conditions – such as when specific exceptions occur.
Both tools need administrative rights to be run.
DebugDiag is the preferred tool, since it automates some steps, adds more explicit context, and includes automated memory dump analysis capabilities too. While ProcDump will report exceptions occurring, DebugDiag will also collect thread call stack information.
Using the command-line ProcDump
ProcDump does not require installation. But one needs to be specific about the PID to which it is attaching. That PID needs to be determined prior to starting ProcDump. This may be tricky when the respective process is crashing and restarting frequently, with a different PID; such as when Asp.Net apps are causing their w3wp.exe to crash and restart.
- Download the tool and copy it on a disk folder, for example D:Temp-Dumps
https://docs.microsoft.com/en-us/sysinternals/downloads/procdump
- Open an administrative console from where to run commands.
Navigate to the disk folder above (D:Temp-Dumps).
- Find the process ID, the PID, of the IIS w3wp.exe worker process executing your application.
Use the AppCmd IIS tool to list processes for application pools:
C:WindowsSystem32InetSrvappcmd.exe list wp
- Execute the following command to collect the traces:
D:Temp-Dumps> procdump.exe -accepteula -e 1 -f “” [PID]
You may want to redirect the console output of ProcDump to a file, to persist the recording of the encountered exceptions:
D:Temp-Dumps> procdump.exe -accepteula -e 1 -f “” [PID] > Monitoring-log.txt
Replace [PID] with the actual Process ID integer number identified at the step 2.
- Start reproducing: issue requests from the client (browser?) that you know it would trigger exception(s); usually, HTTP response “500, Server-side processing error“.
Or simply wait or make requests to the IIS/Asp.Net app until the exception(s) occur(s).
You should end up with a console output revealing the exceptions, or
a .TXT log with them in the location where ProcDump.exe was saved (example: D:Temp-Dumps).
Using the UI tool DebugDiag, Debug Diagnostics Collection
DebugDiag requires installation, but it is able to determine itself the whatever process instance – PID – happens to execute for an application pool at some point in time; even when that process may occasionally crash, hence restart with different PID.
1.
Download Debug Diagnostic and install it on IIS machine:
https://www.microsoft.com/en-us/download/details.aspx?id=49924 v2.2
https://www.microsoft.com/en-us/download/details.aspx?id=58210 v2.3
https://www.microsoft.com/en-us/download/details.aspx?id=102635 v2.3.1
2.
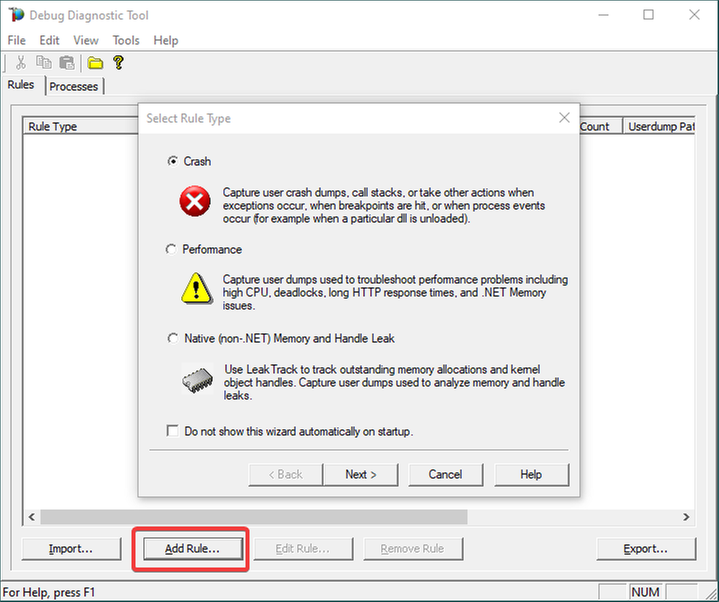
Open Debug Diagnostic Collection.
If a wizard does not show up, click Add Rule.
3.
Choose Crash and click Next.

4.
Choose “A specific IIS web application pool” and Next.

5.
Select the application pool which runs the problematic application and then click Next.

6.
The Unconfigured First-Chance Exceptions are the unknown ones that we want to determine…
Let’s Log Stack Trace for these; say the first 100 occurrences.
Lower the Maximum number of userdumps created by the rule to 1 (would only get a dump if we have a crash; but at this stage we’re not after dumps).
Then click Next…

7.
Configure the file location where the (potential) dump file(s) will be generated/written.
A dump would only be collected on crash, if it happens; otherwise, we should only have a text file as output: a monitoring log, where occurred first-chance exceptions are recorded.
Please note that a dump file is a snapshot of the process memory, written in disk; size will be similar to process memory as seen in the Task Manager.
For example, if you see that w3wp.exe uses around 5 GB of memory in Task Manager, then the dump of that process will be around 5 GB on the disk.
Please do not choose a disk in network/UNC; choose a local disk.

8.
Click Next and Finish by selecting to Activate the rule now.

9.
Unknown/Unconfigured first-chance exceptions will be recorded; therefore, revealed.
If the application pool’s w3wp.exe process would crash with an unhandled exception, we would also get a memory dump.
If dump is generated, archive in a ZIP and hand over to the support engineer or to the development team that should be aware of these exceptions.
Remember my article about how exceptions are handled and how to collect memory dumps to study them. We can double check if a crash occurred or not: read about w3wp.exe crashes.

by Contributed | Mar 26, 2021 | Technology
This article is contributed. See the original author and article here.
Create a read-only user on Azure SQL Server
Oscar Garcia is a Principal Software Architect who resides in South Florida. He is a Developer Technologies MVP and certified solutions developer with many years of experience building software solutions. He specializes in building cloud solutions using technologies like AWS, Azure, ASP.NET, NodeJS, AngularJS as well as BI projects for data visualization using tools like Power BI, Tableau and JMP. You can follow Oscar on Twitter @ozkary or his blog at ozkary.com

Windows Admin Center v2103 Available!
James van den Berg has been working in ICT with Microsoft Technology since 1987. He works for the largest educational institution in the Netherlands as an ICT Specialist, managing datacenters for students. He’s proud to have been a Cloud and Datacenter Management since 2011, and a Microsoft Azure Advisor for the community since February this year. In July 2013, James started his own ICT consultancy firm called HybridCloud4You, which is all about transforming datacenters with Microsoft Hybrid Cloud, Azure, AzureStack, Containers, and Analytics like Microsoft OMS Hybrid IT Management. Follow him on Twitter @JamesvandenBerg and on his blog here.

How to use “Definite Guide” for the new Microsoft Teams Breakout Rooms
Vesku Nopanen is a Principal Consultant in Office 365 and Modern Work and passionate about Microsoft Teams. He helps and coaches customers to find benefits and value when adopting new tools, methods, ways or working and practices into daily work-life equation. He focuses especially on Microsoft Teams and how it can change organizations’ work. He lives in Turku, Finland. Follow him on Twitter: @Vesanopanen

Teams Real Simple with Pictures: Hyperlinked email addresses in Lists within Teams
Chris Hoard is a Microsoft Certified Trainer Regional Lead (MCT RL), Educator (MCEd) and Teams MVP. With over 10 years of cloud computing experience, he is currently building an education practice for Vuzion (Tier 2 UK CSP). His focus areas are Microsoft Teams, Microsoft 365 and entry-level Azure. Follow Chris on Twitter at @Microsoft365Pro and check out his blog here.

C#.NET: HOW TO CONVERT LIST TO STRING ARRAY INSIDE LIST DATA TYPE
Asma Khalid is an Entrepreneur, ISV, Product Manager, Full Stack .Net Expert, Community Speaker, Contributor, and Aspiring YouTuber. Asma counts more than 7 years of hands-on experience in Leading, Developing & Managing IT-related projects and products as an IT industry professional. Asma is the first woman from Pakistan to receive the MVP award three times, and the first to receive C-sharp corner online developer community MVP award four times. See her blog here.
by Contributed | Mar 26, 2021 | Technology
This article is contributed. See the original author and article here.
One common characteristic of recent attacks is the attempt to evade detection by using different techniques. To evade security software and analyst tools, some malware will enumerate the target system looking for certain running processes, loaded drivers, and registry keys, with the goal of disabling them. When using a Cloud Workload Protection Platform (CWPP) such as Azure Defender, you will have different levels of threat detections according to the plan that you are using. The available plans are:
There are some scenarios in which the alert that you are receiving in Azure Defender could be a false positive for your environment. If you want to avoid receiving that specific alert, you can create an alert suppression rule. Although the alert suppression is a feature that can be used to optimize your experience, it can also be used with malicious intent in case a user wants to evade detection. To create or delete alert suppression rules, you need to be Security admin or Subscription Owner. If you just need to view the rules, you need to be Security reader or Reader.
Hardening Alert Suppression Creation
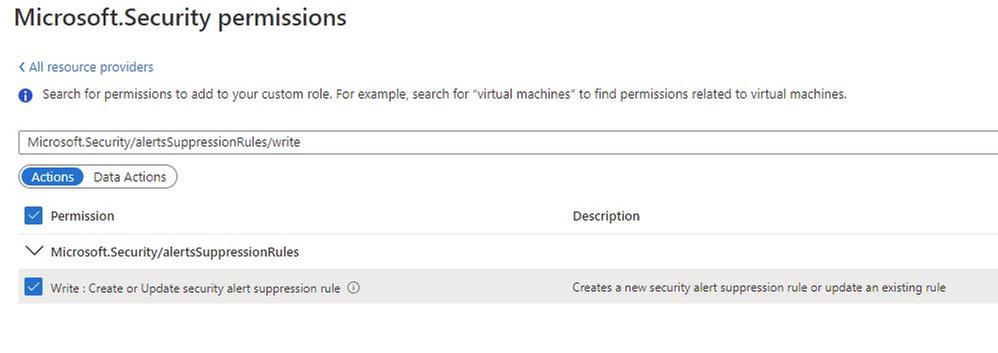
If you don’t want to give full Security Admin access to an individual but you still want that individual to create suppression rules, you should create a custom Azure Role with only the necessary privilege to do that. To be able to create alert suppression rules, the user must have the following privilege:
In addition, you should also give Reader role privilege to allow the user to see the alert suppression rules that exist.
Tracking changes to suppression rules
After hardening the privilege to create suppression rules, you can start tracking changes. To do that, you will use Azure Activity Log. The operation that has the alert suppression creation is shown below:

You can open this operation and look at the JSON tab to obtain more details. You will see the name of the rule that was created or modified, as shown in the example below:

At this point you can also create a new Alert rule in Azure Activity Log using the New alert rule option in the summary tab, as shown below:

To learn more about how to create alerts using Azure Activity Log, read this article. If you are ingesting Azure Activity Log in Azure Sentinel, you can also create an incident based on this operation.
Reviewer
Tal Rosler, Program Manager
by Contributed | Mar 26, 2021 | Technology
This article is contributed. See the original author and article here.
Today, I worked on a very interesting case that our customer is facing the following error message connecting to Azure SQL DB and/or Azure Managed Instance “Connection is not available, request timed out after ..”.
Following, I would like to share with you my lessons learned about why and how this error message is fired in two different situations:
- All the connections in the Hikari pooling are in use.
- The session limit for the database has been reached.
In order to review these two things, I included the Hikari connection pooling based on this article: Improve Java application reliability with Azure SQL Database using JDBC and connection pooling. – Microsoft Tech Community, and modifying the current Java code that you could find in this GitHub
My database is a standard 1 database that we have a session limit in 900. The first thing to probe my theory about the connection pooling is to configure setmaxiumpoolsize parameter to 50 and setCloseConnection to false to open this number of connections without closing any of them. In this situation, once I reached the connection number 51 I got the error message “Connection is not available”
    public static void main(String[] args) throws Exception{
        System.out.println("Testing connection JAVA! (Hikari)");
        ErrorClientHikari oErrorClient = new ErrorClientHikari();
                    oErrorClient.setCloseConnection(false);
                    oErrorClient.setReadingSQLData(false);
                    oErrorClient.setTotalIteractions(30000);
                    oErrorClient.setSQLReadToExecute("SELECT count(*) Id FROM PerformanceVarcharNVarchar where TextToSearch =N'Value'");
                    oErrorClient.setSQLCommandTimeout(30000);
                    oErrorClient.setServerName("servername.database.windows.net");
                    oErrorClient.setDatabaseName("dbname");
                    oErrorClient.setUserName("username");
                    oErrorClient.setPassword("password");
                    oErrorClient.setMaximumPoolSize(50);
                    oErrorClient.setConnectionTimeout(5000);
                    oErrorClient.LoadData();
In this similar situation, I’m going to modify the setmaxiumpoolsize parameter to 1000 to know what happen when I reached more connections that the session limit of my Azure SQL Database Standard 1. At this time, I got the same error message: “Connection is not available, request timed out after..” so, that means, that both situations will report the same error message.
    public static void main(String[] args) throws Exception{
        System.out.println("Testing connection JAVA! (Hikari)");
        ErrorClientHikari oErrorClient = new ErrorClientHikari();
                    oErrorClient.setCloseConnection(false);
                    oErrorClient.setReadingSQLData(false);
                    oErrorClient.setTotalIteractions(30000);
                    oErrorClient.setSQLReadToExecute("SELECT count(*) Id FROM PerformanceVarcharNVarchar where TextToSearch =N'Value'");
                    oErrorClient.setSQLCommandTimeout(30000);
                    oErrorClient.setServerName("servername.database.windows.net");
                    oErrorClient.setDatabaseName("dbname");
                    oErrorClient.setUserName("username");
                    oErrorClient.setPassword("password");
                    oErrorClient.setMaximumPoolSize(1000);
                    oErrorClient.setConnectionTimeout(5000);
                    oErrorClient.LoadData();
    }
Enjoy!

Recent Comments