by Contributed | Jan 7, 2021 | Technology
This article is contributed. See the original author and article here.
We are happy to announce the public preview availability of a new data source in Microsoft 365 Defender advanced hunting.
Two new tables for Azure Active Directory sign-ins are now available in advanced hunting:
Tables are visible for global roles assigned in Azure Active Directory only, as enforced by Azure Active Directory.
The tables are suffixed with “beta” because it is a short-term solution to help you quickly identify possible malicious sign-in events for investigation. In parallel to making this data available, we are working on a more robust and complete solution. We will share more details on that soon.
Here are some useful sample queries that can also help you understand how to use these new tables:
// Finds attempts to sign in to disabled accounts, listed by IP address
let timeRange = 14d;
AADSignInEventsBeta
| where  Timestamp >= ago(timeRange)
| where ErrorCode == ‘50057’  // The user account is disabled.
| summarize StartTime = min(Timestamp), EndTime = max(Timestamp), numberAccountsTargeted = dcount(AccountObjectId),
numberApplicationsTargeted = dcount(ApplicationId), accountSet = makeset(AccountUpn), applicationSet=makeset(Application),
numberLoginAttempts = count() by IPAddress
| extend timestamp = StartTime, IPCustomEntity = IPAddress
| order by numberLoginAttempts desc
// Users with multiple cities
// Gets a list of users that signed in from multiple locations in the last 24 hours
AADSignInEventsBeta
| where  Timestamp >= ago(1d)
| summarize CountPerCity = dcount(City), citySet = makeset(City) by AccountUpn
| where CountPerCity > 1
| order by CountPerCity desc
// Most active Managed Identities
// Gets list of the top 100 most active managed identities in the last 24 hours
AADSpnSignInEventsBeta
| where Timestamp > ago(1d)
| where IsManagedIdentity == True
| summarize CountPerManagedIdentity = count() by ServicePrincipalId
| order by CountPerManagedIdentity desc
| take 100
// Inactive Service Principals
// Gets list of service principals with no sign-ins in the last ten days
AADSpnSignInEventsBeta
| where Timestamp > ago(30d)
| where ErrorCode == 0
| summarize LastSignIn = max(Timestamp) by ServicePrincipalId
| where LastSignIn < ago(10d)
| order by LastSignIn desc
Note: Customers who can access Microsoft 365 Defender through the Azure Security Center’s integrated Microsoft Defender for Endpoint solution, but do not have licenses for any of Microsoft Defender for Office, Microsoft Defender for Identity, or Microsoft Cloud App Security, will not be able to view this schema.

by Contributed | Jan 7, 2021 | Technology
This article is contributed. See the original author and article here.
Join us January 21st at 11am eastern to learn about the Nursing Hackathon Delivered Innovative Solutions Designed to Reimagine Care Delivery.
The Reimagine Care Delivery Developer Challenge (virtual hackathon), presented by: Allscripts, MATTER, Microsoft and ARC (Sheba Medical Center) was held in December 2020 and the competition was stellar! The “entry solutions” were all designed to create the EHR of the future, to reduce the burden on nurses. Join 2 of the judges, Kathleen McGrow, RN, CNIO, Microsoft and Paul Minton, RN, VP Solutions Management, Allscripts, to hear about competition and the finalists. Also, joining the winner – DeepScribe (Matthew Ko, Co-founder and COO), to highlight how their innovative solution will be bringing the joy back to medicine!
To attend the webcast download the .ics calendar file below or click on the direct link on the date/time of the webcast.
Thanks for visiting – Michael Gannotti LinkedIn | Twitter
 Michael Gannotti
![[Call for Content] Become a Mixed Reality BizApps Guest Blogger!](https://www.drware.com/wp-content/uploads/2021/01/large-344)
by Contributed | Jan 7, 2021 | Technology
This article is contributed. See the original author and article here.
Call for Content: Mixed Reality BizApps Guest Bloggers
Happy new year, Mixed Reality Community!
If your 2021 new year resolution is to become a published guest blogger, here’s your chance! We’re looking for community guest bloggers to contribute exciting and inspiring stories about how you use Mixed Reality Business Applications like Dynamics 365 Remote Assist and/or Guides on HoloLens in your organization (or even personal life!).
Here are some starter questions that you can incorporate into your story:
- How did you get into the mixed reality space? (i.e did you have role models, did the community help you fit in etc)
- What is it about mixed reality that excites you?
- What do you think is the biggest misconception people have about mixed reality?
- How do you think mixed reality business apps can help positively impact the world and/or help solve key world issues?
- What advice would you give to someone aspiring to join this space? Any resources you can share?
Benefits of becoming a Mixed Reality Community guest blogger:
- Have your blog posts/stories count as community contribution towards MVP status
- Raise your profile within the Mixed Reality industry (and meet awesome peers in the process!)
- The best stories might even net you a speaking gig at our flagship/community events
- Watch this space for upcoming special raffles for you to have a chance at scoring some goodies!
Ready to dig in? Submit your story pitch at https://aka.ms/MRGuestBloggers today!
#MixedReality #GuestBloggers
by Contributed | Jan 7, 2021 | Technology
This article is contributed. See the original author and article here.
A common challenge for app developers, site reliability engineers (SREs), and DevOps engineers is that a synthetic availability test could fail while the application is still functioning perfectly. It can be extremely frustrating to identify if the root cause of the failure was due to your application or network issues.
Introducing the new Availability Troubleshooting Report
NOTE: The troubleshooting report is only available for URL ping tests.
The Troubleshooting Report is intended to help you understand why your customers may have problems accessing your application or alert you to potential issues while all metrics indicate it is healthy.
It can be accessed through the portal by selecting a test result from the scatter plot or Drill Into section. Each dependency will have an individual troubleshooting report attached.

If a step fails, then it will appear at the top of the availability result to give you instant insight into where the problem might be. If no step fails, then the troubleshooting report will be closed by default.
Common Test Failures & Potential Root Causes:

DNS lookup could fail because your record needs to be publicly available for the ping test to work.
If you need to test against a private DNS record, then use the TrackAvailability SDK. This enables you to run availability tests behind a firewall or in an isolated environment, expand your test region selection, and author more complex tests than are available in the portal UI.

Connection Failed indicates that there might be a firewall blocking our service from accessing your endpoints.
You can add the Application Insights Availability service tag to your Network Security Group (NSG) or Azure Firewall to allow only inbound traffic from our testing engine. Service tags will automatically update the list of allowed IP addresses for specific services, minimizing the complexity and need for updating network security rules. You can also whitelist by individual IP addresses.
If you need to run tests without allowing any traffic into your virtual network, then we recommend using the TrackAvailability SDK.

Status Code & Content Validation ensures your webpage has specific content available and that it sends the correct response code.
The application owners should be contacted to investigate why their page returns an incorrect code or is missing content.
See more:
Troubleshoot your Azure Application Insights availability tests – Azure Monitor | Microsoft Docs
by Contributed | Jan 7, 2021 | Technology
This article is contributed. See the original author and article here.
It’s been a few years since we blogged about this topic, so we thought we’d share a few updates with you. Below we’ve provided options and tips for you to consume new feature, service change, and service health notices for Microsoft Intune. Let us know what questions you have by replying on this post or asking us out on Twitter @IntuneSuppTeam.
Message center posts
Intune aligns to the Modern Lifecycle Policy and we communicate planned service changes through the Message center, such as:
New major features (communicated at release)
Changes to existing service behavior (typically communicated 30 days in advance)
Planned maintenance (at a minimum 5 days prior)
End of Support statements (if an entire service, typically a year; if an OS or large feature typically 90 day in advance)
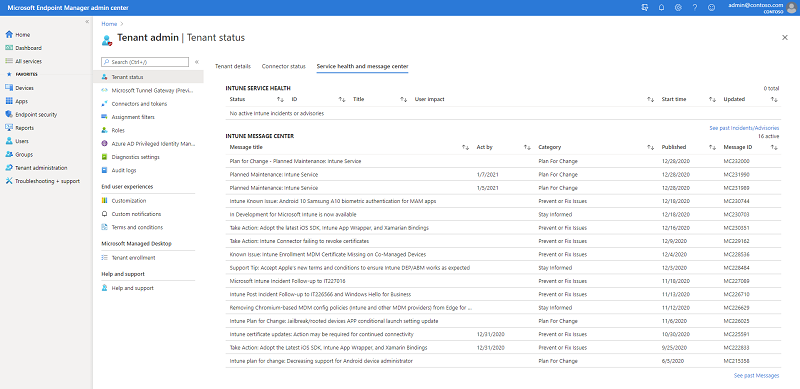
You can see all of your Intune Message center Posts in the Microsoft Endpoint Manager admin center on the tenant status blade. Here’s a screen shot from my Message center:
Screenshot of the MEM admin center – Service health and message center blade
We do our best to make sure that you only see Message center posts that affect your organization, particularly when there are changes that will affect a specific scenario. For example, the top message shown in the screen shot above – about Apple updating their T&C’s – went to customers with managed Apple devices. If the scope is broader or indeterminate, we’ll post to all customers and explain how you could be impacted in the “How does this affect my organization” section of the post.
If you are interested in other M365 service messages outside of Intune, then head to the M365 admin portal. It’s the same Intune messages posted there – we use the M365 service API’s to pull Intune messages from the M365 admin center to Endpoint Manager. Within the M365 admin portal, you can then set preferences for the messages you see – for example if you administer Exchange and Intune you can select both and view them in the M365 admin portal. We’ve linked from the Microsoft Endpoint Manager admin center on the tenant status blade to the M365 admin center to make it easy for you to go from one to the other without having to reauthenticate.
 Screenshot of the M365 admin center – Message center preferences pane
Message center FAQ:
Intune In development/What’s new
Intune also publishes a list of UI updates and features In development (expect to ship in the next monthly release) and in What’s new (what ships in the monthly service release). Items move from In Development to What’s New as we ship each release. There are times a feature gets pulled back into development after it ships or a feature misses our readiness documentation process. We work back with our PM and engineering teams to ensure the documentation and communication process is followed.
In Development/What’s New FAQ:
Does every What’s New item get it’s own Message center post? No, we do a single message center post to inform customers of the latest What’s New release where you can then go and read about each new feature. A good way to think about the distinction between the Message center and What’s New is that we prefer to use the Message center more for targeted service changes, especially where action may be required in a specific time period. New features are updated on What’s New.
I saw something on In Development but now it’s gone. What happened? Rarely items are pulled out of our pre-production, but it does happen from time-to-time. Or the item released and moved to What’s New.
How do I know when In Development/What’s New updates? Three options – follow @IntuneSuppTeam out on Twitter, check your Message center for a notice that they’ve been updated, or follow the docs RSS feed on those pages.
Service Health Dashboard
You can see service incidents for Intune over in Microsoft Endpoint Manager admin center. They are in the same spot as the Message center on the Tenant Administration > Tenant Status > Service health and Message center.
 Screenshot of the MEM admin center – Service health and message center blade
Service health notices will stay active on the Microsoft Endpoint Manager admin center for 5-7 days after the incident closed. Over in the M365 admin center, you can see archived notices for up to 30 days.
How to check Microsoft 365 service health – Microsoft 365 Enterprise | Microsoft Docs
Email notifications for Message Center and Service Health Dashboard posts
If you prefer to receive notifications via email, you can opt in through the M365 admin center. Navigate to the Service Health blade and click Preferences > Email and check the box to receive email notifications. Enter 1-2 email addresses that you’d like notifications to be sent to and select your preferences. You’ll likely want to pick advisories and incidents. You can read more on the distinction here: How to check Microsoft 365 service health – Microsoft 365 Enterprise | Microsoft Docs.
 Screenshot of the M365 admin center – Message center email preferences pane
For Message center posts, repeat these steps on the Message center blade. If you select the Send me a Weekly Digest > Microsoft Intune you’ll get a once-a-week summary of everything posted for Intune into your Message Center.
Note that email is a onetime setup and the only sign-up for Intune service change emails today is from the M365 admin center.
Using the M365 Admin app on your phone
You can see notices from the M365 Admin app. When you open the app, the Home page will automatically show the Health dashboard where you can tap into the Message center or Service Health notices. You can also access both Message center and Service health from the hamburger menu.
 M365 Admin app – Home screen
  M365 Admin app – Message center option
Turn on push notifications for both Service Health and Message center by going to Settings > Notifications and tapping the toggles to green for all notifications or tap the arrows next to each and turn on notifications for specific services or notices.
 M365 Admin app – Notifications screen
  M365 Admin app – Notifications screen
Office 365 Communications API
You can use Office 365 Communications API to access incident and message center posts from Microsoft Intune. The API relies on Azure Active Directory (Azure AD) and OAuth2 so you will need to register and configure your application within Azure AD before being able to access the API. The following steps will walk you through the process of registering your application and running the PowerShell script to call the API.
Navigate to the Azure Active Directory admin center.
Click Azure Active Directory > App registrations > New registration.
Fill out the fields and click Create. Copy the Application ID for later.
Note: Make sure Web is selected for URI, the domain will be used later.
 Azure Active Directory – Registering a new application
- Click on the newly created App > API Permissions > Add > Office 365 Management APIs.
 Adding the O365 Management API to the newly created app registration
- Click Delegated permissions and select “ServiceHealth.Read”, repeat with Application permissions and click “Add permissions”.
 Adding the ServiceHealth.Read permission to the newly created app registration
Next, click Certificates & secrets > New client secret > Enter name and select expiration > Add.
Copy the “Client secrets” Value for later.
 Certificates & Secrets – Highlighted Value
- Download and save this PowerShell script. Update with your tenant ID (How to find your Azure Active Directory tenant ID, application ID (step 3), and the Client secret value (step 6).
 Editing the PowerShell script to include tenant ID, app ID, and client secret
- Run the PowerShell script to receive all Intune related messages from the O365 admin center.
There are multiple ways to receive message center notices, whether it’s in the admin center, email, M365 app, or using the service API’s — choose the one that works best for you.
As always, we want to hear from you! If you have any suggestions, questions, or comments, just let us know through comments on this post or tagging @IntuneSuppTeam on Twitter.

Recent Comments