by Scott Muniz | Dec 11, 2020 | Security
This article was originally posted by the FTC. See the original article here.
It’s the 6th day of Consumer Protection, and maybe you’re in a giving spirit. ‘Tis the season, right? If you like to donate to charities at the end of the year, ‘tis also time to make sure your donations get to the places you mean them to go. Because this year, lots of charities could really use the help.
Brought to you by Dr. Ware, Microsoft Office 365 Silver Partner, Charleston SC.
by Contributed | Dec 11, 2020 | Technology
This article is contributed. See the original author and article here.
Azure Data Factory has enhanced the Azure Database for PostgreSQL, REST and Excel connectors to fulfill your emerging data integration need:
Azure Database for PostgreSQL in Data Flow
Now you can use Azure Database for PostgreSQL connector in Data Flow to build powerful ETL processes. You can read data directly from Azure Database for PostgreSQL and apply data transformations or join with other data, or post transformation you can perform inserts, updates, deletes, and upserts to publish the analytics result set into Azure Database for PostgreSQL. Learn more about Azure Database for PostgreSQL connector.
REST connector as sink
Generic REST connector is one of the most commonly used connectors in ADF to integrate with various SaaS applications or your own applications. It helps you easily extend and reach a great number of data sources than the built-in ones. Now using copy activity, not only you can use REST connector to retrieve data, ADF newly enables REST connector as sink so you can also write data via REST APIs. Learn more about REST connector.

Excel format – worksheet index
When parsing Excel files using copy activity or data flow, you have a new option to point to a worksheet by index in addition to by name. For example, if you just want to read the only worksheet in your Excel files and ignore its name, you can simply specify index as 0. Learn more about Excel format.

by Contributed | Dec 11, 2020 | Technology
This article is contributed. See the original author and article here.
Scenario:
Let us say, that you are regularly putting data into the storage, be it blob, or table, or queue, or file storage. You are performing read/write operations on the storage account using various applications/tools. Thus, there is regular ingest of data to the storage account and there are applications which are pulling data from the storage account. You want to know what are the transactions done on the storage account or amount of data written/read from the storage account. The easiest way to find any metric values for the storage account, is by referring to the Storage Metrices available on the Portal. It can be used to find what are the transactions done, or what is the egress/ingress values or what is the availability of the storage account.
But, when you specify the required time stamp and service for which you want to see metrices, you are unable to get any data. You are unable to understand whether why there is no metrices seen for the storage account or there are no transactions done on the account.
Let us understand how we can troubleshoot this scenario where we are unable to find the correct metrices for the storage account. There are many causes because of which you are not able to see the correct data in the metrices tab for the storage account. Let us explore the various causes for such issue:
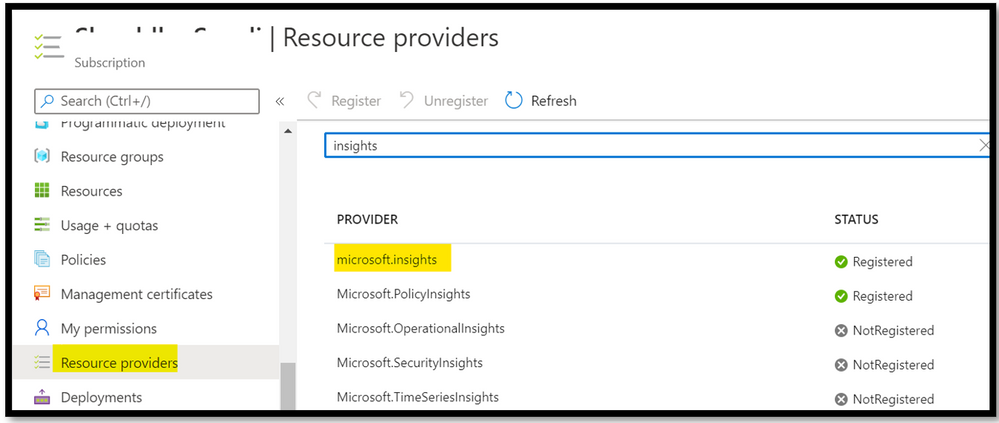
Cause 1: Any monitoring data that you see for a given resource (in this case, storage account), comes from the Resource Provider Microsoft.Insights. If this resource provider is not registered for your subscription, then there is no metrices seen for any resources. To ensure that your subscription is registered with the given resource provider, navigate to Azure Portal -> Go to the subscription settings -> Go to the Resource Provider tab -> Check if Microsoft.Insights is registered. You can refer to the below screenshot:
Alternatively, you can execute a PowerShell command to see if the resource provider is registered or not.
PS script:
Connect-AzAccount
Get-AzResourceProvider -ProviderNamespace Microsoft.Insights
|

If you see that the resource provider is not registered, then you can use the below PowerShell script to register the resource:
PS script:
Connect-AzAccount
Register-AzResourceProvider -ProviderNamespace Microsoft.Insights
|
Alternatively, you can use the Azure Portal to register for the resource provider.
Cause 2: The timestamp specified for the metrices, is greater than 30 days. Please note that metrices values are saved for 93 days, but we can query 30 days’ worth data in a single query. It means that, if you need to query the metrices for past 90 days, you will need to break the timestamp into 3 slabs of 30 days each. If you are seeing blank chart or a same part of the chart is missing, please check that your start and end date is within 30days.

Cause 3: You have ensured that the required resource provider is registered with the Subscription and the timestamp value given to query the data is well with 30 days. But you are still seeing that there is dotted graph in metrices tab. You are seeing graph as below:

The dotted graph is seen when there is no data to present on metrices. Let’s say, you have set granularity to 1min and there is data for 6:30 PM, 6:31 PM, 6:33PM and 6:34PM. Now, as there is no data for 6:32PM, the dotted line is plotted between the data point of 6:31PM and 6:33PM. This dotted line helps us in understanding when there are no data/transactions seen for the storage account. The dashed line value is zero when the metric used is count and sum aggregation. But for the avg, min or max aggregations, the dashed line will connect to the two nearest known data points.
When there is no data to represent on graph, dotted line will be seen.
Please note that this is by design. If you still want to see the “correct data” on the metrices, then you can make use of the scatter chart. The scatter chart will represent metrices for only those time period when data is available. For more details, you can refer to the link.
Cause 4: You are seeing that there is a “Error” message written across the metrices tab. You want to know if there is any issue with the storage account performance or whether the storage account is unavailable. As many critical applications are using the storage account, you want to ensure that there is no performance degradation for the storage account. But, the metrices tab is showing “Error” message and you are unsure of what to do next. In such scenarios, you can collect Fiddler trace while reproducing the issue. Fiddler is 3rd party tool used to capture the traffic and investigate the calls made. You can download the tool from the link.
In the Fiddler trace you can check the call made to the storage metrices and see what the response on it was. If you see that the request is successful, then you can be sure that the storage account is working. Then, we can check if the storage account is emitting the metrices details or not. For the request made to access the storage metrices, in the response tab, you can select “Web View”. If you see that the data is present in it, then the storage account is emitting metrices values. Thus, the issue is not with the Azure Storage Account but with the Portal not able to render the result. Hence, you can reach out to the Azure Portal Team for assistance.

The web view will contain details as such:

If you cannot make use of the Fiddler tool due to company/security restriction, you can collect HAR traces using browser. You can refer to the link for more details on how to capture HAR traces.
Cause 5: You are seeing that “Error” message is seen for the classic metrices.
When you put the storage account in Firewall or do VNet settings on it, you need to ensure that the trusted service is enabled in the firewall settings of the storage account. The classic metrices uses the Insight provider for listing the metrices. If is it is not enabled and the storage account is having VNet or Firewall settings done, then you will see “error” message for the classic metrics.


Cause 6: All the metrices values are saved in the table storage. There is dedicated table for each storage service. These tables consist of the transaction information, minute transaction information and capacity information. The transaction and minute transaction table will contain the information of request and response data. The capacity table will contain details of storage usage data. These table consists for both primary and secondary storage account.
Please note that these tables are not seen under table storage in Portal. You need to access these tables from the Azure Storage Explorer. If you do not find the metrices values in the Portal, you can access these tables to see the value.
Let’s say that you are seeing values in the table storage for the respective service, but the values is not seen in the Portal Metrices. It essentially means that the storage service is emitting the metric values but is not being rendered properly on the Portal. In such a case, you can reach out to the Azure Monitoring team via Support Ticket to see if there is any issue seen at their side.
by Contributed | Dec 11, 2020 | Technology
This article is contributed. See the original author and article here.
Microsoft Learn and Java
Welcome to the Java learning path. If you want to learn more about Java on Azure, you can head up to our YouTube channel, where we have interviews of Java Champions, tutorials, online conference sessions.
The MS Learn Java learning path
The Java learning path is for Java developers who want to better understand what they can achieve with Azure. It starts with the basics of Azure, and will make you discover our main services relevant for Java developers.

Here is the Java learning path on MS Learn, in which you will be able to find the following modules:
If you want to have the latest news on Java on Azure, please follow @JavaAtMicrosoft on Twitter and subscribe to the Java on Azure YouTube channel.
by Contributed | Dec 11, 2020 | Technology
This article is contributed. See the original author and article here.
ImageStore keeps copied package and provisioned packages.
Sequence of provision in Best Practice:
- Copy package to ImageStore with compress option
- Provision package
- Remove package in ImageStore
- Upgrade app/cluster
- Unprovision old version
When step 3 and 5 are missing, ImageStore accumulates files.
Symptom:
- The ImageStoreService (fabric:/System/ImageStoreService) could fill up disk.
- ImageStoreService replica may take long time in InBuild.
Option/Configuration for automatic cleanup:
How to configure cleaning up copied application package (automatic Step 3)
- Register-ServiceFabricApplicationType –ApplicationPackageCleanupPolicy Automatic
At step 2, Register (a.k.a. Provision), the application package is deleted after successfully registering the application type.
- <Section Name=”Management”>
<Parameter Name=”CleanupApplicationPackageOnProvisionSuccess” Value=”False” />
</Section>
This configuration enabled automatic cleanup of application package after successfully registering the application type.
How to configure cleaning up automatically unused application type (automatic Step 5)
<Section Name=”Management”>
<Parameter Name=”CleanupUnusedApplicationTypes” Value=”true” />
<Parameter Name=”PeriodicCleanupUnusedApplicationTypes” Value=”true” />
<Parameter Name=”TriggerAppTypeCleanupOnProvisionSuccess” Value=”true” />
<Parameter Name=”MaxUnusedAppTypeVersionsToKeep” Value=”3″ />
</Section>
Manual Cleanup:
When ImageStoreService must be cleaned up manually, you can follow this steps.
1. Delete copied packages
#Delete Content from Image Store
$content =
Get-ServiceFabricImageStoreContent -RemoteRelativePath “” -ImageStoreConnectionString fabric:ImageStore
foreach($folder in $content)
{
Write-Host Working on $folder.StoreRelativePath
if (($folder.StoreRelativePath -ne “Store”) -and ($folder.StoreRelativePath -ne “WindowsFabricStore”))
{
Write-Host Deleting $folder.StoreRelativePath
Remove-ServiceFabricApplicationPackage -ApplicationPackagePathInImageStore $folder.StoreRelativePath -ImageStoreConnectionString fabric:ImageStore
}
}
2. Unregister
Unregister-ServiceFabricApplicationType will remove application packages from image store as well as ImageCache on nodes (after a while).
Scenario1 : Seeing zombie application package in the store, which taking most of the disk space.
- Verify whether meta data for the older version is associated with ISS [ Get-SFImageStoreContent -remoterelativepath ‘StoreIberFabric.App.PortalComercial.Services.AgendaType’ verify whether older package type is in the list ]
- If the older file is not listed in the #1, you can rdp into each VM which hosting the ISS replica, and delete it manually
- If meta data is present in #1 output, please verify the version customer wanted to delete is already in the registry by running, ‘Get-ServiceFabricApplicationType’
- In the #3 output, If the application type is already there, please un provision by ‘Unregister-ServiceFabricApplicationType’
- If the #3 output application type detail is not present, you can run ‘ Remove-ServiceFabricApplicationPackage -ApplicationPackagePathInImageStore “StoreIberFabric.App.PortalComercial.Services.AgendaType<<package with version number>>
[https://docs.microsoft.com/en-us/azure/service-fabric/service-fabric-application-upgrade-tutorial-powershell]
https://docs.microsoft.com/en-us/powershell/module/servicefabric/register-servicefabricapplicationtype?view=azureservicefabricps#optional-parameters
Note : For 6.5+ Cluster, SFX had ImageStoreService tab in Cluster, where GetSize button to get the size of Store content.

Recent Comments