
by Contributed | Nov 10, 2020 | Technology
This article is contributed. See the original author and article here.
 Man using AI glasses with machinery
It’s an exciting time at Microsoft, with growing investments in edge computing and AI. Much of the future will be influenced by these technologies, and indeed, we are already seeing their power in telco 5G devices, IoT platforms, and low-power wide-area (LPWA) networks. With Microsoft’s recently announced Azure for Operator efforts, we’re in a unique position to drive IoT experiences that leverage edge AI via these emerging 5G and LPWA networks.
Toward that end, I’m so pleased to say we’re now collaborating with Qualcomm Technologies to facilitate a seamless artificial intelligence (AI) and machine learning (ML) developer experience. The efficiency granted by this seamlessness of development and deployment will benefit enterprises using Microsoft’s Azure and AI solutions such as the Azure IoT platform, and Qualcomm Technologies’ IoT processors and AI inferencing products.
Our two companies have produced some great work together over the years, including recent products and solutions for Microsoft’s Surface Pro X and Vision AI Developer Kit. This newest collaboration is just as exciting. Qualcomm Technologies’ position in the mobile ecosystem enables them to drive hardware-accelerated inference capabilities from ultra-low power edge AI solutions all the way to high-performance AI inferencing in the cloud using the Qualcomm® Cloud AI 100, all leveraging LPWA and emerging 5G deployments with commercial customers. This makes them an excellent company to team up with for our new, polished AI and ML developer experience.
Keith Kressin, Senior President and General Manager, Compute and Cloud, Qualcomm Technologies said, “5G and AI are the two key technologies today fueling the convergence of the cloud and devices at the edge of networks. Collaborating with Microsoft to accelerate AI across a wide breadth of connected devices from the edge to the cloud, with our platform that runs single-milliwatt to Snapdragon to the Qualcomm Cloud AI 100, will enable a variety of powerful new applications and services.”
I know I speak for the entire Microsoft Azure Edge Devices team when I say we’re very excited to be working with Qualcomm Technologies on solutions to benefit enterprise developers and deployers across industries.
by Contributed | Nov 10, 2020 | Technology
This article is contributed. See the original author and article here.
The November 2020 Monthly Update includes the following change to the Daylight Savings Time (DST) start date for Fiji:
- As a result of the October 8th order from the Fijian Government, Daylight Saving Time (DST) in the Republic of Fiji will begin at 02:00 on December 20, 2020 instead of November 8, 2020.
For Microsoft’s official policy on DST and time zone changes, please see Daylight saving time help and support. For information on how to update Windows to use the latest global time zone rules, see How to configure daylight saving time for Microsoft Windows operating systems.
by Contributed | Nov 10, 2020 | Technology
This article is contributed. See the original author and article here.
This blogpost is authored by Itai Norman and Tiander Turpijn.
Thanks to the Azure Sentinel PM team for the great help.
In the world of cybersecurity and Security Information and Event Management (SIEM) systems, security orchestration, automation, and response (SOAR) plays a crucial role.
To provide you SOAR capabilities, Azure Sentinel integrates with Azure Logic Apps – a cloud service that helps you schedule, automate, and orchestrate tasks, business processes, and workflows.
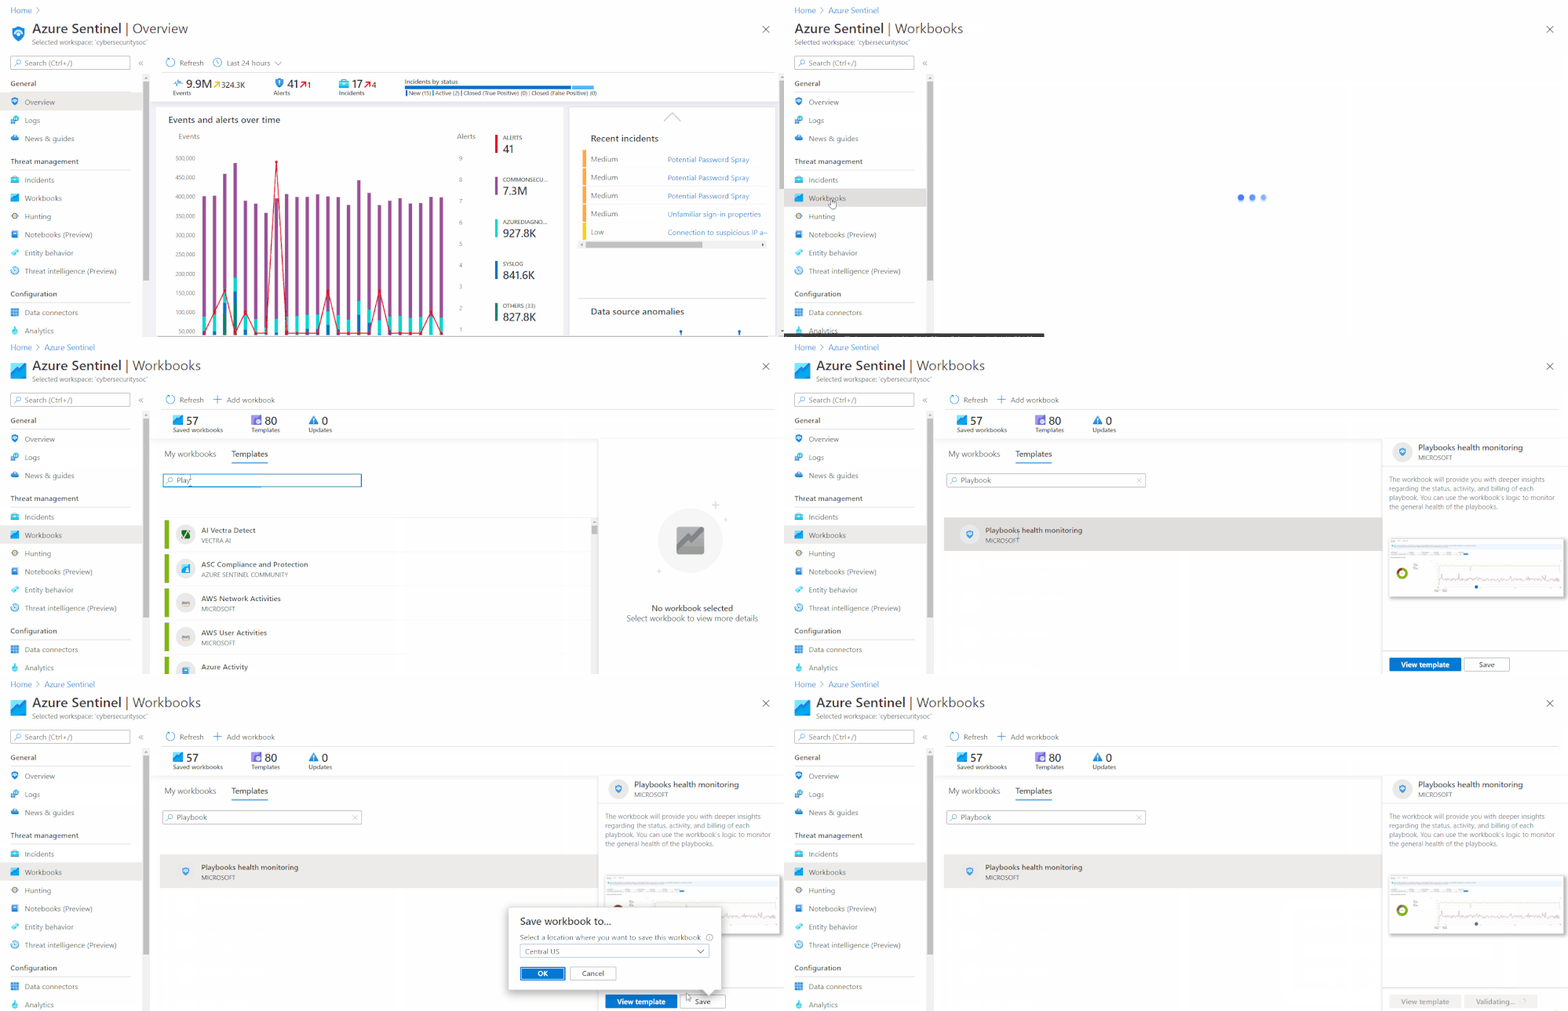
An Azure Logic App can be used in Azure Sentinel as a Playbook to be automatically invoked when an incident is created or when triaging and working with incidents. To provide insights into the health, performance and usage of these Playbooks, we are providing a new Azure Workbook called “Playbooks health monitoring”.
Azure Workbooks provide a flexible canvas for data analysis and the creation of rich visual reports. These can be custom built, although Azure Sentinel provides a number of out of the box Azure Workbooks, which typically are provided with an Azure Sentinel connector. Additional Logic Apps and Workbooks samples can be found on our Azure Sentinel GitHub repo.
You can use the Playbooks health monitoring workbook to monitor the health of your Playbooks, look for anomalies in the amount of succeeded or failed runs. Spot unordinary Playbooks with a long duration run time, monitor, and manage changes made by different users, specifically for critical Playbooks. At a glance, you can also view the execution time of a Logic App which helps you getting an estimate of the usage costs.
The workbook is now available in your “Templates” gallery under the name “Playbooks health monitoring”.

The following insights are provided:
- Success and failure over time to detect anomalies
- Failure percentage
- Average run time
- All failed Logic Apps and drill down capability to detect the error
- Changes made and who performed them
- Billable related information
The workbook is divided into 3 different tabs for easier navigation. Under Overview you can find the overall health and status for your Logic Apps Playbooks. More specifically:
Success and failure over time
- Success and failure runs
- An overtime success/failure line chart to spot anomalies. Choose a time range with the “Time brush” option to drilldown to a more specific time range without changing the workbook time range.
The following grids and charts will filter accordingly.

Failure percentage per Logic App
This grid is built on top of the built-in metrics saved by Logic Apps.
For each Logic App you can view failure percent/over time, run started/runs completed count and latency (Logic Apps’ duration runtime).

Logic Apps by status
The Logic Apps status views are context driven, which means that based on a selection, the views will be updated related to your selection.
To drill down on a specific Logic App, you can view the count and trends by status:

Choose a status by clicking one of the icons (Failed, Succeeded, etc.), which will filter the grid below based on the status you picked.
From the filtered grid, you can click on a specific Logic App by clicking on a row.
That will automatically filter the two grids below, which presents you with the Logic App trigger and status.
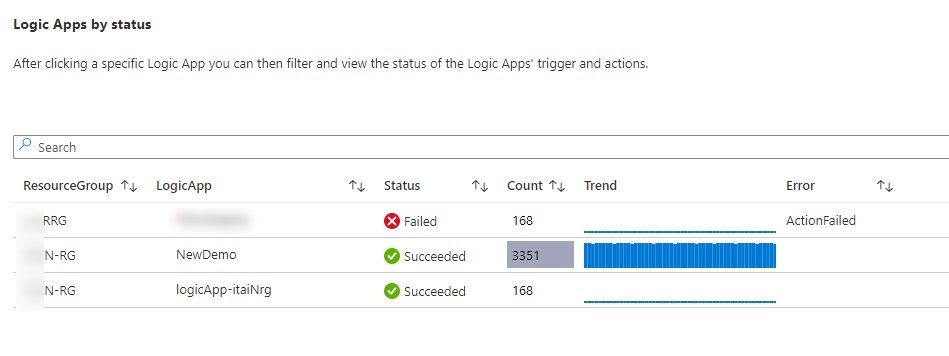
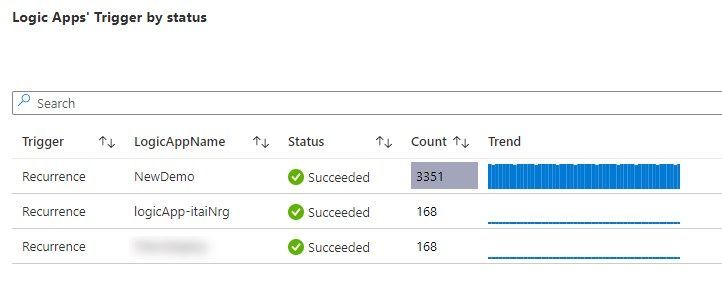
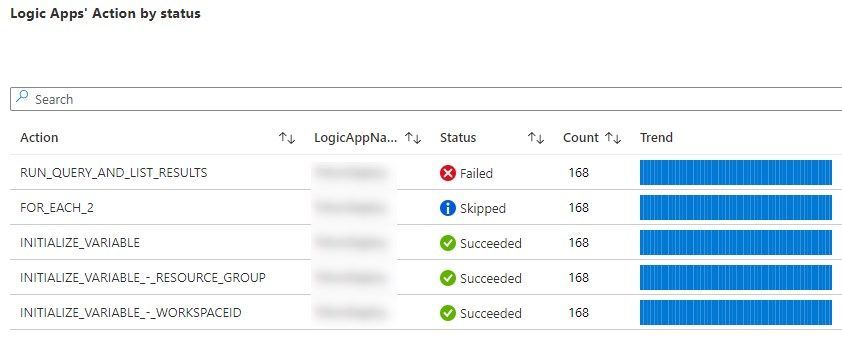
Note: At any time if you want to unpick an object you should click the curved arrow on the top right corner of the grid or chart.
The Activity tab contains three grids which derives the information from the Azure Activity table and provides insights into the following:
- Logic Apps activities by user -View different logic apps activities by user (Email address)
- API Connection Activities – View different API connection activities by user (Email address)
- Logic Apps activities by Logic App – View different activities by logic app, also you can see who performed the activities
Note: Note: when switching tabs, you need to click on the refresh button for the data to show:

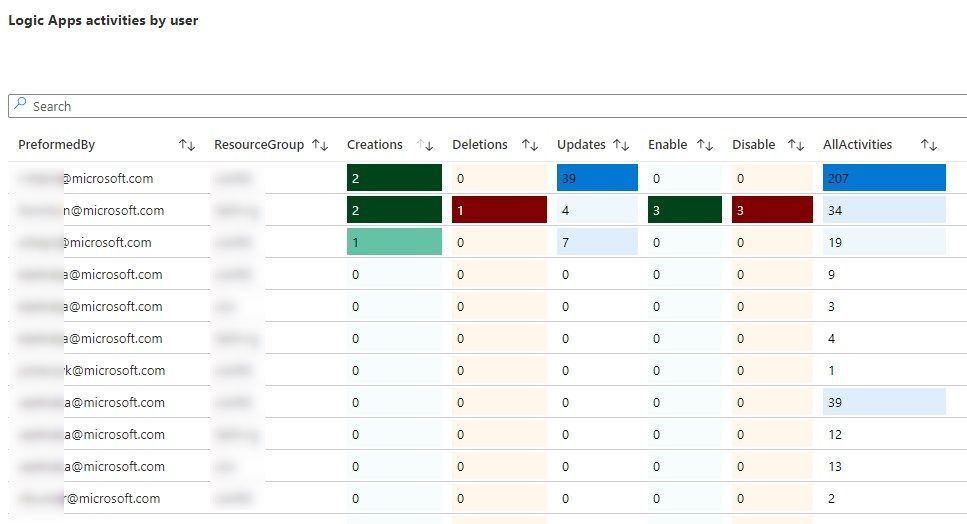
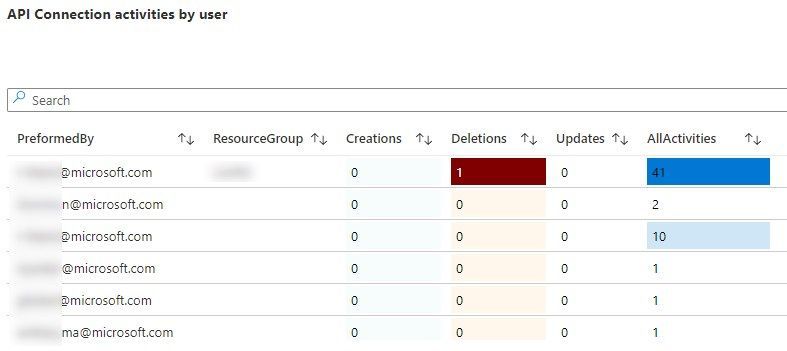
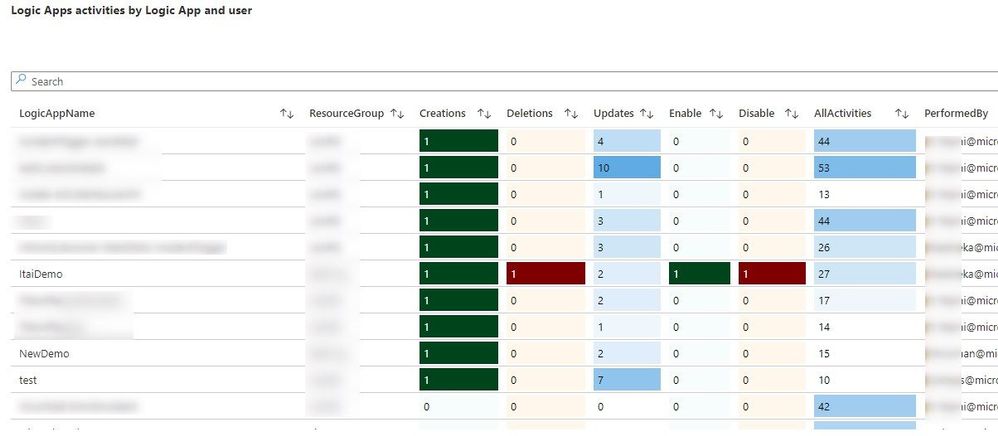
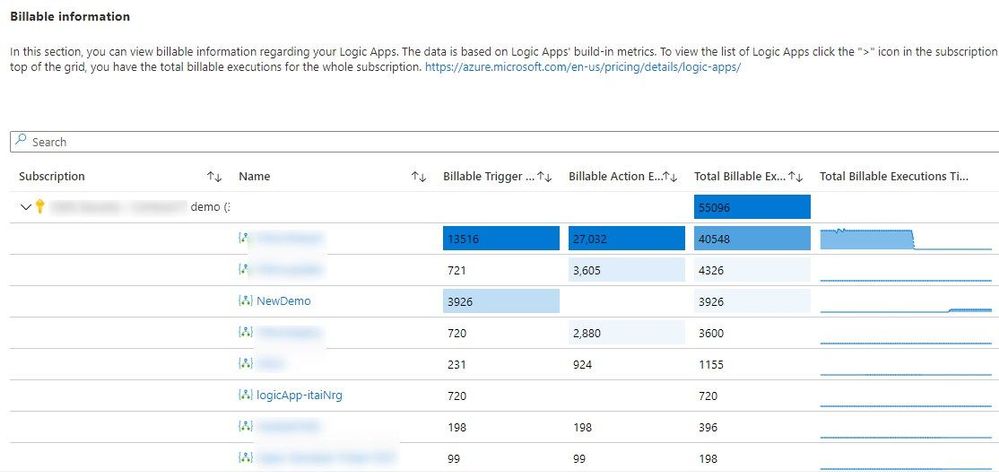
The Billable Info tab contains one grid, derived from the built-in Logic Apps metrics, and shows the total billable executions per subscription. If you collapse the subscription, details per Logic App become visible and allow you to estimate your costs by using the pricing calculator.
The billable triggers and actions per Logic App can help you to become more cost effective.
Configuration requirements
For Logic Apps data to be available in your workbook, you need to enable the diagnostic settings for all the Logic Apps you would like to monitor. Ensure that you have selected the Send to Log Analytics option in the diagnostics settings. This will send the data to a Log Analytics workspace of your choice, which does not have to be your Azure Sentinel workspace. The data will be stored in the AzureDiagnostics table.
Please visit the page Set up diagnostics logs for Azure Logic Apps for a thorough explanation on the several diagnostic settings.
The Activity tab in the workbook is based on Activity logs. Like the diagnostics settings, this needs to be configured to send the data to your Log Analytics workspace of choice.
Please send your feedback to Itai Norman – itnorman@microsoft.com or add your comments below.
by Scott Muniz | Nov 10, 2020 | Security, Technology
This article is contributed. See the original author and article here.
Original release date: November 10, 2020
Microsoft has released updates to address vulnerabilities in Microsoft software. A remote attacker could exploit some of these vulnerabilities to take control of an affected system.
The Cybersecurity and Infrastructure Security Agency (CISA) encourages users and administrators to review Microsoft’s November 2020 Security Update Summary and Deployment Information and apply the necessary updates.
This product is provided subject to this Notification and this Privacy & Use policy.
by Contributed | Nov 10, 2020 | Technology
This article is contributed. See the original author and article here.
Today we are announcing new Analysis Services virtual machine images for SQL Server 2019. Now customers have the ability to deploy an Analysis Services virtual machine (SSAS) using pre-configured Standard and Enterprise edition image types for ease of deployment. The images will be available with pay-as-you-go licensing only.


Recent Comments