by Scott Muniz | Sep 1, 2020 | Uncategorized
This article is contributed. See the original author and article here.
A few years ago it was all the rage to talk about “Big Data”. Lots of descriptions of “Big Data” popped up, including the “V’s” (Variety, Velocity, Volume, etc.) that proved very helpful.
But I have my own definition:
Big Data is any data you can’t process in the time you want with the systems you have
– Uncle Buck’s Guide to Technology
Data professionals focused on learning technologies like Hadoop and Spark to ingest, process, and distribute large sets of data. This set of activities is often now called “Data Engineering”. I still teach this term when I talk about the new SQL Server 2019 Big Data Cluster platform.
We’ve moved on to talk about using all that data in applications of Artificial Intelligence (AI), Machine Learning (ML), and Deep Learning (DL). I teach this as part of the operationalizing function of the SQL Server Big Data Cluster.
(AI and ML tend to “top out” for the usefulness of amounts of data at a really high amount, but Deep Learning is always hungry for more data. )
But the “Big Data” moniker has gone largely silent – which means it’s not a thing any more, right?
No, that’s not right at all – Data Scientists were always rather baffled at having to explain “big” data, since the algorithms we use require statistically significant amounts of features and labels to work. For a Data Scientist, it’s always been just “data”. (Or data if that’s how you pronounce it)
So the industry is now catching up with those Data Science concepts. The term “Big Data” has died out in the Hype Cycle, but it is baked in to the AI, ML and DL applications.
Long story short: You still have to learn HDFS, Spark, and Distributed Storage / Computing. And we’ll help you do that here.
FYI – it’s OK to have catchy terms and ways of describing things at first – new industries always do that. Also, it really helps rake in the money for vendors that use the cool new term. Remember when everything was i-this and e-that? No? Well, everything was. And before that, it was all “electro” or “magna-” something or other. Of course, when I started in computing, we just used cards and teletypes, but that’s another blog.
by Scott Muniz | Sep 1, 2020 | Azure, Microsoft, Technology, Uncategorized
This article is contributed. See the original author and article here.
SQLBits 2020 is going digital this year – and, with less than a month away, the excitement for “the greatest data show” is only rising. It is the largest SQL Server and Microsoft Data Platform conference in Europe, bringing together customers, partners, and community members – this time as a fully virtual and interactive conference.
From September 29 to October 3, 2020, join the experts from the Microsoft SQL Server/ Azure SQL product groups for 5 days of learning and connecting with our SQL Server community.
To make your conference planning easy for you, I put together a list of the 2 pre-cons and 30+ sessions from the Azure Data team you won’t want to miss:
| Date |
Sessions |
Speaker(s) |
| PRE-CONS |
| 9/29/2020 |
The Azure SQL Workshop |
Bob Ward, Anna Hoffman |
| 9/30/2020 |
The SQL Server 2019 Workshop |
Bob Ward, Pedro Lopes, Anna Hoffman, Buck Woody |
| THURSDAY |
| 10/1/2020 |
SQL Server in Azure Virtual Machines reimagined |
Ajay Jagannathan |
| 10/1/2020 |
SQL Server to Azure SQL: Performance and Availability |
Anna Hoffman, Bob Ward |
| 10/1/2020 |
SQL Server 2019: The Modern Data Platform |
Bob Ward |
| 10/1/2020 |
Sandboxing SQL Server 2019 Big Data Clusters |
Daniel Coelho, Rahul Ajmera |
| 10/1/2020 |
Optimizing your Azure SQL Database workloads |
Denzil Ribeiro, Sanjay Mishra, Dimitri Furman |
| 10/1/2020 |
What’s New in SQL Tools for Developers |
Drew Skwiers-Koballa, Udeesha Gautam |
| 10/1/2020 |
Run rich confidential queries using Always Encrypted with secure enclaves |
Jakub Szymaszek |
| 10/1/2020 |
SQL Extensibility Architecture in the Machine Learning Platform |
Michelle Wallig |
| 10/1/2020 |
Optimize price-performance using Azure SQL Database serverless |
Morgan Oslake |
| 10/1/2020 |
SQL Server in Azure Virtual Machine reimagined |
Pam Lahoud |
| 10/1/2020 |
Query plans: a map to query performance analysis |
Pedro Lopes |
| 10/1/2020 |
10 DBA Tasks for Azure SQL: What’s Different from On-Prem |
Rie Irish |
| 10/1/2020 |
Azure Data Studio Features in 20 Minutes |
Vicky Harp |
| FRIDAY |
| 10/2/2020 |
Inside SQL Server on Kubernetes |
Bob Ward |
| 10/2/2020 |
An administrators guide to SQL Server 2019 BDC |
Buck Woody, Melony Qin |
| 10/2/2020 |
Azure SQL Hyperscale Deep Dive |
Denzil Ribeiro |
| 10/2/2020 |
New Azure AD authentication capabilities in Azure SQL |
Jakub Szymaszek |
| 10/2/2020 |
Improving Availability in SQL Server and Azure SQL Database with Accelerated Database Recovery and Resumable Operations |
Kevin Farlee |
| 10/2/2020 |
New Azure AD authentication capabilities in Azure SQL |
Mirek Sztajno |
| 10/2/2020 |
Azure SQL Managed Instance: A fully managed SQL Server in the cloud |
Mladen Andzic |
| 10/2/2020 |
Everything you need to know about storing strings in SQL Server and Azure SQL DB |
Pedro Lopes |
| 10/2/2020 |
SQL on Linux – What’s new |
Tejas Shah |
| SATURDAY |
| 10/3/2020 |
Azure SQL: What to use when |
Anna Hoffman |
| 10/3/2020 |
Artificial Intelligence, Machine Learning and Deep Learning |
Buck Woody |
| 10/3/2020 |
Practical Azure SQL for the Modern Developer |
Davide Mauri |
| 10/3/2020 |
Azure data services on Azure Arc |
James Rowland-Jones, Nellie Gustafsson |
| 10/3/2020 |
Notebooks in Azure Data Studio |
Julie Koesmarno, Alan Yu, Chris LaFreniere |
| 10/3/2020 |
Turbo-charge your SQL Server with In-Memory Database |
Kevin Farlee |
| 10/3/2020 |
Democratizing Machine Learning on the SQL Platform |
Michelle Wallig |
| 10/3/2020 |
Azure SQL and SQL Server: Path to an Intelligent Database |
Pedro Lopes |
| 10/3/2020 |
Network access controls for Azure SQL Database |
Rohit Nayak |
| 10/3/2020 |
Azure SQL Database Edge – Optimized SQL Engine for Edge/IoT Computing |
Sourabh Agaral |
| 10/3/2020 |
App Modernization and Migration from End to end, using data migration tools and Azure SQL |
Venkata Raj Pochiraju, Mukesh Kumar |
| 10/3/2020 |
Database modernization best practices and lessons learned through customer engagements |
Venkata Raj Pochiraju, Mukesh Kumar |
| 10/3/2020 |
Coming Soon: Upcoming SQL Tools Features |
Vicky Harp |
Hope to see you there! Tweet us at @AzureSQL for sessions you are most excited about.
by Scott Muniz | Sep 1, 2020 | Uncategorized
This article is contributed. See the original author and article here.
 Mobile devices are indispensable for busy clinicians who need to enter and retrieve patient data quickly, easily, and securely. Imprivata Mobile enables the use of Teams and other Microsoft 365 applications on shared iOS mobile devices, with automated provisioning and device personalization at the start of each shift.
Join Randy Nale, Healthcare Technology Strategist at Microsoft, and Wes Wright, CTO at Imprivata, to learn how to boost efficiency in the demanding hospital setting using Imprivata Mobile and Microsoft 365.
- When: September 10th at 1:30 pm eastern
- Where: Microsoft Teams Live Events webcast
- Host: Michael Gannotti, Principal Microsoft Teams Technology Specialist
- Guests: Randy Nale, Healthcare Technology Strategist at Microsoft, and Wes Wright, CTO at Imprivata
To attend “Making the most of Microsoft 365 on iOS: Microsoft + Imprivata”:
Thanks for visiting – Michael Gannotti LinkedIn | Twitter
 Michael Gannotti
by Scott Muniz | Sep 1, 2020 | Azure, Microsoft, Technology, Uncategorized
This article is contributed. See the original author and article here.
Hi, all! Rod Trent here. I am a Cybersecurity CE/Consultant at Microsoft and working with Azure Sentinel. I also blog for our Secure Infrastructure Blog and have quite a few Azure Sentinel articles posted there already.
As a general best practice, you want to configure access to Azure Sentinel resources through the Resource Group and you want to ensure you are providing only the access required i.e., using a least permissive model. Azure Sentinel resource access is applied using the following assignment roles…
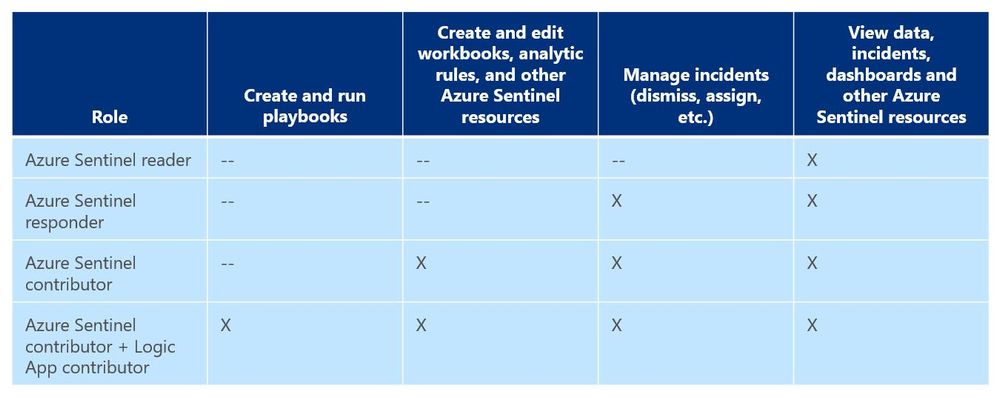
 Azure Sentinel roles and allowed actions
I talk about these roles, access, and best practices for access based on analyst levels quite often with our customers. Building security team members’ responsibilities is important and a critical part of the SOC workflow. However, one of the first things customers ask during this discussion is about Playbook usage. As you can see from the table above, to actually run Playbooks (apply automation), an analyst is required to have both Azure Sentinel contributor and Logic App contributor roles. Hmmm…so what if you want the Responder or Reader roles to perform automation?
Keep in mind that Playbooks are powerful. In the wrong hands, dangerous things can happen. Who really wants to accidentally lock the CEO out their login account because the password was forgotten, was typed in wrong 10 times in the last hour, and the HelpDesk was never called due to ego? But if it’s going to happen – even on purpose – it’s probably best for a seasoned analyst to take the blame for it. It could be a career-ending move for a Tier 1 analyst.
Creating Playbooks should go through a methodical, logical process. Only create a Playbook out of need and also ensure that the proper teams are involved during the design. Don’t automate just to automate. For example, for those situations where a Playbook causes a user account to be locked or a port to be blocked at the firewall, its best for the Security team to work with the Operations team to make sure it’s done correctly and effectively and that it’s gone through the proper authorizations. Think about it. By applying automation through Playbooks you are effectively shortcutting the Change Management process. Without proper vetting from the proper teams, bad things could happen both technically and politically. Oh…and feelings could be hurt, too. And, what’s worse than that?
So, after all the vetting has taken place and the authorization checkboxes have been ticked, you may determine that certain Playbooks are safe and they might fit a requirement to be run by those who don’t have the overarching Logic App contributor role or god-like powers in either Azure or Azure Sentinel. You probably don’t want a Tier 1 analyst who is assigned the lowly Azure Sentinel Reader role to be able to lockout users, but it might be beneficial for them to do something more simple like ensuring each open Incident has the IP GEO location applied.
Fortunately, since Playbooks are built on Logic Apps and Logic Apps provides the ability to set specific access per resource, you can assign specific Playbook access using Access Control (IAM).
Here’s an example…
In my Azure tenant I have a user account, Jaime Sommers, who has been assigned the Azure Sentinel Reader role. With that role Jaime is limited to only being able to view data in the Azure Sentinel console.
But I want Jaime to be able to add the GEO location to Incidents using the Get-GeoFromIpandTagIncident Playbook – but only THAT Playbook – and none of the others. That’s going to save our team time as our Tier 2 analysts gear up each day to determine which new Incidents they need to start investigating.
Through the Playbooks blade in the Azure Sentinel console, I access the Access Control (IAM) blade and assign the Logic Apps Contributor role specifically to the user account Jaime Sommers.
 Adding the Logic App Contributor role to a specific Playbook for a specific analyst
Adding the Log Analytics Contributor role to a specific Playbook for a specific analyst
After a brief sync (it can sometimes take a minute or longer), when Jaime refreshes her Playbooks blade, she can now see the specific Playbook and can then use it to apply GEO location to an Incident she is working on.
 Playbook access for Jaime
As you can see in the image above, the bottom screenshot example is Jaime without the specific Logic App Contributor role assigned and the top screenshot example is after she has been granted access to it.
Summary
And, even though Jaime is severely limited in what she can do in the Azure Sentinel console due to her lowly Azure Sentinel Reader role assignment, she can now run the Playbook and GEO is assigned to the Incident.
 Huzzah!
* Check out my other blog for more Azure Sentinel content: Rod Trent at the Secure Infrastructure Blog
* Follow me on Twitter: https://twitter.com/rodtrent

by Scott Muniz | Sep 1, 2020 | Azure, Microsoft, Technology, Uncategorized
This article is contributed. See the original author and article here.
Introduction
With an ever-expanding ocean of data, more and more organizations need to perform advanced and fast analytics over their business data, logs, and telemetry while seeking to reduce costs. Many of them are shifting towards Azure Data Explorer (ADX) and taking advantage of the significant benefits it offers to analyze billions of records quickly and cost-effectively.
But sometimes they are already using other tools. One common scenario is that organizations are already using Elasticsearch, Logstash, and Kibana (The ELK Stack). Migration between big data platforms sounds like a long and complicated process. But that’s not always true. Switching from ELK to Azure Data Explorer offers the opportunity to significantly boost performance, reduce costs and improve the quality of insights by offering advanced query capabilities; all this without entering a long and complex migration, thanks to the tools described below.
This blog post covers the following topics:
- Why organizations are moving to Azure Data Explorer
- How you can use Azure Data Explorer with Kibana
- What additional tools for data exploration, visualizations, and dashboards are available
- How you can send data to Azure Data Explorer through Logstash (or other tools)
- How to use Logstash to migrate historical data from Elasticsearch to Azure Data Explorer
- Appendix: Step by step example – using Logstash to migrate historical data from Elasticsearch to Azure Data Explorer
1. Why organizations are moving to Azure Data Explorer
Azure Data Explorer is a highly scalable and fully managed data analytics service on the Microsoft Azure Cloud. ADX enables real-time analysis of large volumes of heterogeneous data in and allows rapid iterations of data exploration to discover relevant insights. In short, the advantages of ADX can be summed up using the three Ps: Power, Performance, Price.
Power
 Azure Data Explorer has a unique column-store inverted-index design. With the intuitive Kusto Query Language (KQL) you can query an enormous amount of data and perform ad-hoc analytics in seconds.
Users state that they find it easier to find value and new insights from their data, using KQL. They are more engaged and understand the data better, since they can efficiently explore the data and run ad-hoc text parsing, create run-time calculated columns, aggregations, use joins, and plenty of other capabilities.
These capabilities are natively supported without the need to modify the data. You don’t have to pre-organize the data, pre-define scripted fields, or de-normalize the data. There is no need to manage and take care of the hierarchy of Indices, Types, and IDs.
Azure Data Explorer’s machine–learning capabilities can identify patterns that are not obvious and detect differences in data sets. With capabilities like time series analysis, anomaly detection, and forecasting, you can uncover hidden insights and easily point out issues or unusual relationships you may not even be aware of. You can also run inline Python and R as part of the queries.
Also, Azure Data Explorer supports many communication APIs and client libraries, all of which make programmatic access easy.
Performance
 As a fully managed service, Azure Data Explorer gives you best–in-class performance. You can get results from one billion records in less than a second without modifying the data or metadata. ADX can accept hundreds of billions of records a day and store this data reliably for months. ADX is specifically built to handle complex analytics queries on the data and return answers in a matter of seconds, even when the data is a combination of structured, semi-structured (JSON-like nested types), and unstructured (free text).
Price
 Azure Data Explorer is a managed Platform as a Service (PaaS), so you can reduce the management and operations overhead and save the cost of purchasing and maintaining hardware. Auto–scale capabilities are available for better cost control. Due to the efficient data ingestion process and querying engine, compute resources are consumed wisely and economically. The inverted-index columns-store design enables ADX to have a superb data compression ratio, which reduces the amount of required storage, compared to other services. You can run as many queries as you need, thanks to the optimized cost structure, without incurring additional costs. In addition, ADX provides a granular cache policy that customers can set to differentiate between hot data cache and cold data cache, and get even more control over the costs.
You can configure and estimate the costs with our cost estimator.
2. How you can use Azure Data Explorer with Kibana
As announced in a separate blog post, we developed the K2Bridge (Kibana-Kusto Bridge), an open-source project that enables you to connect your familiar Kibana’s Discover tab to Azure Data Explorer. Starting with Kibana 6.8, you can store your data in Azure Data Explorer on the back end and use K2Bridge to connect to Kibana. This way, your end-users can keep using Kibana’s Discover tab as their data exploration tool.  Connect Kibana to Azure Data Explorer with K2Bridge
3. What additional tools for data exploration, visualizations, and dashboards are available
Azure Data Explorer offers various other exploration and visualization capabilities that take advantage of the rich and built-in analyses options of KQL, including:
- Azure Data Explorer Web UI/Desktop application – to run queries, analyze and explore the data using powerful KQL queries.
- The KQL render operator offers various out-of-the-box visualizations such as tables, pie charts, anomaly charts, and bar charts to depict query results. Query visualizations are helpful in anomaly detection, forecasting, machine–learning scenarios, and more.
As described in the first chapter, you can efficiently run ad-hoc text parsing, create calculated columns, use joins and plenty of other capabilities, without any modifications or pre-organizations of the data.
- Azure Data Explorer dashboards – a web UI that enables you to run queries, build dashboards, and share them across your organization.
- Integrations with other dashboard services like Power BI and Grafana.
4. How you can send data to Azure Data Explorer through Logstash (or other tools)
Are you already using Logstash as the data pipeline? If so, redirecting the data to ADX is easy! You can use the open-source Logstash Output Plugin for Azure Data Explorer (a detailed example is described in the next chapter), and keep using the Logstash input plugin according to your specific source of the ongoing event stream, as you use it today. 
There are many other ways to ingest data into Azure Data Explorer, including:
- Ingestion using managed pipelines – using Azure Event Grid, Azure Data Factory (ADF), IoT Hub and Event Hub (Event Hub can receive data from several publishers, including Logstash and Filebeat, through Kafka).
- Ingestion using connectors and plugins – Logstash plugin, Kafka connector, Power Automate (Flow), Apache Spark connector
- Programmatic ingestion using SDKs
- Tools – LightIngest or One–click ingestion (a detailed example is described in the next chapter)
- KQL ingest control commands
For more information, please refer to the data ingestion overview.
5. How to use Logstash to migrate historical data from Elasticsearch to Azure Data Explorer
Choose the data you care about
When you decide to migrate historical data, it is a great opportunity to validate your data and needs. There is a good chance you can remove old, irrelevant, or unwanted data, and only move the data you care about. By migrating your freshest and latest data only, you can reduce costs and improve querying performance.
Usually, when organizations migrate from Elasticsearch to Azure Data Explorer, they do not migrate historical data at all. The approach is a “side-by-side” migration: they “fork” their current data pipeline and ingest the ongoing live data to Azure Data Explorer (by using Logstash/Kafka/Event Hub connectors, for example). Anyway, we show how you can migrate your historical data using Logstash. For efficiency, the Logstash output plugin section in the next examples contains a ‘query’ section in which you specify the data you care about and would like to export from Elasticsearch.
Data migration from Elasticsearch to Azure Data Explorer
Here we describe two methods to migrate historical data from Elasticsearch using Logstash. See the appendix for a step-by-step tutorial.
Method 1: Logstash and One-click Ingestion/LightIngest

Use Logstash to export the data from Elasticsearch into CSV or JSON file(s), and then use Azure Data Explorer’s One-Click Ingestion feature to ingest the data.
- This is an easy way to quickly ramp-up and migrate data because One-Click Ingestion automatically generates the destination table and the ingestion mapping based on the structure of the data source (of course, you can edit the table schema if you want to).
- One-Click Ingestion supports ingesting up to 1 GB at a time. To ingest a more massive amount of data, you can:
- Slice your data into multiple files and ingest them separately.
- Use LightIngest – a command-line utility for ad-hoc data ingestion. The utility can pull source data from a local folder (or from an Azure blob storage container).
- Use the second method described below.
Method 2: Using Logstash only (with the output plugin for Azure Data Explorer)

Use Logstash as a pipeline for both exporting data from Elasticsearch and ingesting it into Azure Data Explorer. When you use this method, you should manually create the Azure Data Explorer destination table and define the ingestion mapping. (You can automatically generate the destination table and the table mapping by using One-Click Ingestion with sample data, as described in method 1 first, and then use method 2 for the rest of the data)
In this blog post, we talked about the advantages of Azure Data Explorer, went over several visualizations options, including the open-source Kibana-Azure Data Explorer connector, and introduced a variety of ways you can ingest your ongoing data into Azure Data Explorer. Then, we presented two ways to migrate historical data from Elasticsearch to Azure Data Explorer.
In the appendix, you can find two step-by-step sample scenarios for historical data migration.
Please do not hesitate to contact our team or leave a comment if you have any questions or concerns.
Appendix: Step-by-step example of historical data migration
Method 1: Logstash and One–Click Ingestion
- Use Logstash to export the relevant data to migrate from Elasticsearch into a CSV or a JSON file. Define a Logstash configuration file that uses the Elasticsearch input plugin to receive events from Elasticsearch. The output will be a CSV or a JSON file.
- To export your data to a CSV file: use the CSV output plugin. For this example, the config file should look like this:
# Sample Logstash configuration: Elasticsearch -> CSV file

input {
    # Read documents from Elasticsearch matching the given query
    elasticsearch {
        hosts => ["http://localhost:9200"]
        index => "storm_events"
        query => '{ "query": { "range" : {  "StartTime" : { "gte": "2000-08-01 01:00:00.0000000", "lte": "now" }}}}'
    }
}

filter {
    ruby {
        init => "
            begin
                @@csv_file    = 'data-csv-export.csv'
                @@csv_headers = ['StartTime','EndTime','EpisodeId','EventId','State','EventType']
                if File.zero?(@@csv_file) || !File.exist?(@@csv_file)
                    CSV.open(@@csv_file, 'w') do |csv|
                        csv << @@csv_headers
                    end
                end
            end
        "
        code => "
            begin
                event.get('@metadata')['csv_file']    = @@csv_file
                event.get('@metadata')['csv_headers'] = @@csv_headers
            end
        "
    }
}

output {
    csv {
        # elastic field name
        fields => ["StartTime","EndTime","EpisodeId","EventId","State","EventType"]
        # This is path where we store output.
        path => "./data-csv-export.csv"
    }
}
This config file specifies that the ‘input’ for this process is the Elasticsearch cluster, and the ‘output’ is the CSV file.
- Implementation note:The filter plugin adds a header with the field names to the CSV file’s first line. This way, the destination table will be auto built with these column names. The plugin uses the ‘init’ option of the Ruby plugin to add the header at Logstash startup-time.
- Alternatively, you can export your data to a JSON file, using the file output format.
This is what our Logstash config file looks like:
# Sample Logstash configuration: Elasticsearch -> JSON file
input {
# Read documents from Elasticsearch matching the given query
elasticsearch {
hosts => ["http://localhost:9200"]
index => "storm_events"
query => '{ "query": { "range" : { "StartTime" : { "gte": "2000-08-01 01:00:00.0000000", "lte": "now" }}}}'
}
}
output {
file {
path => "./output_file.json"
codec => json_lines
}
}
- The advantage of using JSON over CSV is that later, with One–Click Ingestion, the Azure Data Explorer ‘create table’ and ‘create json mapping’ commands will be auto-generated for you. It will save you the need to manually create the JSON table mapping again (in case you want to ingest your ongoing data with Logstash later on. The Logstash output plugin uses json mapping).
- Start Logstash with the following command, from Logstash’s bin folder:
logstash -f pipeline.conf
- If your pipeline is working correctly, you should see a series of events like the following written to the console:

- The CSV/JSON file should be created at the destination you specified in the config file.
- Ingest your data into Azure Data Explorer with One–Click Ingestion:
- Open the Azure Data Explorer web UI. If this is the first time you are creating an Azure Data Explorer cluster and database, see this doc.
- Right–click the database name and select Ingest new Data.
- In the Ingest new data page, use the Create new option to set the table name.
- Select Ingestion type from a file and browse your CSV/JSON file.
- Select Edit schema. You will be redirected to the schema of the table that will be created.
- Optionally, on the schema page, click the column headers to change the data type or rename a column. You can also double-click the new column name to edit it.
For more information about this page, see the doc.
- Select Start Ingestion to ingest the data into Azure Data Explorer.
- After a few minutes, depending on the size of the data set, your data will be stored in Azure Data Explorer and ready for querying.
Method 2: Using Logstash only
- Create an Azure Data Explorer cluster and database.
Note: If you have already created your Azure Data Explorer cluster and database, you can skip this step.
More information on creating an Azure Data Explorer cluster and database can be found here.
-
Create the destination table.
Note: If you have already created your table with One-Click Ingestion, or in other ways, skip this step.
Tip: The One-Click Ingestion tool auto-generates the table creation and the table mapping commands, based on the structure of sample JSON data you provide. If you use One-Click Ingestion with a JSON file, as described above, you can use the auto-generated commands, from the Editor section.
 Auto-generate the table and its mapping using One-Click IngestionIn the Azure portal, under your cluster page, on the left menu, select Query (or use Azure Data Explorer Web UI/Desktop application) and run the following command. This command creates a table with the name ‘MyStormEvents’, with columns according to the schema of the data.
.create tables MyStormEvents(StartTime:datetime,EndTime:datetime,EpisodeId:int,EventId:int,State:string,EventType:string)
- Create ingestion mapping.
Note: If you used One-Click Ingestion with a JSON file, you can skip this step. This mapping is used at ingestion time to map incoming data to columns inside the ADX target table.
The following command creates a new mapping, named ‘mymapping’, according to the data’s schema. It extracts properties from the incoming temporary JSON on files, that will be automatically generated later, as noted by the path, and outputs them to the relevant column.
.create table MyStormEvents ingestion json mapping 'mymapping' '[{"column":"StartTime","path":"$.StartTime"},{"column":"EndTime","path":"$.EndTime"} ,{"column":"EpisodeId","path":"$.EpisodeId"}, {"column":"EventId","path":"$.EventId"}, {"column":"State","path":"$.State"},{"column":"EventType","path":"$.EventType "}]'
- Your table is ready to be ingested with data from your existing Elasticsearch index. To ingest the historical data from Elasticsearch, you can use the Elasticsearch input plugin to receive data from Elasticsearch, and the Azure Data Explorer (Kusto) output plugin to ingest the data to ADX.
- If you have not used Logstash, you should first install it
- Install the Logstash output plugin for Azure Data Explorer, which sends the data to Azure Data Explorer, by running:
bin/logstash-plugin install logstash-output-kusto
- Define a Logstash configuration pipeline file in your home Logstash directory.
In the input plugin, you can specify a query to filter your data according to a specific time range or any other search criteria. This way, you can migrate only the data you care about.
In this example, the config file looks as follows:
input {
# Read all documents from your Elasticsearch, from index “your_index_name”
    elasticsearch {
        hosts => ["http://localhost:9200"]
		index => " your_index_name "
        query => '{ "query": { "range" : {  "StartTime" : {"gte": "2020-01-01 01:00:00.0000000", "lte": "now"}} } }'
    }
}

output {
    kusto {
        path => "/tmp/kusto/%{+YYYY-MM-dd-HH-mm }.txt"
		ingest_url => "https://<your cluster name>.<your cluster region>.kusto.windows.net”
		app_id => "<Your app id>"
		app_key => "<Your app key>"
		app_tenant => "<Your app tenant>"
        database => "<Your Azure Data Explorer DB name>"
		table => "<Your table name>"
		mapping => "<Yor mapping name>"
    }
}
- Edit your configuration pipeline file according to your Azure Data Explorer cluster details and start Logstash with the following command, from Logstash’s bin folder:
logstash -f pipeline.conf
- If your pipeline is working correctly, you should see a series of events like the following written to the console:
- After a few minutes, run the following Azure Data Explorer query to see the records in the table you defined:
MyStormEvents | count
The result is the number of records that were ingested into the table. It might take several minutes to ingest the entire dataset, depending on the size of the data set. The result of this query reflects the quantity of ingested records. Your data is now stored in Azure Data Explorer and is ready for querying!

Recent Comments