by Scott Muniz | Aug 17, 2020 | Uncategorized
This article is contributed. See the original author and article here.

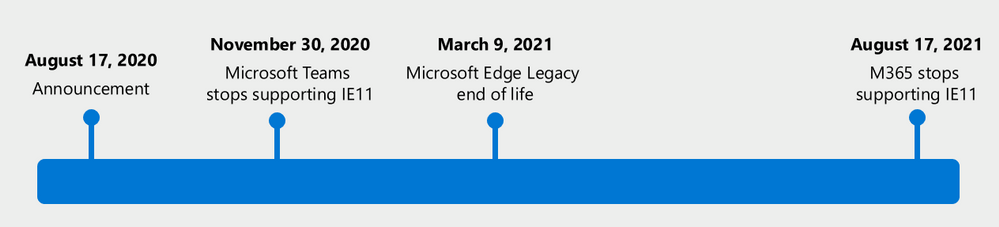
Today, we’re announcing that Microsoft 365 apps and services will no longer support Internet Explorer 11 (IE 11) by this time next year.
- Beginning November 30, 2020, the Microsoft Teams web app will no longer support IE 11.
- Beginning August 17, 2021, the remaining Microsoft 365 apps and services will no longer support IE 11.
This means that after the above dates, customers will have a degraded experience or will be unable to connect to Microsoft 365 apps and services on IE 11. For degraded experiences, new Microsoft 365 features will not be available or certain features may cease to work when accessing the app or service via IE 11. While we know this change will be difficult for some customers, we believe that customers will get the most out of Microsoft 365 when using the new Microsoft Edge. We are committed to helping make this transition as smooth as possible.
Customers have been using IE 11 since 2013 when the online environment was much less sophisticated than the landscape today. Since then, open web standards and newer browsers—like the new Microsoft Edge—have enabled better, more innovative online experiences. We believe that Microsoft 365 subscribers, in both consumer and commercial contexts, will be well served with this change through faster and more responsive web access to greater sets of features in everyday toolsets like Outlook, Teams, SharePoint, and more.
Respecting investments in IE 11 web apps
We understand the need to “do more with less” in the new business environment. By the dates listed above, customers should no longer access Microsoft 365 apps and services using IE 11, but we want to be clear that IE 11 isn’t going away1 and that our customers’ own legacy IE 11 apps and investments will continue to work. Customers have made business-critical investments in IE 11 legacy apps and we respect that those apps are still functioning.
In this moment of bridging between modern and legacy apps, many customers may feel there is no choice but to rely on a two-browser workaround of using IE 11 alongside a modern browser. However, with the new Microsoft Edge and Internet Explorer mode, customers don’t need an awkward workaround of one browser for some apps and another for other apps. They can standardize on one browser and seamlessly experience the best of the modern web in one tab while accessing a business-critical legacy IE 11 app in another tab – all housed within the new Microsoft Edge.
With native integration in Microsoft management, security, and productivity tools, we recommend the new Microsoft Edge to address our customers’ compatibility and secure remote work needs. Microsoft Edge has SmartScreen built-in and has the highest-rated phishing and malware protection as measured by two independent studies. We will also support our customers’ transition to the new Microsoft Edge with app and site compatibility assistance. As part of the App Assure promise, we have Microsoft engineers ready to help customers in case they run into compatibility issues. For more information, see the ‘Help is available’ section below.
Note: Using Internet Explorer mode in the new Microsoft Edge will not help to extend IE 11 access to Microsoft 365 apps and services beyond the dates listed above. Microsoft 365 apps and services will stop supporting IE 11 on the dates listed.
Microsoft Edge Legacy makes way for the new Microsoft Edge
Nearly two years ago, we started working on the new Microsoft Edge, listening to our customers’ needs for world-class compatibility (including legacy app support), security, privacy, easy and unified manageability, and productivity. The result is a whole new Microsoft Edge from the inside out: a browser built on the Chromium open source engine with the latest in Microsoft enterprise capabilities. Since its release in January, millions of users have upgraded their home and work browsers to the new Microsoft Edge. Additionally, new devices and future Windows feature updates (starting with Windows 10, version 20H2) will contain the new Microsoft Edge.
Now that we’ve shipped the new Microsoft Edge, and upgraded most of our Windows 10 customers to the new browser, we’re ending support for the Microsoft Edge Legacy desktop app on March 9, 2021.
- After March 9, 2021, the Microsoft Edge Legacy desktop app will not receive new security updates.
The new Microsoft Edge is our best expression of a modern browser—we’re excited for customers to experience it. Apps and sites created for Microsoft Edge Legacy will continue to work in the new Microsoft Edge, but if a compatibility issue does arise, we have our App Assure promise to provide support. For more information, see the section below.
Help is available
For customers using IE 11 to access Microsoft 365 apps and services, or using Microsoft Edge Legacy as their preferred browser, we recommend the new Microsoft Edge and offer a range of support options to help transition.
To begin, we recommend that customers first read this detailed article about how to plan for deployment. The article guides customers through key questions and offers a path forward for major steps in the transition to the new Microsoft Edge.
Next, customers should determine what type of support they are looking for, if any.
Customers with Microsoft Unified Support can reach out to that support service for help transitioning to the new Microsoft Edge.
For customers who would like guidance on how to plan, deploy, or adopt the new Microsoft Edge, there’s FastTrack. FastTrack is available at no additional charge to customers with 150 or more paid seats of Windows 10 Enterprise. To get started, submit a Request for Assistance through the FastTrack site.
And for those customers who prefer to get started on their own, we have self-guided deployment and configuration materials, complete with a series from Microsoft Mechanics, ready on our Docs site.
Finally, it is natural for customers to be concerned about compatibility when it comes to business-critical apps and sites. This is why we offer compatibility “peace of mind” with App Assure. The App Assure promise is this: if customers’ web apps and sites work on IE 11, supported versions of Google Chrome, or any version of Microsoft Edge (including Microsoft Edge Legacy), those web apps and sites should work on the new Microsoft Edge. If not, they can contact App Assure for remediation support here or by email (ACHELP@microsoft.com). Assistance is provided in Traditional Chinese and Simplified Chinese (support specialists speak Mandarin only), English, French, German, Italian, Japanese, Korean, Portuguese (Brazil), and Spanish.
Higher performance, simpler security on a single browser standard
At a time when IT professionals are being asked to do more with less on an unprecedented level, we want to make it simple for our customers to balance productivity, security, privacy, and cost.
To learn more about the new Microsoft Edge, customers can check out our website and the How to Get Started End User Guide.
We’re grateful for the trust you have placed in Microsoft through the years. We’re here to help and can’t wait for you to experience Microsoft 365 on the new Microsoft Edge.
1 Internet Explorer 11 is a component of the Windows operating system and follows the Lifecycle Policy for the product on which it is installed.
by Scott Muniz | Aug 17, 2020 | Uncategorized
This article is contributed. See the original author and article here.
SCOM performance has been one of the top user voice items over the years. It directly impacts the way our customers interact with SCOM including web console and operations console.
This blog aims to highlight specific user scenarios which we’ve addressed in SCOM 2019 release and also the ones we intend to address in subsequent SCOM releases. Such user scenarios have been highlighted by our customers which is reflected in the SCOM performance issues that our customer support team resolves frequently.
In SCOM 2019, here are some of the scenarios that have been fixed:
1. Windows computer view in SCOM console:
A few of our customers gave us the feedback that opening the Windows computer view in the SCOM console took an unreasonable amount of time. As an example, one of our customers with 1600+ windows computers reported this issue. About 1400 servers and 50 clients (engineers) were affected because of this issue. While on an average, it took about 8-10 minutes for this view to load, in the extreme cases it took more than 20 minutes.
Given our customers are dependent on SCOM to provide timely information including but not limited to alerts, health and performance metrics of their applications and workloads, the performance of SCOM console is critical for customers’ monitoring experience. To decrease the load time for this view, we optimized the SQL query relevant to this view.
2. Changing the settings of a User Role
One of our customer had an environment with a lot of user roles, views, classes and relationship types in the database. The customer reached out to System Center team and explained that on an average, changing the settings of a user role, for instance, providing or revoking permissions on specific views or dashboards to a specific user role, took about 30minutes.
Further research suggested that many other SCOM customers with similar environment also experience similar problem. In fact, many customers concurred that changing setting of, say, 15-20 user roles took an entire day that impacted their productivity and ability to use SCOM console effectively. At a high level, the SQL queries that fetched relevant data and eventually helped change the settings of a user role was optimized. This optimization led to significant improvements in the load time for our customers.
3. Grooming of Maintenance Mode Staging Table
Our customer support team received a case from our customer that SCOM Operations Manager Datawarehouse grooming (emptying) of maintenance mode staging table was not occurring. This essentially meant that the table grew every day into millions of rows which eventually filled up the database that could potentially lead to additional cost to the customer to spin up a new database.
Furthermore, the increase in utilization of database is usually correlated with decrease in performance of SCOM console. To fix this issue we added an index to the maintenance mode stable table. This ensured that proper grooming of the table happened.
4. SDK service not starting and severe perf degradation leading to SCOM console not loading
While the technical details of the above mentioned issues are beyond the scope of this blog, suffice to say that a couple of SQL queries running in the backend were causing the above mentioned issues. In fact, a few our customers mentioned that they faced severe performance degradation since they upgraded from SCOM 1807 to 2019. The SCOM console took a long time to load and when it did even the basic tasks such as adding a management server to management group couldn’t be completed. To fix this issue, we optimized the SQL queries relevant to these issues which lead to significant performance improvement.
5. Reliability and performance improvement in XPlat agent
Prior to 2019, monitoring data related to health and performance were fetched through requests running in the same thread in the back end. Due to this design, any flaws in the perf channel affected the heartbeat requests and vice versa. This often led to system going into greyed out state.
In 2019, we isolated heartbeat threads from performance data related threads which meant that any malfunctioning in performance providers would not affect heartbeat request, thereby improving reliability of SCOM.
We also introduced filters in XPlat MPs to help customers in customizing their discovery and monitoring scope to entities of interest. With this filter, customers can define OMI queries to limit their workloads. For instance, in the SuSE platform there is a file system called “RaiserFS” which is not supported in core XPlat MPs, yet this file system was discovered with inappropriate performance data. Similarly, in case of hypervisor and container environments, large set of logical entities are created which should not monitored. This happens because of generic nature of XPlat agent which discovers all these entities. With the introduction of filters in Xplat MPs, discover and monitoring of all such entities can be fine-tuned further to improve performance and scale of XPlat agent.
If you have faced above mentioned issues in your SCOM environment, please let us know your current experience. Many of our customers are still using SCOM 2012 and SCOM 2016. Given that we will continue to make significant investment into improving SCOM performance in 2020, we strongly recommend that you upgrade your environment to the SCOM 2019 Update Rollup 1 to get better performance.
Lastly, in 2020, we’re planning to invest into improving performance of SCOM consoles for other top user scenarios such as alert, health and performance views.
by Scott Muniz | Aug 17, 2020 | Uncategorized
This article is contributed. See the original author and article here.
Final Update: Monday, 17 August 2020 11:51 UTC
We’ve confirmed that all systems are back to normal with no customer impact as of 08/17, 11:15 UTC. Our logs show the incident started on 08/17, 07:50 UTC and that during the 3 hours and 25 minutes that it took to resolve the issue customers using Activity Log Alerts in Azure China experienced issues with delayed alerts up to 2 hours and 50 minutes. Alerts would have eventually fired.
-
Root Cause: The failure was due to issues with one of the backend services.
-
Incident Timeline: 3 Hours & 25 minutes – 08/17, 07:50 UTC through 08/17, 11:15 UTC
We understand that customers rely on Activity Log Alerts as a critical service and apologize for any impact this incident caused.
-Jayadev
by Scott Muniz | Aug 17, 2020 | Azure, Microsoft, Technology, Uncategorized
This article is contributed. See the original author and article here.
Azure Synapse Analytics is a limitless data analytics service that enables you to analyze data on Azure Data Lake storage. It provides managed Apache Spark and T-SQL engines (provisioned and serverless) for analyzing data.
In this article, you will see how you can create a table that references data on external Azure Data Lake storage in order to enable the client applications such as Power BI to create reports on Data Lake information. The data set is placed on Azure storage and formatted as parquet, but client applications can access these data as any other table without need to know where is stored actual data.
Prerequisite
To try this sample, you need to have Azure Synapse Analytics workspace. If you don’t have one you can easily deploy it using Azure portal or this Deployment template. Workspace automatically deploys one serverless Synapse SQL endpoint that is everything we need for this kind of analysis. With the workspace you are also getting easy-to-use Web UI called Synapse Studio that enables you to start analyzing the files directly from your browser.
NOTE: You need Synapse SQL serverless (on-demand) query endpoint to execute the code in this article.
COVID data set
In this sample is used the latest available public data on geographic distribution of COVID-19 cases worldwide from the European Center for Disease Prevention and Control (ECDC). Each row/entry contains the number of new cases reported per day and per country. For more information about this dataset, see here. Data set is updated on daily basis and placed as a part of Azure Open Dataset.
Configuring data sources and formats
As a first step you need to configure data source and specify file format of remotely stored files.
CREATE EXTERNAL DATA SOURCE ecdc_cases WITH (
    LOCATION = 'https://pandemicdatalake.blob.core.windows.net/public/curated/covid-19/ecdc_cases/'
);

CREATE EXTERNAL FILE FORMAT ParquetFormat WITH (  FORMAT_TYPE = PARQUET );
First statement creates data source that references ECDC COVID data set, while the second specifies parquet file format.
Exploring file schema
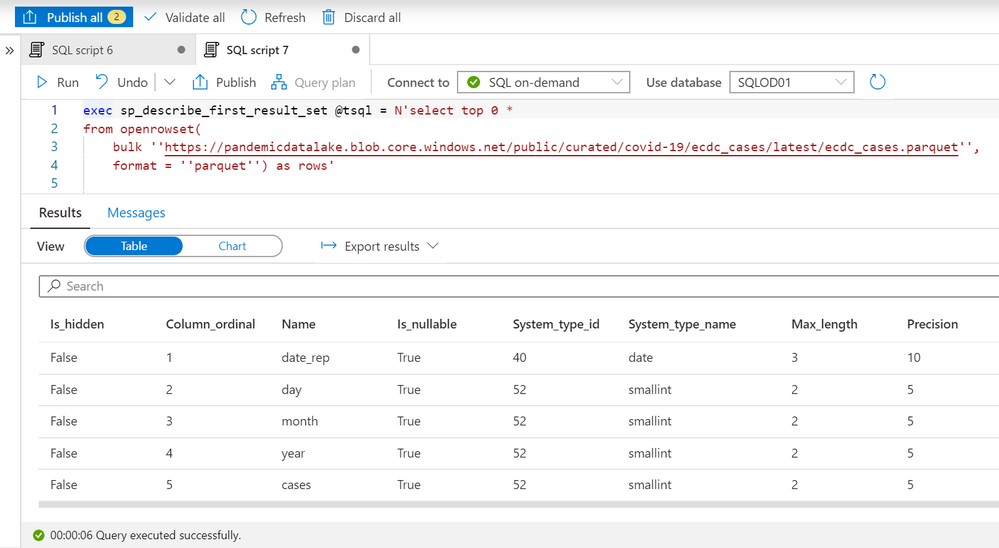
Now you need to determine what are the columns in the external files and what are their types. In the previous article you might have seen that OPENROWSET function enables you to quickly explore data in the files placed on Azure storage. We can also use sp_describe_first_result_set function to identify the schema that will be used for the table by providing the OPENROWSET data exploration query to this procedure:

The most important columns are name and system_type_name that we can use to create schema of external table that references this file. The easiest way to use these information to create a table is to export data in Excel, hide the columns between name and system_type_name and copy the values:

Creating an external table
Now we have all elements required to create a table. I will create one schema (this is optional but recommended), paste the results that I copied from Excel, and reference data_source/file_format that I created in the previous step:
create schema ecdc

go

create external table ecdc.cases (
    date_rep        date,
    day    smallint,
    month             smallint,
    year  smallint,
    cases smallint,
    deaths            smallint,
    countries_and_territories       varchar(8000),
    geo_id             varchar(8000),
    country_territory_code           varchar(8000),
    pop_data_2018           int,
    continent_exp             varchar(8000),
    load_date      datetime2(7),
    iso_country   varchar(8000)
) with (
    data_source= ecdc_cases,
    location = 'latest/ecdc_cases.parquet',
    file_format = ParquetFormat
);
The only additional information that I need to provide is the location of the files that this external table references.
IMPORTANT: You need to run this statement in some database other than master! Master database don’t allow you to create objects (schemas, tables).
Now, we can read the content of external files using this table:

The query is executed via Synapse Studio, but I can use any other tool like PowerBI, Excel, SSMS, ADS to query my external table.
Conclusion
External tables in Azure Synapse SQL query engine represent logical relational adapter created on top of externally stored files that can be used by any application that use TSQL to query data. This way you can build a Logical Data Warehouse on top of your data stored in Azure Data Lake without need to load data in standard relational table. Azure Synapse SQL Logical Data Warehouse enables you to represent external data sources as standard tables and let you analytic/reporting applications access any data without need to know where the data is place and hot to parse the data structure.
You can find more details about the external tables in Azure Synapse documentation.
by Scott Muniz | Aug 17, 2020 | Uncategorized
This article is contributed. See the original author and article here.
Hi, Jonas here!
Or as we say in the north of Germany: “Moin Moin!”
I am a Customer Engineer based in Germany and a while back I was asked about the software inventory (SINV) throttling process and if it can be adjusted to perform a little faster without any noticeable impact to the user experience.
Yes, I know, not the newest ConfigMgr/MECM feature and if you had the same question in the past, you might find several resources talking about disabling the throttling mechanism completely, so my first answer to the above question was: “No, not possible!”.
But the customer let not go and asked about a timeout value he found in the InventoryAgent.log and if at least that could be adjusted to improve the process.
So, I started digging and this blog post is the summary of my findings.
TL;DR
Software Inventory (SINV) can be slow on some machines and might not finish at all, because of the internal throttling behavior of SINV, which was implemented to keep the system as responsive as possible for the user using the system.
The throttling mechanism can be adjusted to fit the needs of your environment and this blog post is intended to point you in the right direction.
You will find a link to a git repository at the bottom with some resources I am explaining in the “PowerShell to the help” section.
If you do not intent to change anything about SINV or not using it at all, you will at least learn how throttling the SINV process works ;)
How the ConfigMgr Client is throttling SINV:
Software Inventory is using three different tasks to perform the software inventory scan.
One task to look for files, one task to grab files if activated in client settings and one task to put the data in WMI.
Each task has its own throttling profile which is stored in the default client policy.
A profile ID for such task like “{C0ED66AD-8194-49fd-9826-D0DD38AB7DAA}” is what you normally see in the InventoryAgent.log during SINV scans.
Each profile has several different throttling thresholds which all define when throttling should be activated or deactivated.
The three WMI instances look like this:
(with the default values)
Task profile 1:
instance of CCM_Service_ResourceProfileInformation
{
// File System Collection Task – processing SINV WMI instances
ProfileID = “{C0ED66AD-8194-49fd-9826-D0DD38AB7DAA}”;
// BatchSize not used
ControlUsage = true;
OnAC_PercentageOfTimeoutToWait = 50;
OnAC_EvaluationPeriodLengthSec = 60;
OnAC_IdlePeriodLengthSec = 120;
OnAC_MinIdleDiskPercentage = 0;
OnAC_ConsiderUserInputAsActivity = true;
OnBattery_BehaviorType = 1;
OnLowBattery_BehaviorType = 0;
};
Task profile 2:
instance of CCM_Service_ResourceProfileInformation
{
// File Collection Task – processing FILECOLL WMI instances
ProfileID = “{CE22C5BA-165D-4b93-BC73-926CE1BD9279}”;
// BatchSize not used
ControlUsage = true;
OnAC_PercentageOfTimeoutToWait = 50;
OnAC_EvaluationPeriodLengthSec = 60;
OnAC_IdlePeriodLengthSec = 120;
OnAC_MinIdleDiskPercentage = 0;
OnAC_ConsiderUserInputAsActivity = true;
OnBattery_BehaviorType = 1;
OnLowBattery_BehaviorType = 0;
};
Task profile 3:
instance of CCM_Service_ResourceProfileInformation
{
// File System Query Task – actual filesystem crawl for SINV/FILECOLL
ProfileID = “{58E2FE09-07BB-4adb-8A93-E49C5BF2301F}”;
ControlUsage = true;
BatchSize = 100;
OnAC_PercentageOfTimeoutToWait = 50;
OnAC_EvaluationPeriodLengthSec = 60;
OnAC_IdlePeriodLengthSec = 120;
OnAC_MinIdleDiskPercentage = 30;
OnAC_ConsiderUserInputAsActivity = true;
OnBattery_BehaviorType = 1;
OnLowBattery_BehaviorType = 0;
};
Where to find the task profiles:
Each task profile can be found in the default client policy and the class “CCM_Service_ResourceProfileInformation”.
The default SINV profile policies will be imported during ConfigMgr Client installation and they are not part of the policies from your Site.
Default class location:
ROOTccmPolicyDefaultMachineRequestedConfig:CCM_Service_ResourceProfileInformation
Actual settings location:
ROOTccmPolicyMachineActualConfig:CCM_Service_ResourceProfileInformation
What all those settings mean:
I did several tests with each setting and ask several colleagues but wasn’t able to find a clear description of each setting. So, the list is the result of my testing process and might not be 100% accurate. Please keep that in mind if you want to try out some settings for yourself.
|
Setting
|
Description
|
|
ControlUsage = true
|
True = throttling active
False = throttling disabled
That’s what you normally find online as a solution to speed up slow software inventory processing. But without throttling, the user might experience a terribly slow machine.
|
|
BatchSize = 100
|
Size of operations per Interaction.
Does not seem to have an effect if the disk is not idle and throttling is active.
|
|
OnAC_PercentageOfTimeoutToWait = 50
|
From what I saw during my tests it looks like this value is the percentage of the overall timeout per task. If the percentage is reached, the system seems to check if throttling is still need or needs to be applied.
In the InventoryAgent.log you see entries similar to this:
Timeout for: C0ED66AD-8194-49fd-9826-D0DD38AB7DAA = 7200 sec
Timeout for: 58E2FE09-07BB-4adb-8A93-E49C5BF2301F = 1440 sec
So, 50% of 7200 seconds is 3600 seconds after which the throttling would be evaluated again. But I am not 100% sure about that.
|
|
OnAC_IdlePeriodLengthSec = 120
|
Seconds the disk needs to be at 30% usage before throttling will be cancelled and SINV runs at full speed again.
The 30% value comes from the „OnAC_MinIdleDiskPercentage = 30“ setting. (See next row)
|
|
OnAC_MinIdleDiskPercentage = 30
|
See description in row above.
|
|
OnAC_ConsiderUserInputAsActivity = true
|
True means, if the user is working on the system software inventory should be throttled. If set to false user input will not be evaluated and software inventory will not be throttled based on that.
|
|
OnBattery_BehaviorType = 1
|
IMPORTANT:
This value needs to be the same for all three task profiles otherwise software inventory might not work.
I am not 100% sure, but it looks like a value of 1 means that the system will use the same throttling behavior if the system runs on battery as if it would be running on AC.
|
|
OnLowBattery_BehaviorType = 0
|
IMPORTANT:
This value needs to be the same for all three task profiles otherwise software inventory might not work.
I am not 100% sure, but it looks like a value of 0 means that the system will not scan at all on low battery.
|
|
Settings without values
|
There are more settings in each task profile, but those are not set, and I haven’t tested anything with them.
List of settings without values:
OnBattery_ConsiderUserInputAsActivity
OnBattery_EvaluationPeriodLengthSec
OnBattery_IdlePeriodLengthSec
OnBattery_MinIdleDiskPercentage
OnBattery_PercentageOfTimeoutToWait
OnLowBattery_BehaviorType
OnLowBattery_ConsiderUserInputAsActivity
OnLowBattery_EvaluationPeriodLengthSec
OnLowBattery_IdlePeriodLengthSec
OnLowBattery_MinIdleDiskPercentage
OnLowBattery_PercentageOfTimeoutToWait
|
Test setup:
After several tests I found the task: „File System Query Task – actual filesystem crawl for SINV/FILECOLL“ with ProfileID “{58E2FE09-07BB-4adb-8A93-E49C5BF2301F}” to be the one with the most impact on overall speed and focused my testing on that task.
My goal was to find the most promising values to get an idea how to use those in a production environment.
I created two folders, one with 50 and one with 180 exe files in it and used those in my software inventory client setting.
(But you might need much more files and folders to see an effect during you tests. Ideally use a system with slow SINV processing described in section “How to find the correct values for your environment”.
I then changed different values for that profile and tested how long the scan process takes. Since I was only testing with such small number of files, I did not saw any decrease on machine performance, but If you like to test that for yourself, you might need to monitor system performance to avoid slowing the system down.
Since that’s the whole point of throttling, to keep the system as performant as possible to not annoy the user working on that machine during a SINV scan.
Values I used and test results:
(See description of settings in list above)
|
Setting
|
Overall
scan time
|
Description
|
|
Default (no changes)
|
~500-600 seconds
|
Both folders were scanned in about 500-600 seconds. The folder with just 50 files was scanned in just 3 seconds and the rest of the time was used for the second folder with 180 files.
The overall time can be even longer if DiskUsage is above the threshold (see table above) and throttling is used more often.
|
|
ControlUsage = false
|
~4 seconds
|
With throttling disabled both folders have been scanned in around 4 seconds.
Which is nice, but the machine might be not as responsive as the user working with it would like it to be.
|
|
BatchSize = 200
(default = 100)
|
~4 seconds
|
Both folders were scanned in about 4 seconds and the reason seems to be the lower file count than the batch size of 200.
Software inventory will keep the throttling (on or off) for each batch. So
The overall time can be much longer if DiskUsage is above the threshold (see table above).
|
|
OnAC_ConsiderUserInputAsActivity = FALSE
(default = true)
|
~200 seconds
|
If user input is ignored, the scan will still be throttled, but it is much faster than with the default settings.
The overall time can be much longer if DiskUsage is above the threshold (see table above).
|
|
OnAC_ConsiderUserInputAsActivity = FALSE
(default = true)
OnAC_PercentageOfTimeoutToWait = 4
(default = 50)
|
~65 seconds
|
If user input is ignored and the percentage of the timeout is set to a small value, the overall process is much faster.,
The overall time can be much longer if DiskUsage is above the threshold (see table above).
|
|
OnAC_IdlePeriodLengthSec = 100
(default = 120)
|
~6 – 300 seconds
|
If we decrease the IdlePeriodLengthSec and let the DiskUsage be checked more frequently, the overall speed can be vary between 6 and 300 seconds depending on the actual DiskUsage value at the moment of measurement.
|
How to find the correct values for your environment:
Before changing any setting described above, you should definitely review your client settings and all the paths you set for SINV. Because I have seen how several customers have scanned paths that are not needed or the collected data was not used at all. So, disabling SINV or a simple exclusion of some path can be enough.
For example, if you are scanning a path for a well-known managed application, you might have data about the app already, either via hardware inventory or via application deployment status and another dataset via SINV might not be needed.
Simply place a file called: “Skpswi.dat” (with no content in it) in the folder you want to exclude.
You should also check all systems with missing or old SINV data for errors before changing the throttling profiles and maybe making things worse.
Use the following collection query to find systems with old (30 days) or no SINV data for further analysis:
|
select SMS_R_SYSTEM.ResourceID, SMS_R_SYSTEM.ResourceType, SMS_R_SYSTEM.Name, SMS_R_SYSTEM.SMSUniqueIdentifier,SMS_R_SYSTEM.ResourceDomainORWorkgroup, SMS_R_SYSTEM.Client from SMS_R_System where SMS_R_SYSTEM.ResourceID not in (select SMS_G_System_LastSoftwareScan.ResourceID from SMS_G_System_LastSoftwareScan where SMS_G_System_LastSoftwareScan.LastScanDate >= DateAdd(dd,-30,GetDate()))
|
If you still need to speed up the SINV process, you should pick some systems you can test on (ideally from the collection query above) and test with the following settings by using the “Set-SINVThrottlingPolicy.ps1” script you will find in the repository below.
- OnAC_ConsiderUserInputAsActivity
- OnAC_PercentageOfTimeoutToWait
- OnAC_IdlePeriodLengthSec
Test different values for the settings to find the optimal configuration and to find a good balance between speed and usability of the system so that you receive no complaints about system performance during SINV scans from your end users.
PowerShell to the help:
The following repository: LINK contains five files to help you with testing and to implement the solution as a ConfigMgr baseline if you like.
IMPORTANT: The provided values in the script might not be the best choice for your environment and are only meant as an example!
File #1: Set-SINVThrottlingPolicy.ps1
The script is intended to run as part of a ConfigMgr compliance setting and is designed as a detection or remediation script depending on the value of the “$Remediate” variable.
For testing purposes simply run the script locally on the system in PowerShell ISE opened as an admin.
You only need to adjust the following section to your needs:
|
#region variables
[bool]$Remediate = $false
#endregion
#region CUSTOM Settings Profile {58E2FE09-07BB-4adb-8A93-E49C5BF2301F} for file system query task – actual filesystem crawl for SINV/FILECOLL
# Custom settings
[hashtable]$SINVCUSTOMProfileSettings = [ordered]@{
BatchSize = 100;
OnAC_PercentageOfTimeoutToWait = 10;
OnAC_EvaluationPeriodLengthSec = 20;
OnAC_IdlePeriodLengthSec = 30;
OnAC_MinIdleDiskPercentage = 30;
OnAC_ConsiderUserInputAsActivity = $false;
}
#endregion
|
Change the values of $SINVCUSTOMProfileSettings to the values you prefer (see description in section: “Values I used and test results”) and set the $remediate variable as needed.
$Remediate = $false
The script will not set the custom policy and will simply output true or false if the desired settings are set or not. (can be used as detection script in a ConfigMgr compliance item)
$Remediate = $true
The script will set the custom policy if it does not exist or will change the values an existing policy to what you have defined in $SINVCUSTOMProfileSettings.
(can be used as remediation script in a ConfigMgr compliance item)
File #2: Delete-SINVThrottlingPolicy.ps1
The script will either detect the custom SINV policy or delete the policy depending on the value of the variable $Remediate and the script is also designed to run as a ConfigMgr compliance item.
File #3: CI-SetSINVThrottlingPolicy.cab
File #4: CI-DeleteSINVThrottlingPolicy.cab
Both files contain one compliance item which can be imported into ConfigMgr and which then can be used in a compliance baseline to check, set or delete the policy on multiple machines.
They contain the scripts described above.
File #5: SINV-Throttling-Profile.filterset
One of my favorite troubleshooting tools is the: “Support Center for Configuration Manager” which is part of the ConfigMgr installation since version 1810.
The documentation can be found here: LINK
I added a “filterset” file: “SINV-Throttling-Profile.filterset” to the repository which can be imported into “Support Center Log File Viewer“, to then filter SINV related events and to make testing the throttling settings much easier.
Open “InventoryAgent.log“, “FileSystemFile.log” and “PolicyAgentProvider.log”
at once with “Support Center Log File Viewer” and import the filterset file in the “Advanced filter” menu via “Load filters”. You are now able to validate the changes made by the script above by triggering software inventory from the ConfigMgr client applet.
Any change on the policy with the script or via the configuration items should be visible in “PolicyAgentProvider.log” with the following log entry:
— [1] __InstanceModificationEvent settings change on object CCM_Service_ResourceProfileInformation.ProfileID=”{58E2FE09-07BB-4adb-8A93-E49C5BF2301F}”.
Conclusion:
It is possible to speed up the SINV process in ConfigMgr without disabling SINV throttling completely but cleaning up the SINV client settings should be the first priority.
Good testing with the tools I provided is also a necessary step to not make the problem worse.
Have fun with the solution and let me know what you think about it.
Best regards
Jonas Ohmsen
Microsoft Germany
Disclaimer:
This posting is provided “AS IS” with no warranties, and confers no rights
Resources:
Download the whole solution or clone the repository here:
https://github.com/jonasatgit/scriptrepo/tree/master/SINV
Support Center for Configuration Manager:
https://docs.microsoft.com/en-us/mem/configmgr/core/support/support-center

Recent Comments