by Scott Muniz | Jul 14, 2020 | Azure, Microsoft, Technology, Uncategorized
This article is contributed. See the original author and article here.
Intro
In this blog I want to give a very condensed overview of key architecture patterns for designing enterprise data analytic environments using Azure PaaS.
This will cover:
1 Design Tenets
2 People and Processes
3 Core Platform
3.1 Data Lake Organisation
3.2 Data Products
3.3 Self Service Analytics
4 Security
5 Resilience
6 DevOps
7 Monitoring and Auditing
8 Conclusion
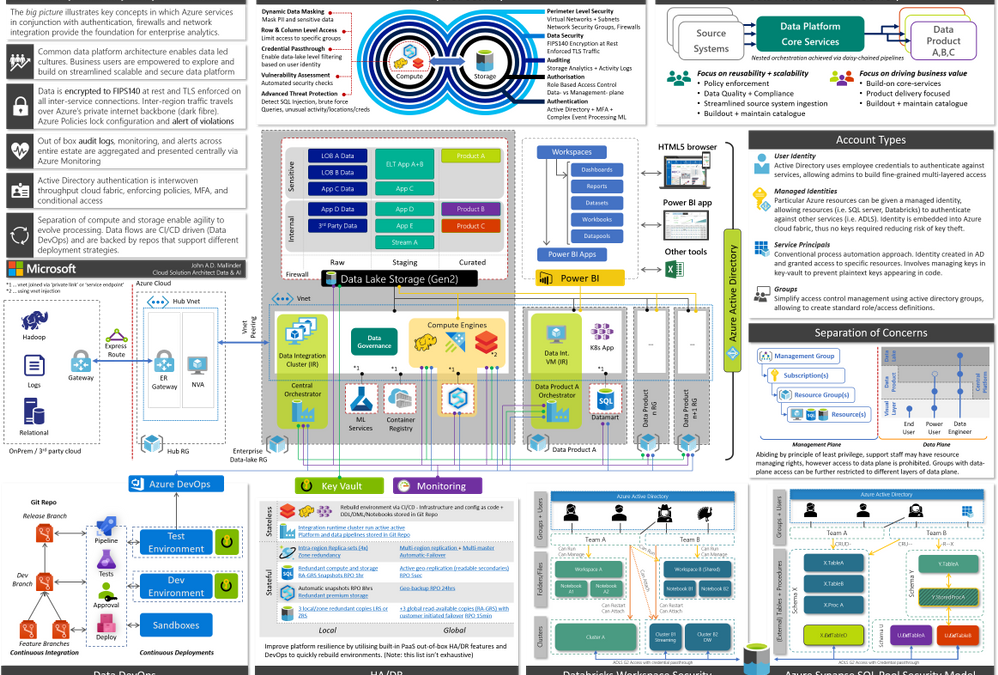
This blog is primarily aimed at decision makers, leadership, and architects. By the end you should be able to narrate the big picture below by having a basic understanding of key patterns, how Azure enforces governance yet accelerates development via self-service and DevOps, a clear prescriptive solution, and an awareness of relevant follow-up topics. This will provide a broad high-level overview of running an analytics platform in Azure. Links to detailed and in-depth material will be included for further reading. Whilst there is a lot of information, we will dissect and discuss piece by piece.
The architecture presented here is based on real-world deployments using GA services with financially backed SLAs and support.
When Azure Synapse, the unified analytics service that provides a service of services to streamline the end to end journey of analytics into a single pane of glass, goes fully GA we’ll be able to further simplify elements of the design.
This architecture has been adjusted over time to account for various scenarios I’ve encountered with customers, however I should call out some organisations require more federation and decentralisation, in which cases a mesh architecture may be more suitable.

Figure 1, full version in attachment
Operating an enterprise data platform is the convergence of data-ops, security, governance, monitoring, scale-out, and self-service analytics. Understanding how these facets interplay is crucial to appreciate the nuances that make Azure compelling for enterprises. Let us start by defining core requirements of our platform.
1 Design Tenets
| 1. Self-Service |
We want to support power-users and analysts, with deep business operational understanding, to allow them to view data in context of other data sets and derive new insights. Thus, creating a culture where data-led decisions are encouraged, short circuiting bureaucracy and long turnaround times. |
| 2. Data Governance |
As data becomes a key commodity within the organisation it must be treated accordingly. We need to understand what data is, its structure, what it means, and where it is from regardless where it lives. Thus, creating visibility for users to explore-, share-, and reuse- datasets. |
| 3. Holistic Security |
We want a platform which is secure by design – everything must be encrypted in transit and at rest. All access must be authorised and monitored. We want governance controls to continuously scan our estate and ensure it is safe and compliant. |
| 4. Resilience |
We want self-healing capabilities that can automatically mitigate issues and pro-actively contact respective teams. Reducing downtime and manual intervention. |
| 5. Single Identity |
We want to use single-sign-on across the estate, so we can easily control who has access to the various layers (platform, storage, query engines, dashboards etc) and avoid the proliferation of ad-hoc user accounts. |
| 6. Scalable by Design |
We want to be able to efficiently support small use-cases as well as pan-enterprise projects scaling to PBs of data, whether it is a handful- or 1000s of users. |
| 7. Agility |
Aka a modular design principle, we need to be able to evolve the platform as and when new technologies arrive on the market without having to migrate data and re-implement controls, monitoring, and security. Layers of abstraction between compute and storage decouple various services making us less reliant on any single service. |
| 8. DevOps |
We want to streamline and automate as many deployment processes as possible, to increase platform productivity. Every aspect of the platform is expressed as code and changes are tested and reviewed in separate environments. Deployments are idempotent allowing us to continuously add new features without impacting existing services. |
2 People and Processes
The architecture covers people, processes, and technology – in this section we are going to start with the people and identify how groups work together.
We define three groups, Data Platform Core Services (DPCS), Cloud Platform Team (CPT), and Data Product teams. The DPCS and data product groups consist of multiple scrum teams, who in turn have a mix of different specialists (data -analyst, -engineer, -scientist, -architect, tester, and scrum master) tailored to their remit and managed by a platform or analytics manager.

Data Platform Core Services (DPCS) primary focus is to think in terms of data democratisation and platform reusability. This translates to building out a catalogue of data assets (derived from various source systems) and monitor the platform with respect to governance and performance. It is essential that DPCS sets up channels to collect feedback using a combination of regular touchpoints with stakeholders and DevOps feedback mechanisms (i.e. GitHub bug/feedback tickets). A key success measure is the avoidance of duplicate integrations to the same business-critical systems.
DPCS scrum teams are aligned to types of source system (i.e. streaming, SAP, filesystem) and source domain (i.e. HR, finance, supply chain, sales etc.). This approach requires scrum teams to be somewhat fluid as individuals may need to move teams to cater to required expertise.
 Onboarding a new data source is typically the most time-consuming activity, due to data and network integration, capacity testing, and approvals. Crucially however, these source integrations are developed with reusability in mind, in contrast to building redundant integrations per project. Conceptually, sources funnel into a single highly scalable data lake that can be mounted by several engines and support granular access controls.
DPCS can be thought of as an abstraction layer from source systems, giving data product teams access to reusable assets. Assets can be any volume, velocity, or variety.
DPCS heavily leans on services and support provided by the Cloud Platform Team (CPT) which own the overall responsibility of the cloud platform and enforcement of organisation wide policies. CPT organisation and processes has been covered extensively in Azure Cloud Adoption Framework (CAF).
The third group represents the Data Product teams. Their priority is delivering business value. These teams are typically blended with stakeholders and downstream teams to create unified teams that span across IT and business and ensure outcomes are met expediently. In the first instance these groups will review available data sources in the data catalogue and consume assets where possible. If a request arises for a completely new source, they proceed by engaging DPCS to onboard a new data source. Subject to policies, there may be scenarios where data product teams can pull in small ad-hoc datasets directly, either because it is too niche or not reusable.
A data product is defined as a project that will achieve some desired business outcome – it may be something simple such as a report, ad-hoc analysis in spark all the way up to a distributed application (i.e. Kubernetes) providing data services for downstream applications.
There is a lot to be said here about people and processes, however in the spirit of conciseness we will leave it at the conceptual level. CIO.com and Trifacta provide additional interesting views on DataOps and team organisation.
This partnership between DPCS and various Data Product teams is visualised below.
3 Core Platform

The centre represents the core data platform (outlined by the red box) which forms one of the spokes from the central hub, which is a common architectural pattern. The hub resource group on the left is maintained by the cloud platform team and acts as the central point of logging, security monitoring, and connectivity to on-prem environments via express route or site-to-site VPN. Thus, our platform forms an extension of the corporate network.
Our enterprise data platform ‘spoke’ provides all the essential capabilities consisting of:
| Data Movement |
Moving and orchestrating data using Azure Data Factory (ADF) allows us to pull data in from 3rd party public + private clouds, SaaS, and on-prem via Integration Runtimes enabling central orchestration. |
| Data Lake |
Azure Data Lake Storage Gen2 (ADLS G2) provides a resilient scalable storage environment, that can be accessed from native and 3rd party analytic engines. Further if has built in auditing, encryption, HA, and enforces access control. |
| Analytic Engines |
Analytic compute engines provide a query interface over data (i.e. Synapse SQL, Data Explorer, Databricks (Spark), HDInsight (Hadoop), 3rd party engines etc.) |
| Data Catalogue |
Data cataloguing service to discover and classify datasets for self-service (Azure Data Catalogue Gen2, Informatica, Collibra and more) |
| Visualisation |
Using Power Bi to enable citizen analytics by simplifying consumption and creation of analytics to present reports, dashboards, and publish insights across the org |
| Key Management |
Azure Key vault securely store service principal credentials and other secrets which can be used for automation |
| Monitoring |
Azure Monitor aggregates logs and telemetry from across the estate and surfaces system health status via single dashboard |
| MLOps |
Azure Machine Learning provides necessary components to support AI/ML development, model life cycle management, and deployment activities using DevOps methodology
|
Crucially, all PaaS services mentioned above are mounted to a private virtual network (VNET, blue dotted box) via service endpoints and private links. Which allows us to lock-down access to within our corporate network, blocking all external endpoints/traffic.
This core platform is templated and deployed as code via CI/CD, and Azure Policies are leveraged to monitor and enforce compliance over time. A sample policy may state all firewalls must block all incoming ports, and all data must be encrypted regardless of who is trying to make these changes including admins. We will further expand on security in the next segment.
Data Product teams may just need a UI to run some queries, at which point they can use the DPCS analytic engines (Azure Synapse, Databricks, HDInsight etc.). Analytic engines expose mechanisms to deny and allow groups access to different datasets. In Azure Databricks for instance we can define which groups can access (attach), and control (restart, start, stop) individual compute clusters. Other services such as Azure Data Explorer, and HDInsight expose similar constructs.
What about Azure Synapse?
The majority of essential capabilities above are streamlined into a single authoring experience within Azure Synapse, greatly simplifying overall management and creation of new data products. Whilst providing support for new features such as on-demand SQL.

Whilst Azure has over 150 services to cater for all sorts of requirements, our core analytic platform provides all key capabilities to enable an end to end enterprise analytics using a handful of services. From a skills standpoint teams can focus on building out core expertise as opposed to having to master many different technologies.
As and when new scenarios arise, architects can assess how to complement the platform and expand capabilities shown in the diagram below.

Figure 2, capability model adapted from Stephan Mark-Armoury. This model is not exhaustive.
3.1 Data Lake Organisation
The data lake is the heart of the platform and serves as an abstraction layer between the data layer and various compute engines. Azure Data Lake Storage Gen2 (ADLS G2) is highly scalable and natively supports the HDFS interface, hierarchical folder structures, and fine-grained access control lists (ACLs), along with replication, and storage access tiers to optimise cost.
This allows us to carve out Active Directory groups to grant granular access, i.e. who can read or write, to different parts of the data-lake. We can define restricted areas, shared read-only areas, and data product specific areas. As ADLS G2 natively integrates with Azure Active Directory we can leverage SSO, for access and auditing.
 Figure 3, an ADLS G2 account with three file systems (raw, staging, and curated), data split by sensitivity. Different groups have varying read-write access to different parts of the lake.
Data lake design can get quite involved and architects must settle for a logical partitioning pattern. For instance, a company may decide to store data by domain (finance, HR, engineering etc.), geography, confidentiality etc.
Whilst every organisation must make this assessment for themselves, a sample pattern could look like the following:
{Layer} > {Org | Domain} > {System} > {Sensitivity} > {Dataset} > {Load Date} > [Files]
I.e. Raw > Corp > MyCRM > Confidential > Customer > 2020 > 04 > 08 > [Files]
The Hitcher Hikers Guide to the Data-lake is an excellent resource to understand different considerations that companies need to make.
3.2 Data Products
If a DP team needs a more custom setu p, they can request their own resource group which is mounted to the DPCS VNET. Thus, they are secured and integrated to all DPCS services such as the data-lake, analytic engines etc. Within their resource group they can spin up additional services, such as a K8S environment, databases etc. However, they cannot edit the network or security settings. Using policies DPCS can enforce rules on these custom deployed services to ensure they adhere to respective security standards.
There are various reasons for DP teams to request their own environment:
- federated layout – some groups want more control yet still align with core platform and processes
- highly customised – some solutions require a lot of niche customisation (e.g. optimisation)
- solutions that require a capability that is not available in the core platform
In short DP teams can consume data assets from the core platform, and process them in their own resource group which can represent a data product.

Figure 4 deploying additional data products that require custom setup
In a separate blog I discuss how enterprises may employ multiple Azure Data Factories to enable cross-factory integration.
3.3 Self Service Analytics
Self-service analytics has been a market trend for many years now with PowerBI being a leader, empowering analysts and the like to digest and develop analytics with minimal IT intervention .
Users can access data using any of the following methods:
| PowerBI |
Expose datasets as a service – DPCS can establish connections to data in Power BI allowing users to discover and consume these published datasets in a low-no-code fashion, join, prepare, explore, and build reports and dashboards. Using the ‘endorsement’ feature within Power BI DPCS can indicate whether content is certified, promoted or not. Alternativel y, users can define and build their own ad-hoc data sets within Power BI.

|
| ADF Data Flows |
Azure Data Factory Mapping- (visual spark) and wrangling- (power query) data flows provide a low-/no-code experience to wrangle data and integrate as part of a larger automated ADF pipeline. |
| Code first query access |
Power-users may demand access to run spark or SQL commands. DPCS can expose this experience using any of their core platform analytic engines. Azure Synapse provides on-demand spark and SQL interfaces to quickly explore and analyse several datasets. Azure Databricks provides a premium spark interface. By joining the respective Azure Active Directory group (AAD) access to different parts of the system can be automated subject to approval. DPCS can apply additional controls in the analytic engine, i.e. masking sensitive data, hiding rows or columns etc. |
| Direct storage access |
The data-lake supports POSIX ACLs, some groups such as data engineers may request read access to some datasets and read/write access to others, for instance their storage workspace (akin to a personal drive), by joining respective AAD groups. From there they can mount it into their tool of choice.
|
4 Security
As mentioned earlier the architecture leverages PaaS throughout and is locked down in order to satisfy security requirements from security conscious governments and organisations.

| Perimeter security |
PaaS public endpoints are blocked, Virtual Networks (VNETs) ports in-/out-bound are controlled via Network Security Groups (NSGs). On top of this customers may opt to use services such as Azure Network Watcher or 3rd party NVAs to inspect traffic. |
| Encryption |
By default, all services, regardless whether data is in transit or at rest is encrypted. Many services allow customers to bring their own keys (BYOK) integrated with Azure Key Vaults FIPS140-2 level 2 HSMs. Microsoft cannot see or access these keys. Caveat emptor, your data cannot be recovered if these keys are lost/deleted. |
| Blueprints and policies |
Using Azure policies, we can specify security requirements, i.e. that data must remain encrypted at rest and in-transit. Our estate is continuously audited against these policies and violations denied and/or escalated. |
| Auditing |
Auditing capabilities give us low-level granular logs which are aggregated from all services and forwarded onto to Azure Monitor to allow us to analyse events. |
| Authz |
As every layer is integrated with Azure Active Directory (AAD) we can carve out groups that provide access to specific layers of our platform– moreover we can define which of these groups can access which parts of the data-lake, for instance which tables within a database, which workspaces in Databricks, which dashboards and reports in Power BI. |
| Credential passthrough |
Some services boast credential-passthrough allowing Power BI to pass logged-in user details into Azure Synapse to run row- or column level filtering, which in turn could pass those same credentials to the storage layer (via external tables) to fetch some data from the data lake which can verify whether presented user has read access on the mapped file/folder. |
| Analytics Runtime Security |
On top of these capabilities the various analytic runtimes provide additional mechanisms to secure data, such as masking, row/column level access, advanced threat protection and more subject to individual engines. |
Thus, we end up with layers of authorisation mapped against single identity provider which is woven into the fabric of our data platform creating defense in depth. Thus, avoiding proliferation of ad-hoc identities, random SSH accounts, or identity federations that take time to sync.
 Whilst Azure does support service principals for automation, a simpler approach is to use Managed Identities (MIs) which are based on the inherent trust relationship between services and the Azure platform. Thus, services can be given an implicit identity that can be granted access to other parts of the platform. This escapes the need for key life-cycle management.
Using this identity model, we can define granular separation of concerns. Abiding by the principle of least privilege, support staff may have resource managing rights, however access to the data plane is prohibited. As an example, the support team could manage replication settings and other config in an Azure DB via the Azure Portal or CLI yet denied access to the actual database contents. Some user with data-plane access on the contrary may be denied access to platform configuration, i.e. firewall config, and is restricted to an area (i.e. table, schema, data-lake location, reports etc.) within the data plane.

As an example, we could create a “Finance Power-User” group who are given access to some finance related workspaces in Power BI, plus access to a SQL interface in the central platform that can read restricted finance tables and some common shared tables. Standard “Finance users” on the other hand only have access to some dashboards and reports in Power BI. Users can be part of multiple groups inheriting access rights of both groups.
Orgs spend a fair amount of time defining what this security structure looks like as in many cases business domains, sub-domains and regions need to be accounted for. This security layout influences file/folder and schema structures.
5 Resilience
Whilst I will not do cloud HA/DR justice in a short blog its worth highlighting various native capabilities available within some of the PaaS services. These battle-tested capabilities allow teams to spend more time on building out value-add features as opposed to time consuming, but necessary resilience. This is a summary and by no means exhaustive.
Stateless
Stateful
Conceptually we split services into 2 groups. Stateless services that can be rebuilt from templates without losing data versus stateful that require data replication and storage redundancy in order to prevent data loss and meet RPO/RTO objectives. This is based on the premise that compute and storage is separated.
Organisations should also consider scenarios in which data lake has been corrupted or deleted, accidentally, deliberately, or otherwise.
Account level: Azure Resource locks prevent modification or deletion of an Azure resource.
Data level: Create incremental ADF copy-job to create second in second ADLS account. Note: Currently soft-delete, change-feed, versioning, and snapshots, are blob only, however will eventually support multi-protocol access.
Some organisations are happy with a locally redundant setup, others request zonal redundancy, whilst others need global redundancy. There are various out-of-the-box capabilities designed for various scenarios and price-points.
6 DevOps
Running DevOps is another crucial facet in our strategy. We are not just talking about the core data platform, i.e. CI/CDing templated services, but also how to leverage DataOps to manage data pipelines, data manipulation language (DML), and DDL (data definition language). The natural progression after this is MLOps, i.e. streamlining ML model training and deployment.
Moving away from traditional IT waterfall implementation and adopting a continuous development approach is already a proven paradigm. GitHub, Azure DevOps, and Jenkins all provide rich integration into Azure to support CI/CD.
Due to idempotency of templates and cli commands, we can deploy the same artefacts multiple times without breaking existing services. Our scripts are pushed from our dev environment to git repositories which trigger approval and promotion workflows to update the environment.
Whilst some customers go with the template approach (Azure Resource Manager templates) others prefer the CLI method, however both support idempotency allowing us to run the same template multiple times without breaking the platform.
 Using a key-vault per environment we can store configurations which reflect their respective environment.
However, CI/CD does not stop with the platform, we can run data ingestion pipelines in a similar manner. Azure Data Factory (ADF) natively integrates with git repos and allows developers to adopt Git Flow workflow and work on multiple feature branches. ADF can retrieve config parameters for linked services (i.e. the component that establishes a connection to a data source) from the environment’s key vault, thus connection string, usernames etc reflect the environment they’re running in and more importantly aren’t stored in code. As we promote an ADF pipeline from dev to test or test to prod it will automatically pick up the parameters for that specific environment from the key vault.
This means very few engineers need admin access to the production data platform. Whilst Data Product teams should adhere to the same approach, they do not have to bound by the same level of scrutiny, approvals, and tests.
Services such as Azure Machine Learning are built specifically to deal with MLOps and extend the pattern discussed above to training and tracking ML models and deploying them as scalable endpoints, on-prem, edge, cloud, and other clouds. GigaOm walk through first principles and implementation approach: Delivering on the Vision of MLOps..
7 Monitoring and Auditing
Whilst all services outlined in the architecture have their own native dashboards to monitor metrics and KPIs, they also support pushing their telemetry into an Azure Monitor instance, creating a central monitoring platform for all services used end to end. Operators can run custom queries, create arbitrary alerts, mix and match widgets on a dashboard, query from Power BI, or push into Grafana.

8 Conclusion
Brining all the facets we have discussed together, we end up with a platform that is highly scalable, secure, agile, and loosely coupled. A platform that will allow us to evolve at the speed of business and prioritise the satisfaction of our internal customers.
I have seen customers go through this journey and end up with as few as 2 people running the day to day platform, whilst the remaining team are engaged developing data products. Allowing teams to allocate time and effort on biz value creation vs ‘keeping the lights on’ activities.
Whilst each area is perhaps a couple blog posts, I hope I was able to convey my thoughts collected over numerous engagements from various customers, further I hope I demonstrated why Azure is a great fit for customers large or small.
Much of this experience will be simplified with the arrival of Azure Synapse, however the concepts discussed here give you a solid understanding of the inner workings.
by Scott Muniz | Jul 13, 2020 | Uncategorized
This article is contributed. See the original author and article here.
I was working on a few performance cases last week. So I thought it would be a good idea to follow my plan that I started in 2017 ( yes, I know a long time) and discuss more about SQL DW performance.
From the time tunnel my post from 2017: https://docs.microsoft.com/en-gb/archive/blogs/dataplatform/sql-azure-dw-what-is-it-how-it-works.
I was working on those cases with my colleague Frederico Guimaraes which is a person that has a lot of experience in this matter.
I will copy and paste a few concepts from my previous post to give us some ground:
MPP means…
It is “divide to conquer”. Azure DW relays in nodes and CPUs, instead of in only CPUs to process a task. Our classical SQL divides a task in different CPUs, which is parallel processing. Azure DW process a task in CPUs running in different nodes (computers).
In order to achieve this distributed architecture DW has:
Control node: The Control node manages and optimizes queries. It is the front end that interacts with all applications and connections.
Compute nodes: The Compute nodes serve as the power behind SQL Data Warehouse. They are SQL Databases that store your data and process your query
Storage: Your data is stored in Azure Blob storage. When Compute nodes interact with your data, they write and read directly to and from blob storage
(https://docs.microsoft.com/en-us/azure/sql-data-warehouse/sql-data-warehouse-overview-what-is)
Distribution columns:
Behind the scenes, SQL Data Warehouse divides your data into 60 databases. Each individual database is referred to as a distribution. When data is loaded into each table, SQL Data Warehouse has to know how to divide your data across these 60 distributions.
So the column chooses as the distribution key will be used to distribute the data across nodes.
We have two types of distribution:
- Round robin which distributes data evenly but randomly. As it sounds round-robin will work distributing the data in round-robin fashion.
- Hash Distributed which distributes data based on hashing values from a single column. Hash distributed tables are tables that are divided between the distributed databases using a hashing algorithm on a single column that you select.
Ok that is enough…
Once you create your distributed table and defined the distributed key, keep in mind the key holds the secret to avoid data movement on large tables. I mean suppose you will join large tables, it sounds a good idea to join the distributed tables on their distribution keys.
For example:
/****** Object:  Table [dbo].[Medallion]    Script Date: 14/07/2020 10:13:05 ******/
SET ANSI_NULLS ON
GO

SET QUOTED_IDENTIFIER ON
GO

CREATE TABLE [dbo].[Medallion]
(
	[MedallionID] [int] NOT NULL,
	[MedallionBKey] [varchar](50) NOT NULL,
	[MedallionCode] [varchar](50) NULL
)
WITH
(
	DISTRIBUTION = HASH ( [MedallionID] ),
	CLUSTERED COLUMNSTORE INDEX
)
GO
iT is pretty much the same table with the same data and the same distribution key.
If my query does not include the key for the join: MPP will estimate in a different way even the results by including the key would be the same. Let me explain by showing:
Note I included explain command to get the query plan :
EXPLAIN
SELECT m.[MedallionID]
      ,H.[MedallionBKey]
      ,m.[MedallionCode]
  FROM [dbo].[Medallion] m
  INNER JOIN Medallion_hash h
   ON  m.MedallionID = h.MedallionID
   AND  m.MedallionBKey=h.MedallionBKey
Result:
<?xml version="1.0" encoding="utf-8"?>
<dsql_query number_nodes="1" number_distributions="60" number_distributions_per_node="60">
<sql>SELECT m.[MedallionID]
,H.[MedallionBKey]
,m.[MedallionCode]
FROM [dbo].[Medallion] m
INNER JOIN Medallion_hash h on m.MedallionID = h.MedallionID and m.MedallionBKey=h.MedallionBKey</sql>
<dsql_operations total_cost="0" total_number_operations="1">
<dsql_operation operation_type="RETURN">
<location distribution="AllDistributions" />
<select>SELECT [T1_1].[MedallionID] AS [MedallionID], [T1_1].[MedallionBKey] AS [MedallionBKey], [T1_1].[MedallionCode] AS [MedallionCode] FROM (SELECT [T2_2].[MedallionID] AS [MedallionID], [T2_1].[MedallionBKey] AS [MedallionBKey], [T2_2].[MedallionCode] AS [MedallionCode] FROM [SQLDW].[dbo].[Medallion_hash] AS T2_1 INNER JOIN
[SQLDW].[dbo].[Medallion] AS T2_2
ON (([T2_2].[MedallionID] = [T2_1].[MedallionID]) AND ([T2_2].[MedallionBKey] = [T2_1].[MedallionBKey]))) AS T1_1
OPTION (MAXDOP 2)</select>
</dsql_operation>
</dsql_operations>
</dsql_query>
I changed the query without including my distribution key which is MedeallionID and filtered by MedallionBkey only, now I have data movement:
EXPLAIN
SELECT m.[MedallionID]
      ,H.[MedallionBKey]
      ,m.[MedallionCode]
  FROM [dbo].[Medallion] m
  INNER JOIN Medallion_hash h
   ON   m.MedallionBKey=h.MedallionBKey
Result is:
<?xml version="1.0" encoding="utf-8"?>
<dsql_query number_nodes="1" number_distributions="60" number_distributions_per_node="60">
  <sql>SELECT m.[MedallionID]
      ,H.[MedallionBKey]
      ,m.[MedallionCode]
  FROM [dbo].[Medallion] m
  INNER JOIN Medallion_hash h on   m.MedallionBKey=h.MedallionBKey</sql>
  <dsql_operations total_cost="6.451296" total_number_operations="9">
    <dsql_operation operation_type="RND_ID">
      <identifier>TEMP_ID_17</identifier>
    </dsql_operation>
    <dsql_operation operation_type="ON">
      <location permanent="false" distribution="AllDistributions" />
      <sql_operations>
        <sql_operation type="statement">CREATE TABLE [qtabledb].[dbo].[TEMP_ID_17] ([MedallionBKey] VARCHAR(50) COLLATE SQL_Latin1_General_CP1_CI_AS NOT NULL ) WITH(DISTRIBUTED_MOVE_FILE='');</sql_operation>
      </sql_operations>
    </dsql_operation>
    <dsql_operation operation_type="SHUFFLE_MOVE">
      <operation_cost cost="1.749504" accumulative_cost="1.749504" average_rowsize="32" output_rows="13668" GroupNumber="4" />
      <source_statement>SELECT [T1_1].[MedallionBKey] AS [MedallionBKey] FROM [SQLDW].[dbo].[Medallion_hash] AS T1_1
OPTION (MAXDOP 2, MIN_GRANT_PERCENT = [MIN_GRANT], DISTRIBUTED_MOVE(N''))</source_statement>
      <destination_table>[TEMP_ID_17]</destination_table>
      <shuffle_columns>MedallionBKey;</shuffle_columns>
    </dsql_operation>
    <dsql_operation operation_type="RND_ID">
      <identifier>TEMP_ID_18</identifier>
    </dsql_operation>
    <dsql_operation operation_type="ON">
      <location permanent="false" distribution="AllDistributions" />
      <sql_operations>
        <sql_operation type="statement">CREATE TABLE [qtabledb].[dbo].[TEMP_ID_18] ([MedallionID] INT NOT NULL, [MedallionBKey] VARCHAR(50) COLLATE SQL_Latin1_General_CP1_CI_AS NOT NULL, [MedallionCode] VARCHAR(50) COLLATE SQL_Latin1_General_CP1_CI_AS ) WITH(DISTRIBUTED_MOVE_FILE='');</sql_operation>
      </sql_operations>
    </dsql_operation>
    <dsql_operation operation_type="SHUFFLE_MOVE">
      <operation_cost cost="4.701792" accumulative_cost="6.451296" average_rowsize="86" output_rows="13668" GroupNumber="3" />
      <source_statement>SELECT [T1_1].[MedallionID] AS [MedallionID], [T1_1].[MedallionBKey] AS [MedallionBKey], [T1_1].[MedallionCode] AS [MedallionCode] FROM [SQLDW].[dbo].[Medallion] AS T1_1
OPTION (MAXDOP 2, MIN_GRANT_PERCENT = [MIN_GRANT], DISTRIBUTED_MOVE(N''))</source_statement>
      <destination_table>[TEMP_ID_18]</destination_table>
      <shuffle_columns>MedallionBKey;</shuffle_columns>
    </dsql_operation>
    <dsql_operation operation_type="RETURN">
      <location distribution="AllDistributions" />
      <select>SELECT [T1_1].[MedallionID] AS [MedallionID], [T1_1].[MedallionBKey] AS [MedallionBKey], [T1_1].[MedallionCode] AS [MedallionCode] FROM (SELECT [T2_2].[MedallionID] AS [MedallionID], [T2_1].[MedallionBKey] AS [MedallionBKey], [T2_2].[MedallionCode] AS [MedallionCode] FROM [qtabledb].[dbo].[TEMP_ID_17] AS T2_1 INNER JOIN
[qtabledb].[dbo].[TEMP_ID_18] AS T2_2
ON ([T2_1].[MedallionBKey] = [T2_2].[MedallionBKey])) AS T1_1
OPTION (MAXDOP 2, MIN_GRANT_PERCENT = [MIN_GRANT])</select>
    </dsql_operation>
    <dsql_operation operation_type="ON">
      <location permanent="false" distribution="AllDistributions" />
      <sql_operations>
        <sql_operation type="statement">DROP TABLE [qtabledb].[dbo].[TEMP_ID_18]</sql_operation>
      </sql_operations>
    </dsql_operation>
    <dsql_operation operation_type="ON">
      <location permanent="false" distribution="AllDistributions" />
      <sql_operations>
        <sql_operation type="statement">DROP TABLE [qtabledb].[dbo].[TEMP_ID_17]</sql_operation>
      </sql_operations>
    </dsql_operation>
  </dsql_operations>
</dsql_query>
Note data movement is happening on the plan: <dsql_operation operation_type=”SHUFFLE_MOVE”>. Which means ( copy and paste again from my previous post):
SHUFFLE_MOVE – Redistributes a distributed table. The redistributed table has a different distribution column than the original distributed table. This might be used to when running incompatible joins or incompatible aggregations.
To perform this operation, SQL DW will move each row to the correct Compute node according to the distribution column of the destination table. Rows that are already stored on the correct Compute node are not copied during this operation.
So the case from this week is about that. There was a data movement which was not desired to be on the plan, for that we took some actions:
1) Review the distribution keys on the table
2) Review the stats. So, wrong stats can lead to MPP misestimated the plan.
Follow a simple query to check your stats:
SELECT stats_id, name AS stats_name,
    STATS_DATE(object_id, stats_id) AS statistics_date
FROM sys.stats s
That is it! I hope the examples provide help you to get an idea of the importance while defining distribution keys.
Liliam C Leme
UK Engineer

![Left to right: CJ Tan – principal program manager (Microsoft/SharePoint) [guest] and Sean Squires – principal program manager (Microsoft/SharePoint) [guest].](https://gxcuf89792.i.lithium.com/t5/image/serverpage/image-id/205122i7DCF96CFFD076EF7/image-size/large?v=1.0&px=999 "CJ-Sean_Cortex-mesh_profile.jpg")
![Left to right [The Intrazone co-hosts]: Chris McNulty, senior product manager (SharePoint, #ProjectCortex – Microsoft) and Mark Kashman, senior product manager (SharePoint – Microsoft).](https://www.drware.com/wp-content/uploads/2020/07/large-471 "Mark Kashman_1-1583812153608.jpeg")


Recent Comments