Learn Durable Functions with .NET Core and C#, stateful Serverless
This article is contributed. See the original author and article here.
Follow me on Twitter, happy to take your suggestions on topics or improvements /Chris
Durable Functions are an extension of Azure Functions that lets you write stateful functions in a serverless environment. Durable functions manages
state,checkpoints, andrestartsfor you.
What does that even mean you ask?
It means you can have long-running functions like really long-running functions. It also has a state which means it remembers where it is, like a workflow.
How about this. Imagine you have a situation where :
> you need to manage something by dividing it up in different checkpoints. Each checkpoint is one step closer for it to be considered handled. More concretely imagine a game for example where you need to load a bunch of different resources and only when everything is loaded and ready are you able to play the game.
Oh, ok, so it’s like a workflow framework
Yea exactly, it enables you to specify how something should be executed through a flow. There are even different architectural patterns that is recommended for different flows.
Sounds like that could be expensive, is it?
No not really, the payment model is very close to the one Azure Functions use, only pay for when the functions/ workflow is actually executing.
Sounds great, tell me more
In this article we will cover:
- What are Durable functions, let’s talk through what it is and what the central concepts are
- How it works, we will explain a little bit of how it works
- Resources, we will give out some resources so you can delve further in
- Lab, we will code through an example so you see the major concepts in use and what happens when
Concepts and high-level explanation
There are some concepts we need to know about when dealing with durable functions. All concepts play a role that together enables us to run our durable function.
- Orchestrator function, this is a function where we define the workflow, we set up what should happen in the workflow, what activities to carry out and what happens when it’s done
- Activity function, Activity functions are the basic unit of work in a durable function orchestration. Activity functions are the functions and tasks that are orchestrated in the process. You can have as many activity functions as you want. Make sure to give them descriptive names that represent steps in your flow
- Client functions, Client functions are the triggered functions that create new instances of an orchestration. Client functions are the entry point for creating an instance of a Durable Functions orchestration
Ok, I think I got but can you maybe explain it a bit more?
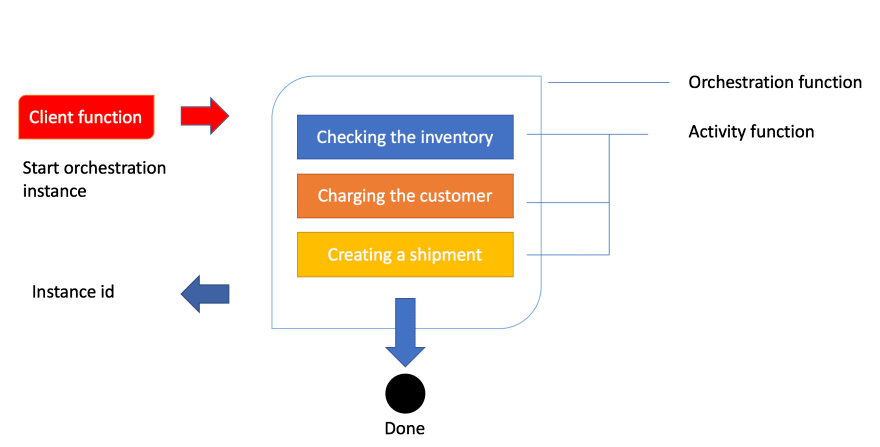
Sure, the best way to explain it is through a realistic example and an image. So let’s talk about order processing. In order processing we imagine we have the following tasks to carry out:
- Checking the inventory,
- Charging the customer,
- Creating a shipment
Given that we know how an order is processed let’s show you that image so you get a feeling for the workflow:

Ok, above we see how a client function is being invoked. In the case of an order being created, this typically is an HTTP endpoint we hit from an application. The next thing to happen is that the client’s function starts an instance of an orchestration. This means we will get an instance id, our unique reference to that specific flow. Next thing to happen is that we try to carry out everything inside of the orchestration like checking the inventory, charging the customer and creating a shipment.
How it works
Let’s talk a bit more about how this technically works. The thing with the orchestration is that what it orchestrates usually is asynchronous which means we don’t know exactly when something finishes. To avoid that you pay running costs for it durable functions powers down and saves the state.
When an orchestration function is given more work to do (for example, a response message is received or a durable timer expires), the orchestrator wakes up and re-executes the entire function from the start to rebuild the local state.
wait, re-running everything?
No worries, during the replay, if the code tries to call a function (or do any other async work), the Durable Task Framework consults the execution history of the current orchestration. If it finds that the activity function has already executed and yielded a result, it replays that function’s result and the orchestrator code continues to run.
Oh ok, that sounds better
Replay continues until the function code is finished or until it has scheduled new async work
Resources
- Free account Azure account You will need to sign up on Azure to use Durable Functions
- Creating your first durable function with JavaScript Quickstart that takes you through creating a durable function
- Durable functions concepts Read more here on concepts and patterns and how to implement said patterns.
- Orchestrator function constraints Constraints you need to be aware of.
Lab – simple activity flow
We believe the best way to learn is to build something with it. So how do we do it? Well, it’s quite simple. Using VS Code we can install a plugin making this process really easy.

Creating our project
Open up the command palette or type COMMAND + SHIFT + P.
Then we select the following, to create a new project

This is followed by us selecting a language, let’s take C#. Then we are faced with this list of choices
Select Durable Functions Orchestration , next name your function:

You will be asked to select a storage account, you will need to select Subscription, Storage account and Resource group. The reason for this is that when you save the state of your function it needs to be saved somewhere for later recovery.
Your project should now look like this:
-| obj/
-| bin/
-| .gitignore
-| <name of directory>.csproj
-| local.settings.json
-| Orchestration.cs
Let’s take a closer look at Orchestration.cs:
using System.Collections.Generic;
using System.Net.Http;
using System.Threading.Tasks;
using Microsoft.Azure.WebJobs;
using Microsoft.Azure.WebJobs.Extensions.DurableTask;
using Microsoft.Azure.WebJobs.Extensions.Http;
using Microsoft.Extensions.Logging;

namespace Company.Function
{
    public static class Orchestration
    {
        [FunctionName("Orchestration")]
        public static async Task<List<string>> RunOrchestrator(
            [OrchestrationTrigger] IDurableOrchestrationContext context)
        {
            var outputs = new List<string>();

            // Replace "hello" with the name of your Durable Activity Function.
            outputs.Add(await context.CallActivityAsync<string>("Orchestration_Hello", "Tokyo"));
            outputs.Add(await context.CallActivityAsync<string>("Orchestration_Hello", "Seattle"));
            outputs.Add(await context.CallActivityAsync<string>("Orchestration_Hello", "London"));

            // returns ["Hello Tokyo!", "Hello Seattle!", "Hello London!"]
            return outputs;
        }

        [FunctionName("Orchestration_Hello")]
        public static string SayHello([ActivityTrigger] string name, ILogger log)
        {
            log.LogInformation($"Saying hello to {name}.");
            return $"Hello {name}!";
        }

        [FunctionName("Orchestration_HttpStart")]
        public static async Task<HttpResponseMessage> HttpStart(
            [HttpTrigger(AuthorizationLevel.Anonymous, "get", "post")] HttpRequestMessage req,
            [DurableClient] IDurableOrchestrationClient starter,
            ILogger log)
        {
            // Function input comes from the request content.
            string instanceId = await starter.StartNewAsync("Orchestration", null);

            log.LogInformation($"Started orchestration with ID = '{instanceId}'.");

            return starter.CreateCheckStatusResponse(req, instanceId);
        }
    }
}
Above you can see how three functions have been generated for you when you created the project. Every function has been decorated with FunctionName decorator. This is how the runtime knows what these functions are and can generate endpoints from it, among other things.
Explaining the artifacts
Ok, so we created three different functions or artifacts, an orchestrator function, an HTTP start/client function, and an activity function. How does this all work?
Well, it all starts with a HttpStart function that kicks everything off. Then said function kicks off the Orchestrator that in turn starts the Activity functions specified in the orchestrator. Sounds a bit theoretical but let’s dive into each of these artifacts and see what happens in the code.
HttpStart
As mentioned above, this is the function that starts it all. Let’s have a look at its source code and discuss what’s happening:
[FunctionName("Orchestration_HttpStart")]
public static async Task<HttpResponseMessage> HttpStart(
  [HttpTrigger(AuthorizationLevel.Anonymous, "get", "post")] HttpRequestMessage req,
  [DurableClient] IDurableOrchestrationClient starter,
   ILogger log)
{
  // Function input comes from the request content.
  string instanceId = await starter.StartNewAsync("Orchestration", null);

  log.LogInformation($"Started orchestration with ID = '{instanceId}'.");
  return starter.CreateCheckStatusResponse(req, instanceId);
}
We can see above that we have three input parameters:
- req, of type IHttpRequestMessage, this is the incoming web request. Note how this parameter has the
HttpTriggerdecorator with two input params, AuthorizationLevel, and the strings “get” and “post”. This instructs this method to listen to WebRequests using the HTTP verbs GET and POST. - starter, of type IIDurableOrchestrationClient, this is the client that allows us to control the general flow.
- log, of type ILogger, this instance lets us log different messages that can be subscribed to by Azure and will also be visible in the terminal while developing our project.
Next up our starter instance calls StartNewAsync() which produce an instanceId. The instanceId is a reference or handler to this specific function invocation. It doesn’t matter so much for this demo but the for the second one we will use that information.
The last thing to happen is that we create an HTTP response by calling CreateCheckStatusResponse() .
Orchestrator
Let’s look at the Orchestrator next. This is where all the interesting things are happening, this is where we set up our flow, what function to be called when and why. Let’s look at the code:
[FunctionName("Orchestration")]
public static async Task<List<string>> RunOrchestrator(
  [OrchestrationTrigger] IDurableOrchestrationContext context)
{
  var outputs = new List<string>();

  // Replace "hello" with the name of your Durable Activity Function.
  outputs.Add(await context.CallActivityAsync<string>("Orchestration_Hello", "Tokyo"));
  outputs.Add(await context.CallActivityAsync<string>("Orchestration_Hello", "Seattle"));
  outputs.Add(await context.CallActivityAsync<string>("Orchestration_Hello", "London"));

  // returns ["Hello Tokyo!", "Hello Seattle!", "Hello London!"]
  return outputs;
}
The first thing we see that we have a method FunctionName("Orchestration") . We have an input parameter context of type IDurableOrchestrationContext. This parameter has the capability of controlling the flow but also call helpers but also activity functions, that does the heavy lifting. When contextcalls CallActivitySync()it does just that, it calls an activity function with the name Orchestration_Helloand pass it a string.
Orchestration_Hello
Next up we have an activity function. This is where we carry out all the heavy lifting.
[FunctionName("Orchestration_Hello")]
public static string SayHello([ActivityTrigger] string name, ILogger log)
{
  log.LogInformation($"Saying hello to {name}.");
  return $"Hello {name}!";
}
We see that it returns straight away but it could definitely be a long-running activity. The point is whether it runs in a millisecond or takes some time, it doesn’t matter, the orchestration function still has to wait for it to conclude. Imagine this function can do a lot more, like talking to a database or do an HTTP request.
Debugging
You may think you understand everything up to this point but it really clicks when you see a debugging flow happening. So that’s what we are going to be doing next, we are going to start up our durable function from VS Code and you will be able to see how the breakpoints hit and when.
Now we are ready to debug so let’s hit debug by going to Run/ Start Debugging in the VS Code menu.
We should be getting something like this printed in the terminal
Http Functions:
  Orchestration_HttpStart: [GET,POST] http://localhost:7071/api/Orchestration_HttpStart
Next thing we need to do is to kick everything off by hitting our client function route as indicated above http://localhost:7071/api/Orchestration_HttpStart. We need to start the whole thing by calling the mentioned URL
1) The first thing to happen is our HttpStart function being hit:
We let the debugger advance:
2) Next, the Orchestration is being hit.
Next up we advance to the next breakpoint and we see that our activity
3) Next, the function Orchestration_Hello is being hit next.
We advanced the breakpoint and we find ourselves being back in the orchestration function:
This will lead to the activity function being hit again, this time with the argument Seattleand so on.
As you can see it will keep going like this between activity function and orchestrator until orchestrator is done.
We end up coming to a page like this which is the HTTP response from the method called HttpStart
// 20200721125052
// http://localhost:7071/api/Orchestration_HttpStart

{
  "id": "151c37c2bbc14f659ffb0a4d3ed9e54e",
  "statusQueryGetUri": "http://localhost:7071/runtime/webhooks/durabletask/instances/151c37c2bbc14f659ffb0a4d3ed9e54e?taskHub=TestHubName&connection=Storage&code=/XsKEv/uaBc41kmo1ayzMMhI7mh5fNazn4azktrpMbJtuEnSnpm1lA==",
  "sendEventPostUri": "http://localhost:7071/runtime/webhooks/durabletask/instances/151c37c2bbc14f659ffb0a4d3ed9e54e/raiseEvent/{eventName}?taskHub=TestHubName&connection=Storage&code=/XsKEv/uaBc41kmo1ayzMMhI7mh5fNazn4azktrpMbJtuEnSnpm1lA==",
  "terminatePostUri": "http://localhost:7071/runtime/webhooks/durabletask/instances/151c37c2bbc14f659ffb0a4d3ed9e54e/terminate?reason={text}&taskHub=TestHubName&connection=Storage&code=/XsKEv/uaBc41kmo1ayzMMhI7mh5fNazn4azktrpMbJtuEnSnpm1lA==",
  "purgeHistoryDeleteUri": "http://localhost:7071/runtime/webhooks/durabletask/instances/151c37c2bbc14f659ffb0a4d3ed9e54e?taskHub=TestHubName&connection=Storage&code=/XsKEv/uaBc41kmo1ayzMMhI7mh5fNazn4azktrpMbJtuEnSnpm1lA=="
}
What’s interesting for us to know at this point is what did we end up producing? The answer lies in the URL called statusQueryGetUri. Let’s follow that link:
// 20200721122529
// http://localhost:7071/runtime/webhooks/durabletask/instances/e1d7e237acb74834a02854050805712e?taskHub=TestHubName&connection=Storage&code=/XsKEv/uaBc41kmo1ayzMMhI7mh5fNazn4azktrpMbJtuEnSnpm1lA==

{
  "name": "Orchestration",
  "instanceId": "e1d7e237acb74834a02854050805712e",
  "runtimeStatus": "Completed",
  "input": null,
  "customStatus": null,
  "output": [
    "Hello Tokyo!",
    "Hello Seattle!",
    "Hello London!"
  ],
  "createdTime": "2020-07-21T11:18:28Z",
  "lastUpdatedTime": "2020-07-21T11:24:25Z"
}
As you can see above the response from our Orchestration function is an array consisting of the responses from all activity functions, like so:
"output": [
  "Hello Tokyo!",
  "Hello Seattle!",
  "Hello London"
]
It ended up that way because of the way we constructed the code, we wrote this:
outputs.Add(await context.CallActivityAsync<string>("Orchestration_Hello", "Tokyo"));
outputs.Add(await context.CallActivityAsync<string>("Orchestration_Hello", "Seattle"));
outputs.Add(await context.CallActivityAsync<string>("Orchestration_Hello", "London"));
Summary
There is so much more to learn about Durable Functions but I can already hear some of you snore at this point which is why we will save topics such as Application Patterns and implementation of a pattern Fan-out/fan-in for the next part.
So I hope you are excited about that one.
Acknowledgements
I wouldn’t be writing this if it wasn’t for your guidance in how Durable Functions work. You both are amazing human beings.
So go give them a follow, they really know their stuff on Serverless


Recent Comments