by Contributed | Sep 4, 2024 | Technology
This article is contributed. See the original author and article here.
With the new semester just around the corner, we’re excited to introduce some fantastic new features in Forms to enhance your teaching and learning experience. Now, you can enjoy an improved data sync function to stay up to date, set rules to collect more accurate responses, pre-fill forms and quizzes, and easily manage response notifications. Let’s dive in and check more details. You can also try out from this template.
Let’s create a science club registration together to explore how we can make the most of these new features. Imagine you are a high school science teacher and trying to establish a science club where students from all grades can dive into fascinating topics beyond the curriculum and participate in fun, hands-on activities.
Improved Excel data sync function
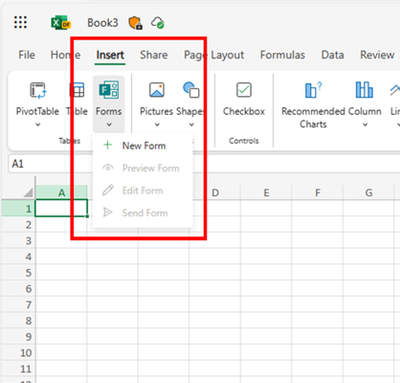
You can start with Excel for the web to create the registration form, no need to visit Forms. This process will automatically generate a new form in Forms where you can add your questions. All the questions you add and responses you receive will seamlessly sync with Excel. (check more details: Forms data sync to Excel is now fully available with more functionality – Microsoft Community Hub)
Create forms from Excel for the web
Prefill answers for forms/quizzes
In this science club registration, you can use prefilled answers for fields like grade and class, creating unique links for each grade and class. This allows you to easily track and differentiate student distribution across different groups in the club. (check more details: Pre-fill Responses in Your Microsoft Forms – Microsoft Community Hub)
 Set prefilled answer
Validation for open text question
To make sure students provide correct contact information and receive timely updates, you can set restriction for open text questions to only accept email formats. (Other types of restriction are also supported in Forms, check more details here: Validate open text responses in Microsoft Forms – Microsoft Community Hub)
 Set validation on email address
Manage recipients of new response notification
You can set multiple key individuals to receive the notification when a new registration comes in, such as the club coordinator and an assistant. This allows them to quickly review and confirm new members, update the membership list, and prepare welcome materials. (check more details: Add or remove people from your form response notification emails – Microsoft Community Hub)
 Add recipients for new response notification
Hope you find these new features useful for the new semester. If you’re interested in trying them out, simply start with this template.
by Contributed | Sep 2, 2024 | Technology
This article is contributed. See the original author and article here.
Hey! Rob Greene again. Been on a roll with all things crypto as of late, and you are not going to be disappointed with this one either!
Background
Many know that Remote Desktop Services uses a self-signed certificate for its TLS connection from the RDS Client to the RDS Server over the TCP 3389 connection by default. However, Remote Desktop Services can be configured to enroll for a certificate against an Enterprise CA, instead of continuing to use those annoying self-signed certificates everywhere.
I know there are other blogs out there that cover setting up the certificate template, and the group policy, but what if I told you most of the blogs that I have seen on this setup are incomplete, inaccurate, and do not explain what is happening with the enrollment and subsequent renewals of the RDS certificate!? I know… Shocker!!!
How this works
The Remote Desktop Service looks for a certificate, in the computer personal store, that has a specific Enhanced Key Usage with the Object Identifier (OID) of 1.3.6.1.4.1.311.54.1.2, which is typically named Remote Desktop Authentication, or Server Authentication. It prefers a certificate with the OID of Remote Desktop Authentication. https://learn.microsoft.com/en-us/previous-versions/windows/it-pro/windows-server-2012-R2-and-2012/dn781533(v=ws.11)
Sidebar:
If you are a pretty regular consumer of the AskDS blog content you know how we love to recommend using one certificate on the server for a specific Enhanced Key Usage (EKU), and make sure that you have all the information required on the certificate so that it works with all applications that need to use the certificate.
This certificate is no different. I would recommend that the certificate that is used ONLY has the EKU for Remote Desktop Authentication and DOES NOT have an EKU of Server Authentication at all. The reason for this is that this certificate should not be controlled / maintained via Autoenrollment/renewal behaviors. This needs to be maintained by the Remote Desktop Configuration service, and you do not want certificates being used by other applications being replaced by a service like this as it will cause an issue in the long run.
There is a group policy setting that can be enabled to configure the Remote Desktop Service to enroll for the specified certificate and gives the NT AuthorityNetworkService account permission to the certificates private key which is a requirement for this to work.
The interesting thing about this is that you would think that the Remote Desktop Service service would be the service responsible for enrolling for this certificate, however it is the Remote Desktop Configuration (SessionEnv) service that is responsible for initial certificate requests as well as certificate renewals.
It is common to see the RDS Authentication Certificate template configured for autoenrollment, however this is one of the worse things you can do, and WILL cause issues with Remote Desktop Services once the certificate renewal timeframe comes in. Autoenrollment will archive the existing certificate causing RDS to no longer be able to find the existing certificate; then when you require TLS on the RDS Listener, users will fail to connect to the server. Then, at some point, Remote Desktop Configuration service will replace the newly issued certificate with a new one because it maintains the Thumbprint of the certificate that RDS should be using within WMI. When it tries to locate the original thumbprint and cannot find it, it will then attempt to enroll for a new one at the next service start. This is generally when we see the cases rolling in to the Windows Directory Services team because it appears to be a certificate issue even though this is a Remote Desktop Services configuration issue.
What we want to do is first make sure that all the steps are taken to properly configure the environment so that the Remote Desktop Configuration service is able to properly issue certificates.
The Steps
Like everything in IT (information technology), there is a list of steps that need to be completed to get this setup properly.
- Configure the certificate template and add it to a Certification Authority to issue the template.
- Configure the Group Policy setting.
Configuring the Certificate Template
The first step in the process is to create and configure the certificate template that we want to use:
- Log on to a computer that has the Active Directory Certificate Services Tools Remote Server Administration Tools (RSAT) installed or a Certification Authority within the environment.
- Launch: CertTmpl.msc (Certificate Template MMC)
- Find the template named Computer, right click on it and select Duplicate Template.
- On the Compatibility tab, select up to Windows Server 2012 R2 for Certification Authority and Certificate recipient. Going above this might cause issues with CEP / CES environments.
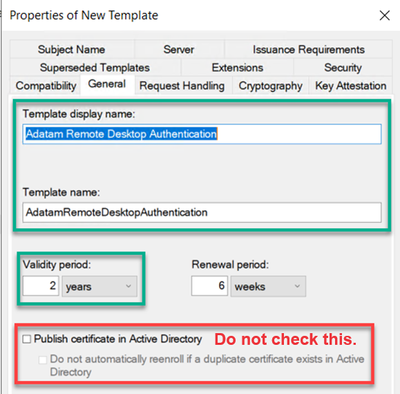
- On the General tab, we need to give the template a name and validity period.
- Type in a good descriptive name in the Template display name field.
- If you would like to change the Validity period, you can do that as well.
- You should NOT check the box Publish certificate in Active Directory.
NOTE: Make sure to copy the value in the Template name field, as this is the name that you will need to type in the group policy setting. Normally it will be the display name without any spaces in the name, but do not rely on this. Use the value you see during template creation or when looking back at the template later.
6. On the Extensions tab, the Enhanced Key Usage / Application Policies need to be modified.
a. Select Application Policies, and then click on the Edit button.

b. Multi select or select individually Client Authentication and Server Authentication and click the Remove button.

c. Click the Add button, and then click on the New button if you need to create the Application Policy for Remote Desktop Authentication. Otherwise find the Remote Desktop Authentication policy in the list and click the OK button.
d. If you need to create the Remote Desktop Authentication application policy, click the Add button, and then for the Name type in Remote Desktop Authentication, and type in 1.3.6.1.4.1.311.54.1.2 for the Object identifier value, and click the OK button.

e. Verify the newly created Remote Desktop Authentication application policy, and then click the OK button twice.

7. Remote Desktop service can use a Key Storage Provider (KSP). So, if you would like to change over from a Legacy Cryptographic Service Provider (CSP) to using a Key Storage Provider this can be done on the Cryptography tab.
8. Get the permissions set properly. To do this click on the Security tab.
a. Click the Add button and add any specific computer or computer groups you want to enroll for a certificate.
b. Then Make sure to ONLY select Allow Enroll permission. DO NOT select Autoenroll.

NOTE: Please keep in mind that Domain Controllers DO NOT belong to the Domain Computers group, so if you want all workstations, member server and Domain Controllers to enroll for this certificate, you will need Domain Computers and Enterprise Domain Controllers or Domain Controllers groups added with the security permission of Allow – Enroll.
9. When done making other changes to the template as needed, click the OK button to save the template.
Configure the Group Policy
After working through getting the certificate template created and configured to your liking, the next step in the process is to setup the Group Policy Object properly. The group policy setting that needs to be configured is located at: Computer ConfigurationPoliciesAdministrative TemplatesWindows ComponentsRemote Desktop ServicesRemote Desktop Session HostSecurity
With the Policy “Server authentication certificate template“
When adding the template name to this group policy it will accept one of two things:
- Certificate template name, again this is NOT the certificate template display name.
- Certificate templates Object Identifier value. Using this is not common, however some engineers will recommend this over the template name.

If you use the certificate template display name, the Remote Desktop Configuration service (SessionEnv) will successfully enroll for the certificate, however the next time the policy applies it will enroll for a new certificate again. This causes enrollments to happen and can make a CA very busy.
Troubleshoot issues of certificate issuance
Troubleshooting problems with certificate issuance is usually easy once you have a good understanding of how Remote Desktop Services goes about doing the enrollment, and there are only a few things to check out.
Investigating what Certificate Remote Desktop Service is configured to use.
The first thing to investigate is figuring out what certificate, if any,the Remote Desktop Services is currently configured to use. This is done by running a WMI query and can be done via PowerShell or good’ol WMIC. (Note: WMIC is deprecated and will be removed at a future date.)
PowerShell: Get-WmiObject -Class “Win32_TSGeneralSetting” -Namespace Rootcimv2Terminalservices
WMIC: wmic /namespace:rootcimv2TerminalServices PATH Win32_TSGeneralSetting Get SSLCertificateSHA1Hash
We are interested in the SSLCertificateSHA1Hash value that is returned. This will tell us the thumbprint of the certificate it is attempting to load.
Keep in mind that if the Remote Desktop Service is still using the self-signed certificate, it can be found by:
- launch the local computer certificate store (CertLM.msc).
- Once the Computer store opened look for the store named: Certificates – Local ComputerRemote DesktopCertificates.
- We would then double click on the certificate, then click on the Details tab, and find the field named Thumbprint.
- Then validate if this value matches the value of SSLCertificateSHA1Hash from the output.
If there is no certificate in the Remote Desktop store, or if the SSLCertificateSHA1Hash value does not match any of the certificates in the store Thumbprint field, then it would be best to visit the Certificates – Local ComputerPersonalCertificates store next. Look for a certificate that has the Thumbprint field matching the SSLCertificateSHA1Hash value.
Does the Remote Desktop Service have permission to the Certificate private key
Once the certificate has been tracked down, we then must figure out if the certificate has a private key and if so, does the account running the service have permission to the private key?
If you are using Group Policy to deploy the certificate template information and the computer has permissions to enroll for the certificate, then the permissions in theory should be configured properly for the private key and have the NT AuthorityNetworkService with Allow – Read permissions to the private key.
If you are having this problem, then more than likely the environment is NOT configured to deploy the certificate template via the group policy setting, and it is just relying on computer certificate autoenrollment and a certificate that is valid for Server Authentication. Relying on certificate autoenrollment is not going to configure the correct permissions for the private key and add Network Service account permissions.
To check this, follow these steps:
- launch the local computer certificate store (CertLM.msc).
- Once the Computer store opened look for the store named: Certificates – Local ComputerPersonalCertificates.
- Right click on the certificate that you are interested in, then select All Tasks, and click on Manage Private Keys.

4. Verify that Network Service account has Allow – Read Permissions. If not, then add it.

a. Click the Add button.
b. In the Select Users or Groups, click the Locations button, and select the local computer in the list.
c. Type in the name “Network Service”

d. Then click the Check Names button, and then click the OK button.
5. If the certificate does not appear to have a private key associated with it in via the Local Computer Certificate store snapin, then you may want to run the following CertUtil command to see if you can repair the association. CertUtil -RepairStore My [* / CertThumbprint].
How to change the certificate that Remote Desktop Services is using
If you have determined that Remote Desktop Services is using the wrong certificate, there are a couple of things that we can do to resolve this.
- We can delete the certificate from the Computer Personal store and then cycle the Remote Desktop Configuration (SessionEnv) service. This would cause immediate enrollment of a certificate using the certificate template defined in the group policy.
PowerShell:
     $RDPSettings = Get-WmiObject -Class “Win32_TSGeneralSetting” -Namespace Rootcimv2Terminalservices -Filter “TerminalName=’rdp-tcp'”
     CertUtil -DelStore My $RDPSettings.SSLCertificateSHA1Hash
     Net Stop SessionEnv
     Net Start SessionEnv
2. We could update the Thumbprint value in WMI to reference another certificates thumbprint.
PowerShell:
     $PATH = (Get-WmiObject -class “Win32_TSGeneralSetting” -Namespace rootcimv2terminalservices)
     Set-WmiInstance -Path $PATH -argument @{SSLCertificateSHA1Hash=”CERTIFICATETHUMBRPINT”}
WMIC: wmic /namespace:rootcimv2TerminalServices PATH Win32_TSGeneralSetting Set SSLCertificateSHA1Hash = “CERTIFICATETHUMBPRINT”
Conclusion
The first thing to remember is deploying certificates for Remote Desktop Services is best done by the Group Policy setting and to NOT setup the certificate template for autoenrollment. Setting the template up for autoenrollment will cause certificate issuance problems within the environment from multiple angles.
- Unless you modify the certificate templates default Key Permissions setting found on the Request Handling tab, the account running the Remote Desktop Service will not have permission to the private key if the certificate is acquired via autoenrollment. This is not something that we would recommend.

This will cause a scenario where even if the SSLCertificateSHA1Hash value is correct, it will not be able to use the certificate because it will not have permission to use the private key. If you do have the template configured for custom Private Key permissions, you could again still have issues with the WMI SSLCertificateSHA1Hash value not being correct.
2. Configure the group policy setting properly as well as the certificate template. It is best to manage this configuration via group policy and you can ensure consistent experience for all RDS connections.
I know that a lot of you might have deeper questions about how the Remote Desktop Configuration service does this enrollment process, however, please keep in mind that the Remote Desktop Service is really owned by the Windows User Experience team in CSS, and so us Windows Directory Services engineers may not have that deeper level knowledge. We just get called in when the certificates do not work or fail to get issued. This is how we tend to know so much about the most common misconfigurations for this solution.
Rob “Why are RDS Certificates so complicated” Greene
by Contributed | Sep 1, 2024 | Technology
This article is contributed. See the original author and article here.
Mv3 High Memory General Availability
Executing on our plan to have our third version of M-series (Mv3) powered by 4th generation Intel® Xeon® processors (Sapphire Rapids) across the board, we’re excited to announce that Mv3 High Memory (HM) virtual machines (VMs) are now generally available. These next-generation M-series High Memory VMs give customers faster insights, more uptime, lower total cost of ownership and improved price-performance for their most demanding workloads. Mv3 HM VMs are supported for RISE with SAP customers as well. With the release of this Mv3 sub-family and the sub-family that offers around 32TB memory, Microsoft is the only public cloud provider that can provide HANA certified VMs from around 1TB memory to around 32TB memory all powered by 4th generation Intel® Xeon® processors (Sapphire Rapids).
Key features on the new Mv3 HM VMs
- The Mv3 HM VMs can scale for workloads from 6TB to 16TB.
- Mv3 delivers up to 40% throughput over our Mv2 High Memory (HM), enabling significantly faster SAP HANA data load times for SAP OLAP workloads and significant higher performance per core for SAP OLTP workloads over the previous generation Mv2.
- Powered by Azure Boost, Mv3 HM provides up to 2x more throughput to Azure premium SSD storage and up to 25% improvement in network throughput over Mv2, with more deterministic performance.
- Designed from the ground up for increased resilience against failures in memory, disks, and networking based on intelligence from past generations.
- Available in both disk and diskless offerings allowing customers the flexibility to choose the option that best meets their workload needs.
During our private preview, several customers such as SwissRe unlocked gains from the new VM sizes. In their own words:
“Mv3 High Memory VM results are promising – in average we see a 30% increase in the performance without any big adjustment.”
Msv3 High Memory series (NVMe)
Size
|
vCPU
|
Memory in GiB
|
Max data disks
|
Max uncached Premium SSD throughput: IOPS/MBps
|
Max uncached Ultra Disk and Premium SSD V2 disk throughput: IOPS/MBps
|
Max NICs
|
Max network bandwidth (Mbps)
|
Standard_M416s_6_v3
|
416
|
5,696
|
64
|
130,000/4,000
|
130,000/4,000
|
8
|
40,000
|
Standard_M416s_8_v3
|
416
|
7,600
|
64
|
130,000/4,000
|
130,000/4,000
|
8
|
40,000
|
Standard_M624s_12_v3
|
624
|
11,400
|
64
|
130,000/4,000
|
130,000/4,000
|
8
|
40,000
|
Standard_M832s_12_v3
|
832
|
11,400
|
64
|
130,000/4,000
|
130,000/4,000
|
8
|
40,000
|
Standard_M832s_16_v3
|
832
|
15,200
|
64
|
130,000/ 8,000
|
260,000/ 8,000
|
8
|
40,000
|
Msv3 High Memory series (SCSI)
Size
|
vCPU
|
Memory in GiB
|
Max data disks
|
Max uncached Premium SSD throughput: IOPS/MBps
|
Max uncached Ultra Disk and Premium SSD V2 disk throughput: IOPS/MBps
|
Max NICs
|
Max network bandwidth (Mbps)
|
Standard_M416s_6_v3
|
416
|
5,696
|
64
|
130,000/4,000
|
130,000/4,000
|
8
|
40,000
|
Standard_M416s_8_v3
|
416
|
7,600
|
64
|
130,000/4,000
|
130,000/4,000
|
8
|
40,000
|
Standard_M624s_12_v3
|
624
|
11,400
|
64
|
130,000/4,000
|
130,000/4,000
|
8
|
40,000
|
Standard_M832s_12_v3
|
832
|
11,400
|
64
|
130,000/4,000
|
130,000/4,000
|
8
|
40,000
|
Standard_M832s_16_v3
|
832
|
15,200
|
64
|
130,000/ 8,000
|
130,000/ 8,000
|
8
|
40,000
|
Mdsv3 High Memory series (NVMe)
Size
|
vCPU
|
Memory in GiB
|
Temp storage (SSD) GiB
|
Max data disks
|
Max cached* and temp storage throughput: IOPS / MBps
|
Max uncached Premium SSD throughput: IOPS/MBps
|
Max uncached Ultra Disk and Premium SSD V2 disk throughput: IOPS/MBps
|
Max NICs
|
Max network bandwidth (Mbps)
|
Standard_M416ds_6_v3
|
416
|
5,696
|
400
|
64
|
250,000/1,600
|
130,000/4,000
|
130,000/4,000
|
8
|
40,000
|
Standard_M416ds_8_v3
|
416
|
7,600
|
400
|
64
|
250,000/1,600
|
130,000/4,000
|
130,000/4,000
|
8
|
40,000
|
Standard_M624ds_12_v3
|
624
|
11,400
|
400
|
64
|
250,000/1,600
|
130,000/4,000
|
130,000/4,000
|
8
|
40,000
|
Standard_M832ds_12_v3
|
832
|
11,400
|
400
|
64
|
250,000/1,600
|
130,000/4,000
|
130,000/4,000
|
8
|
40,000
|
Standard_M832ds_16_v3
|
832
|
15,200
|
400
|
64
|
250,000/1,600
|
130,000/ 8,000
|
260,000/ 8,000
|
8
|
40,000
|
Mdsv3 High Memory series (SCSI)
Size
|
vCPU
|
Memory in GiB
|
Temp storage (SSD) GiB
|
Max data disks
|
Max cached* and temp storage throughput: IOPS / MBps
|
Max uncached Premium SSD throughput: IOPS/MBps
|
Max uncached Ultra Disk and Premium SSD V2 disk throughput: IOPS/MBps
|
Max NICs
|
Max network bandwidth (Mbps)
|
Standard_M416ds_6_v3
|
416
|
5,696
|
400
|
64
|
250,000/1,600
|
130,000/4,000
|
130,000/4,000
|
8
|
40,000
|
Standard_M416ds_8_v3
|
416
|
7,600
|
400
|
64
|
250,000/1,600
|
130,000/4,000
|
130,000/4,000
|
8
|
40,000
|
Standard_M624ds_12_v3
|
624
|
11,400
|
400
|
64
|
250,000/1,600
|
130,000/4,000
|
130,000/4,000
|
8
|
40,000
|
Standard_M832ds_12_v3
|
832
|
11,400
|
400
|
64
|
250,000/1,600
|
130,000/4,000
|
130,000/4,000
|
8
|
40,000
|
Standard_M832ds_16_v3
|
832
|
15,200
|
400
|
64
|
250,000/1,600
|
130,000/ 8,000
|
130,000/ 8,000
|
8
|
40,000
|
*Read iops is optimized for sequential reads
Regional Availability and Pricing
The VMs are now available in West Europe, North Europe, East US, and West US 2. For pricing details, please take a look here for Windows and Linux.
Additional resources:
Details on Mv3 Very High Memory Virtual Machines
We are thrilled to unveil the latest and largest additions to our Mv3-Series, Standard_M896ixds_32_v3 and Standard_M1792ixds_32_v3 VM SKUs. These new VM SKUs are the result of a close collaboration between Microsoft, SAP, experienced hardware partners, and our valued customers.
Key features on the new Mv3 VHM VMs
- Unmatched Memory Capacity: With close to 32TB of memory, both the Standard_M896ixds_32_v3 and Standard_M1792ixds_32_v3 VMs are ideal for supporting very large in-memory databases and workloads.
- High CPU Power: Featuring 896 cores in the Standard_M896ixds_32_v3 VM and 1792 vCPUs** in the Standard_M1792ixds_32_v3 VM, these VMs are designed to handle high-end S/4HANA workloads, providing more CPU power than other public cloud offerings. Enhanced Network and Storage Bandwidth: Both VM types provide the highest network and storage bandwidth available in Azure for a full node VM, including up to 200-Gbps network bandwidth with Azure Boost.
- Optimal Performance for SAP HANA: Certified for SAP HANA, these VMs adhere to the SAP prescribed socket-to-memory ratio, ensuring optimal performance for in-memory analytics and relational database servers.
Size |
vCPU or cores |
Memory in GiB |
SAP HANA Workload Type |
Standard_M896ixds_32_v3 |
896 |
30,400 |
OLTP (S/4HANA) / OLAP Scaleup |
Standard_M1792ixds_32_v3 |
1792** |
30,400 |
OLAP Scaleup |
**Hyperthreaded vCPUs


Recent Comments