by Scott Muniz | Jan 26, 2023 | Security, Technology
This article is contributed. See the original author and article here.
CISA has added one new vulnerability to its Known Exploited Vulnerabilities Catalog, based on evidence of active exploitation. This type of vulnerability is a frequent attack vector for malicious cyber actors and poses a significant risk to the federal enterprise. Note: To view the newly added vulnerabilities in the catalog, click on the arrow in the “Date Added to Catalog” column, which will sort by descending dates.
Binding Operational Directive (BOD) 22-01: Reducing the Significant Risk of Known Exploited Vulnerabilities established the Known Exploited Vulnerabilities Catalog as a living list of known CVEs that carry significant risk to the federal enterprise. BOD 22-01 requires FCEB agencies to remediate identified vulnerabilities by the due date to protect FCEB networks against active threats. See the BOD 22-01 Fact Sheet for more information.
Although BOD 22-01 only applies to FCEB agencies, CISA strongly urges all organizations to reduce their exposure to cyberattacks by prioritizing timely remediation of Catalog vulnerabilities as part of their vulnerability management practice. CISA will continue to add vulnerabilities to the Catalog that meet the specified criteria.
by Scott Muniz | Jan 25, 2023 | Security, Technology
This article is contributed. See the original author and article here.
Today, the Cybersecurity and Infrastructure Security Agency (CISA), the National Security Agency (NSA), and the Multi-State Information Sharing and Analysis Center (MS-ISAC) released joint Cybersecurity Advisory (CSA) Protecting Against Malicious Use of Remote Monitoring and Management Software. The advisory describes a phishing scam in which cyber threat actors maliciously use legitimate remote monitoring and management (RMM) software to steal money from victim bank accounts.
CISA encourages network defenders to review the advisory for indicators of compromise, best practices, and recommended mitigations, which highlights the threat of additional types of malicious activity using RMM, including its use as a backdoor for persistence and/or command and control (C2).
by Contributed | Jan 25, 2023 | Technology
This article is contributed. See the original author and article here.
Introduction
As Microsoft Cloud Solution Architects, we get asked by Businesses, IT Managers and Cybersecurity Experts to accurately report on the Vulnerabilities and CVEs in our environments. This could be as easy as just deploying Endpoint Protection updates or as advanced as deploying every category and 3rd Party Updates using Microsoft Defender for Endpoint.
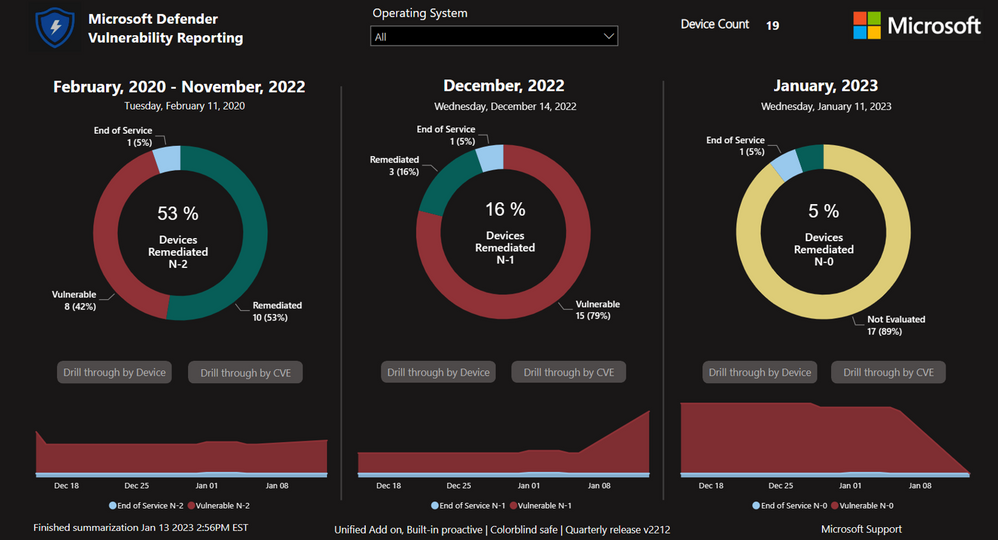
Microsoft Defender for Endpoint Vulnerability Reporting with Power BI – involves implementing a cloud-based reporting and visualization solution that brings exposure to active threats into sharp focus. It is intended to provide value to IT Leaders, Stakeholders, Security & Compliance teams, and Operations Teams that are responsible for mitigating CVE documented risks. The reports provide rich drill throughs that enable full understanding of an organization’s current data and trends. The data is sourced from Microsoft Defender for Endpoint using API calls, stored in a small serverless Azure SQL instance, and can be accessed from anywhere on any device.
Outcomes
Dashboard with summary view that shows CVE vulnerability status for the current month (n-0), the previous month (n-1), and all prior.
Customization options to exclude specific CVEs and classes of vulnerabilities.
Cloud installation that creates a small Azure serverless SQL instance, an Azure Automation Account, and an Azure Service Principal.
The Report


Conclusion
This solution will provide accurate reporting of your Vulnerabilities across the entire Defender for Endpoint Estate.
How do I book this engagement?
If you are a Microsoft Premier or Unified customer, you can reach out to your Customer Success Account Manager (CSAM) for more questions!
Special thanks to the Dev Team:
Chris Sugdinis, Ken Wygant, Michael Schmidt, Nathan Hughes, Shawn Rand, Todd Sterrett, Jon Ellis, Suhail Abdul Salam, Vikram Sahay, Werner Rall
Disclaimer
The sample scripts or Power BI Dashboards are not supported under any Microsoft standard support program or service. The sample scripts or Power BI Dashboards are provided AS IS without warranty of any kind. Microsoft further disclaims all implied warranties including, without limitation, any implied warranties of merchantability or of fitness for a particular purpose. The entire risk arising out of the use or performance of the sample scripts and documentation remains with you. In no event shall Microsoft, its authors, or anyone else involved in the creation, production, or delivery of the scripts or Power BI Dashboards be liable for any damages whatsoever (including, without limitation, damages for loss of business profits, business interruption, loss of business information, or other pecuniary loss) arising out of the use of or inability to use the sample scripts or documentation, even if Microsoft has been advised of the possibility of such damages.

by Scott Muniz | Jan 24, 2023 | Security, Technology
This article is contributed. See the original author and article here.
Official websites use .gov
A .gov website belongs to an official government organization in the United States.

Secure .gov websites use HTTPS
A
lock ( )
) or
https:// means you’ve safely connected to the .gov website. Share sensitive information only on official, secure websites.
by Scott Muniz | Jan 24, 2023 | Security, Technology
This article is contributed. See the original author and article here.
CISA released two Industrial Control Systems (ICS) advisories on January 24, 2023.These advisories provide timely information about current security issues, vulnerabilities, and exploits surrounding ICS.
CISA encourages users and administrators to review the newly released ICS advisories for technical details and mitigations:

Recent Comments