Get it now in our marketplace
|
|---|
 |
Build Customized Machine Images with a GUI: This offer from RIS AG provides a wizard-guided user interface for the XOAP automation platform, which can facilitate customized images and their management. Create, configure, and build machine images fully automated across your cloud environments. |
 |
CentOS 7.9 Base on Azure: This offer from Solve DevOps provides CentOS 7.9 on a Microsoft Azure virtual machine. CentOS is built from the source code of Red Hat Enterprise Linux (RHEL). With CentOS 7.9, you can enjoy the latest features and security updates from the upstream RHEL distribution. |
 |
CentOS Stream 9 Minimal Gen2: This offer from ProComputers provides a minimal version of CentOS Stream 9 on a Microsoft Azure virtual machine. Azure Linux Agent and cloud-init are included, Security-Enhanced Linux (SELinux) is enabled, and Accelerated Networking is supported.
|
 |
Digital Gov Portal: Use the Digital Government Portal from Mint Management Technologies to engage citizens, streamline service delivery, and build community trust. Management and reporting tools simplify administration and help government workers improve decision-making.
|
 |
Eureka: Eureka, an end-to-end DevSecOps platform for orchestrating security scanners, lets you easily integrate your scanners with CI/CD pipelines. Run the scanning agents inside your own environment and keep the scan data there for maximum privacy.
|
 |
Footprints AI for Grocery: Footprints AI’s proprietary AI technology combines offline and online customer data to create a comprehensive view of customer behavior, enabling grocers to understand their customers’ shopping habits and create personalized experiences to drive loyalty.
|
|
Footprints AI for Retail Properties: Footprints AI’s proprietary AI technology combines offline and online customer data to create a comprehensive view of customer behavior, enabling retail property owners and managers to better meet their needs.
|
 |
HyperExecute Private Cloud: HyperExecute by LambdaTest, a lightning-fast test execution and orchestration platform, reduces developer friction and helps businesses release features and products quicker. HyperExecute is framework-agnostic and language-agnostic.
|
 |
JBoss EAP on Azure Red Hat OpenShift: This solution from Red Hat automates most of the boilerplate steps to provision JBoss EAP on an Azure Red Hat OpenShift (ARO) cluster. This offer requires a JBoss EAP subscription and works on a bring-your-own-subscription basis.
|
 |
Kafka: Intended for production environments on Microsoft Azure, this offer from Kockpit Analytics provides Apache Kafka 2.1 on Ubuntu 20.04 LTS. Kockpit’s images are always up to date and built to work right out of the box.
|
 |
Kafka with WebUI, Secured and Supported by HOSSTED: This offer from HOSSTED provides a one-click deployment for Apache Kafka, a distributed event store and stream-processing platform. HOSSTED apps come with live support, built-in SSL, and integration with Azure Active Directory.
|
 |
Magento, Secured and Supported by HOSSTED: This offer from HOSSTED provides a one-click deployment for Magento, a platform with built-in PHP that helps programmers create e-commerce websites. HOSSTED apps come with live support, built-in SSL, and integration with Azure Active Directory.
|
 |
MongoDB 4 with WebUI, Secured and Supported by HOSSTED: This offer from HOSSTED provides a one-click deployment for MongoDB 4, a NoSQL database program. Also included are the Mongo Express administrator interface and the phpMoAdmin administration tool for PHP.
|
 |
Prime SMPP: Made for the telecommunications industry, Prime SMPP provides a reliable and efficient way for short message service centers and external short messaging entities to exchange SMS messages.
|
|
Prime SMPP with Firewall: Made for the telecommunications industry, Prime SMPP provides a reliable way for short message service centers and external short messaging entities to exchange SMS messages. This offer includes a firewall to protect SMS infrastructure by monitoring and controlling SMPP traffic.
|
 |
ProActive Discover: Revolutionize how you approach your business application evaluation journey with a cloud-based analysis platform that helps you reduce risk, cut costs, decrease time to value, analyze the fit of standard Microsoft Dynamics 365 vs. your business needs, and do more with less.
|
 |
Riverbed Acceleration Solutions: Achieve fast, agile, secure acceleration of any app over any network to users, whether mobile, remote, or in the office. Built on decades of WAN optimization leadership and innovation, Riverbed’s acceleration portfolio powers cloud, SaaS, and client apps at peak speeds.
|
 |
Sayura: This cloud-native low-code/no-code platform helps you wrap application programming interface (API) endpoints into smarter and more efficient APIs. Through a graphic user interface-based development studio, Sayura delivers fast deployments to any microservice architecture.
|
 |
ScaleOps AKS: This resource management platform continuously optimizes Kubernetes workloads, including pod rightsizing, horizontal scaling, node optimization, and pod scheduling. ScaleOps eliminates 80 percent of Kubernetes cloud spending and frees engineers from repeated ongoing configurations.
|
 |
SolarWinds Observability: Purpose-built for DevOps and IT teams, this solution from SolarWinds delivers full-stack, unified visibility for cloud-native web applications and from across the environment, including applications, infrastructure, logs, databases, networks, and digital experiences.
|
 |
TerraEye: TerraEye, a cutting-edge remote sensing application, utilizes satellite and unmanned aerial vehicle (UAV) data, as well as data from connected ground stations, to provide a comprehensive view of land and natural resources for the mining, oil and gas, government, and energy industries.
|
 |
VisionAI Toolkit for Workplace Safety: This workplace health and safety solution offers a set of command-line utilities for running Vision AI scenarios. It supports more than 60 common scenarios, each well-tested and ready for deployment, for workplace safety and company compliance policies.
|
 |
WADE Data Platform Automation: WADE, a next-generation data automation and orchestration service for Microsoft Azure Synapse, Databricks Lakehouse, and Microsoft SQL Server on-premises, is an end-to-end SaaS solution that accelerates data insights and significantly shortens time to value.
|
 |
WeTransact for Start-Ups: Publish your solution on the Microsoft commercial marketplace in a matter of days thanks to WeTransact.io, which takes care of all the technical aspects of listing. This offer is tailored for start-ups, defined by WeTransact.io as companies funded less than two years ago.
|
 |
Windows Server 2016 Datacenter with Containers (Mirantis Container Runtime): This virtual machine image packages Windows Server 2016 Datacenter, Mirantis Container Runtime, Docker Container Runtime, and Docker Engine to enable the creation of cloud-native apps using containers and microservices.
|
|
Windows Server 2022 Datacenter with Containers (Mirantis Container Runtime): Enable cloud-native app creation using containers and microservices via this virtual machine image that packages Windows Server 2022 Datacenter, Mirantis Container Runtime, Docker Container Runtime, and Docker Engine.
|
Go further with workshops, proofs of concept, and implementations
|
|---|
 |
Active AI: Exploration & Enablement: 4-Hour Workshop: This consultation with Active Solution Sverige AB will help you identify how artificial intelligence services in Microsoft Azure, like Azure OpenAI Service, Azure Machine Learning, and Azure Cognitive Services, can benefit your business. |
 |
AS2 and EDIFACT EDI Integration using Azure Logic Apps: Architect and manage Applicability Statement 2 (AS2) electronic data interchange (EDI) integration with this INFOC solution that uses Microsoft Azure Logic Apps to implement AS2 and EDIFACT messaging to exchange data with trading partners.
|
 |
Azure Cost Calculation and FinOps: 3-Day Workshop: In this workshop, Direct Experts will cover the capabilities of Azure cost calculation and FinOps, make configurations according to Microsoft best practices and conformed to your environment, and give you guidance and hands-on training.
|
 |
Azure Data Science Adoption: 1-Month Implementation: This Crayon consultation for advanced analysts facilitates work with large amounts of data and enables automation. Deliverables include a configured data science environment, a machine learning model, and a solution knowledge transfer.
|
 |
Azure Infrastructure: 3-Day Workshop: This workshop covers Microsoft Azure infrastructure and configures it according to Microsoft best practices. Direct Experts will provide you hands-on training and guide you on how to initiate your own Azure infrastructure journey.
|
 |
Azure Managed Services: A well-managed Microsoft Azure cloud is critical to maximizing investment and remaining competitive. In this managed service, PwC experts can offer administration, engineering, and integration support to enable continuous innovation on your digital transformation journey.
|
 |
Azure Migration: 4-Month Implementation: Japan Business Systems (JPS) will design and build your Microsoft Azure environment based on the Microsoft Cloud Adoption Framework, migrate your servers to Azure, and operate the environment after migration. This service is available only in Japanese.
|
 |
Azure Modern Data Warehouse: 6-Week Implementation: This Crayon consultation helps you effectively use data to make business decisions. It includes environmental assessment, Microsoft Azure Landing Zone configuration, a migration plan, a data warehouse implementation, a data model build, and more.
|
 |
Azure Sentinel Monitoring Proof of Concept: Zenith & Company Ltd. will use Microsoft Sentinel to detect threats across your organization and respond to them with automation in this security information event management (SIEM) proof of concept, available only in Korean.
|
 |
Azure SQL Database Tuning: 1-Week Implementation: This consultation is designed for organizations that want to improve the efficiency of their database environment. Experts from Crayon will tune your Microsoft Azure database to stabilize the environment and reduce the risk of downtime.
|
 |
Azure Virtual Desktop: 5-Month Implementation: In this consultation, available only in Japanese, Japan Business Systems (JBS) will build your organization an Azure Virtual Desktop environment provided by Microsoft Japan. By utilizing this framework and established processes, JBS reduces time and effort for its customers.
|
 |
Azure VMware Solution: 4-Week Proof of Concept: In this consultation with CompuNet, you will learn the benefits of Windows virtualization and see how Azure VMware Solution combines the VMware software-defined data center (SDDC) with Azure BareMetal Infrastructure.
|
 |
BigData Workshop: Learn about big-data use cases and best practices in this scenario-focused and hands-on lab, available only in Korean. Zenith & Company Ltd. data engineers will lead a practice-oriented Q&A around services available in Microsoft Azure and Azure Machine Learning.
|
 |
Cerberus Security Service Implementation: Noventiq experts will implement Cerberus Security Service to provide your organization with security information and event management (SIEM) to detect, analyze, and respond to threats before they impact business. This service is available only in Spanish.
|
 |
Cloud Migration Implementation: DataArt will deliver an end-to-end migration to Microsoft Azure. Depending on the specific project goals and migration options, deliverables may include proofs of concept, IT infrastructure layout documentation, a security assessment, and more.
|
 |
CloudXper ProOps Managed Service (1 Year): LG CNS Co. Ltd.’s CloudXper ProOps service helps companies make a smooth transition to Microsoft Azure. Integrated operation consulting services are available in the areas of infrastructure, applications, and security. This service is available only in Korean.
|
 |
Data Analysis Platform for Azure: 1-Month Implementation: Japan Business Systems (JBS) will build a data analysis infrastructure to support your business on Microsoft Azure. A data mesh architecture will allow coordination of governance tools and environmental separation for each subscription. This service is available only in Japanese.
|
 |
Data Estate Modernization and Managed Services: Let Kyndryl modernize your legacy systems and enable scalable data and AI solutions to propel your business. Kyndryl will design and execute an enterprise data estate modernization strategy using Microsoft Purview, Azure Synapse, and other Azure services.
|
 |
Database Migration to Azure: 2-Month Implementation: Crayon will analyze your database environment and prepare an SQL Server migration plan, then migrate your environment to Microsoft Azure so you can benefit from high availability, increased performance, and scalability.
|
 |
Database Modernization: 4-Month Implementation: Softtek will design an operational model to help you process information and answer business questions, then deploy a solution on Microsoft Azure. This service is available only in Spanish.
|
 |
Datacenter Transformation: 3-Week Proof of Concept: Softtek will simplify your migration to Microsoft Azure, reduce your costs, and help you manage the platform. A pilot will precede the migration. This service is available only in Spanish.
|
 |
DRaaS: 10-Day Implementation: IFI Techsolutions will implement and manage a disaster recovery solution to protect your critical data and applications. Annual failover testing will be conducted, along with reporting and health monitoring.
|
 |
Entra Permissions Management: 8-Week Proof of Concept: ITC Secure will deliver a proof of concept of Microsoft Entra Permissions Management to demonstrate value. ITC Secure’s consultants will help you deploy the tooling in your Azure or multi-cloud environments.
|
 |
Hybrid Security: 2-Week Implementation: IFI Techsolutions will evaluate your organization’s security landscape, then implement a security information event management (SIEM) and security orchestration automated response (SOAR) solution with Microsoft Sentinel.
|
 |
Lemongrass Rise+: 2-Month Implementation: Lemongrass Consulting will implement Lemongrass Rise+, a rapid, low-risk migration path for ancillary SAP and non-SAP systems. It’s most suitable for customers seeking minimal functional change along with Azure-native tooling and services.
|
 |
Linux on Azure: 2-Week Implementation: Want to implement Linux on Microsoft Azure? IFI Techsolutions will assess your servers and applications for cloud readiness and dependencies, then migrate them to a production environment using Microsoft tools. Testing and knowledge transfer will follow.
|
 |
MLOps on Azure Machine Learning: 1-Day Workshop: Lingaro’s workshop will teach attendees how to use Azure Machine Learning for effective MLOps, addressing common challenges and improving the efficiency of machine learning projects.
|
 |
SCC Cyber MDR for End User: SCC’s managed detection and response service combines Microsoft Sentinel, Microsoft Defender for Endpoint, and the Microsoft 365 Defender stack with SCC’s experienced security operations team to protect your hybrid workforce.
|
|
SCC Cyber MDR for Infrastructure: SCC’s managed detection and response service combines Microsoft Sentinel, Microsoft Defender for Endpoint, and the Microsoft 365 Defender stack with SCC’s experienced security operations team to protect infrastructure across your multi-cloud estate.
|
 |
SCC Hyperscale Cloud Managed Services (1 Year): Through the SCC Hyperscale managed service for Azure, SCC establishes long-term relationships with customers built on trust. Benefit from Azure’s incredible range of services while utilizing SCC to deliver management and continuous innovation.
|
 |
SVA Workshop: Azure Kubernetes Service Basics: In this workshop, SVA will present an overview of the functions of Azure Kubernetes Service. Particular attention will be given to the differences between Azure Kubernetes Service and self-managed Kubernetes clusters. This offer is available only in German.
|
 |
The SME Workplace: Jongen van Beheer’s services are intended for organizations with 10 to 300 employees. In this engagement, IT specialists from Jongen van Beheer, part of SLTN IT Services B.V., will ensure the optimal function of your ICT environment. Migration of servers and data to Microsoft 365 and Azure will be handled on a project basis. This offer is available only in Dutch.
|
 |
UST xpresso.ai: 8-Week Proof of Concept: UST Global will deliver a proof of concept of xpresso.ai, an AI/ML application lifecycle management platform with built-in MLOps capabilities. xpresso.ai facilitates the development and deployment of AI/ML models by enterprise data science and analytics teams.
|
 |
VMware Azure Migration: 4-Week Rapid Implementation: RSM helps organizations improve efficiency and cost optimization by migrating on-premises applications, infrastructure, and data to Microsoft Azure. RSM’s VMware service can help you plan your path to Azure VMware Solution.
|
 |
Windows and SQL Server Migration: IFI Techsolutions will create a comprehensive plan to migrate your SQL Server databases to Microsoft Azure, then execute the plan using tools such as the Azure Data Migration Service or the Data Migration Assistant. Management and support will follow the migration.
|
 |
wMCHS: Wragby’s Multi-Cloud and Hybrid Security: Wragby Multi-Cloud and Hybrid Security (wMCHS), Wragby’s managed advisory service, helps organizations secure their assets and services in multi-cloud environments. wMCHS is powered by Microsoft Defender for Cloud.
|
Contact our partners
|
|---|
2-Week Azure Security Assessment |
Application Modernization
|
Automation for Marketing and Sales Using Dialogue AI
|
Azenix AzLand CAF Landing Zone IP Offer
|
Azure Cost Calculation: 2-Day Assessment
|
Azure Cost Calculation: 2-Hour Briefing
|
Azure Infrastructure: 2-Day Assessment
|
Azure Infrastructure: 2-Hour Briefing
|
Azure Landing Zone: 2-Day Assessment
|
Azure Landing Zone: 2-Hour Briefing
|
Azure Migration: 2-Day Assessment
|
Azure Migration: 2-Hour Briefing
|
Azure Virtual Desktop: 1-Day Assessment
|
BlueCat DNS Edge Service Point v4: Advanced Setup
|
CAF Strategic Assessment for Microsoft Azure
|
Cloud Readiness Assessment
|
Code Intelligence
|
Data Warehouse Modernization Assessment
|
DevOps as a Service by CodeValue
|
DevOps at Production Scale in a Week with Azure
|
Digital Platform for Water and Utility System
|
Digital Transformation for M&A and Divestures
|
HCL Compass on Azure
|
ImmuniWeb Continuous
|
ImmuniWeb MobileSuite
|
ImmuniWeb Neuron
|
JBoss EAP on Azure
|
MDR for Microsoft for Education
|
Medis FHIR
|
MLOps Platform: 2-Week Assessment (Chinese Version)
|
One Identity Starling Connect
|
Predictive Maintenance: Advanced Offer
|
Protect Your Organization from Fraudulent Hires
|
Rierino Core Low-Code Platform
|
Risk Management with Microsoft Azure: 2-Week Assessment
|
Spike Digital DE Cloud Security Consulting
|
Spyglass Cloud Security: 6-Week Assessment
|
Transparity Managed Extended Detection and Response (MXDR)
|
Trustwave MailMarshal Email Security
|
UnityTrip
|
zblocks Platform |
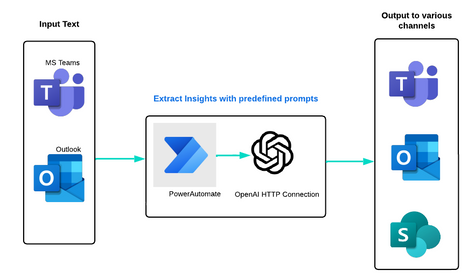


After parsing we need to loop the array and assign the text to the variable


.jpg")


Recent Comments