by Contributed | Mar 31, 2023 | Technology
This article is contributed. See the original author and article here.
Hello everyone,
Today, we’re sharing our March train for feature and breaking changes. We also communicate these changes on release notes and via email. We are continuing to make it easier for our customers to manage lifecycle changes (deprecations, retirements, service breaking changes) within the new Entra admin center as well. In addition, we will be including new feature launch announcements as part of this blog post going forward so you can see both changes to existing features and new features in a single list.
March 2023 change announcements:
Security Improvements
Number Matching Message Center post refresh
Microsoft Authenticator app’s number matching feature has been Generally Available since November 2022. If you haven’t already leveraged the rollout controls (via Azure Portal Admin UX and MSGraph APIs) to smoothly deploy number matching for users of Microsoft Authenticator push notifications, we highly encourage you to do so. We had previously announced that we will remove the admin controls and enforce the number match experience tenant-wide for all users of Microsoft Authenticator push notifications starting February 27, 2023. After listening to customers, we will extend the availability of the rollout controls for a few more weeks. Organizations can continue to use the existing rollout controls until May 8, 2023, to deploy number matching in their organizations. Microsoft services will start enforcing the number matching experience for all users of Microsoft Authenticator push notifications after May 8th, 2023. We’ll also remove the rollout controls for number matching after that date.
If customers don’t enable number match for all Microsoft Authenticator push notifications prior to May 8, 2023, users may experience inconsistent sign ins while the services are rolling out this change. To ensure consistent behavior for all users, we highly recommend you enable number match for Microsoft Authenticator push notifications in advance. Learn more at Number match documentation | Defend your users from MFA fatigue attacks – Microsoft Community Hub | Advanced Microsoft Authenticator security features are now generally available! – Microsoft Community Hub
Azure Multifactor Authentication Server
Beginning September 30, 2024, Azure Multifactor Authentication Server deployments will no longer service multifactor authentication (MFA) requests, which could cause authentications to fail for your organization. To ensure uninterrupted authentication services and to remain in a supported state, organizations should migrate their users’ authentication data to the cloud-based Azure MFA service using the latest Migration Utility included in the most recent Azure MFA Server update. Learn more at Azure MFA Server Migration.
Enabling System-preferred authentication methods
Today, various authentication methods can be chosen by users as their default. However, not all authentication methods provide the same level of security. This situation creates potential risk for organizations when less secure authentication methods are chosen, especially in place of phishing-resistant methods.
To address this, we’re introducing system-preferred authentication for MFA. When enabled, at runtime the most secure authentication method of the user’s registered methods will be requested as the second factor of authentication. This replaces the previous feature, where the user selects a ‘default’ method and is therefore always prompted for that method first, even when more secure methods are registered and available. This functionality is available today using MSGraph API. Once enabled, users will be prompted to sign in using the most preferred authentication method available. Learn more at System-preferred multifactor authentication (MFA) – Azure Active Directory – Microsoft Entra | Microsoft Learn.
Deprecation of ‘Require approved client app’ Conditional Access Grant
On March 31, 2026, the Require approved client app control in Azure Active Directory (Azure AD) Conditional Access will be retired and no longer enforced. Before that date, you’ll need to transition and start using the Require app protection policy control. We encourage you to make the switch sooner to gain the richer benefits of the Require app protection policy control, which has all the same capabilities, plus:
- It verifies the corresponding Intune policy.
- It’s applied before a user is granted access.
- It has a strengthened security posture.
To avoid any disruptions in service, transition to using the ‘Require app protection policy’ control in Azure AD Conditional Access by March 31, 2026. If you have questions, get answers from community experts in Microsoft Q&A.
Retirement of managing authentication methods in legacy Multifactor Authentication (MFA) & Self-Service Password Reset (SSPR) policy
Beginning September 30, 2024, we will no longer allow authentication methods to be managed in the legacy MFA and SSPR policies. Organizations should migrate their methods to the converged authentication methods policy where methods can be managed centrally for all authentication scenarios including passwordless, multi-factor authentication and self-service password reset. Learn more at Manage authentication methods for Azure AD.
IPv6 coming to Azure AD
Earlier we announced our plan to bring IPv6 support to Microsoft Azure AD enabling our customers to reach the Azure AD services over IPv4, IPv6, or dual stack endpoints. This is just a reminder that we’ll begin introducing IPv6 support into Azure AD services in a phased approach, starting March 31st, 2023.
If your networks don’t support IPv6, you don’t need to take any action to change your configurations or policies. For most customers, IPv4 won’t completely disappear from their digital landscape, so we aren’t planning to require IPv6 or to deprioritize IPv4 in any Azure AD features or services. We will continue to share additional guidance on IPv6 enablement in Azure AD at this easy to remember link https://aka.ms/azureadipv6.
User Experience Improvements
Modernizing Terms of Use Experiences
Starting July 2023, we’re modernizing the following Terms of Use end user experiences with an updated PDF viewer and moving the experiences from https://account.activedirectory.windowsazure.com to https://myaccount.microsoft.com:
- View previously accepted terms of use
- Accept or decline terms of use as part of the sign-in flow
No functionalities will be removed. The new PDF viewer adds functionality and the limited visual changes in the end-user experiences will be communicated in a future update. If your organization has allow-listed only certain domains, you must ensure your allow-list includes the domains ‘myaccount.microsoft.com’ and ‘*.myaccount.microsoft.com’ for Terms of Use to continue working as expected. For additional information visit https://aka.ms/touuiupdate
Improved My Groups Experience
A new and improved My Groups experience is now available at myaccount.microsoft.com/groups and in May 2023, the old experience will be deprecated. The previous URL (mygroups.microsoft.com) will redirect users to the new experience at myaccount.microsoft.com/groups.
My Groups enables end users to easily manage groups, such as finding groups to join, managing groups they own, and managing existing group memberships. Based on customer feedback, we’ve also added:
- Sorting and filtering on lists of groups and group members
- A full list of group members in large groups, and
- An actionable overview page for membership requests
Today, end users can get the richer benefits of the new My Groups by proactively switching to myaccount.microsoft.com/groups. Navigation between the old and new experiences is available via notification banners on each site.
Note: the ‘Self Service Group Management’ admin controls will no longer be available for the new My Groups and will be deprecated in May 2023. Admins can no longer restrict owners or users from accessing or using My Groups. Admins can still manage end users’ ability to create M365 and Security groups using the settings described here.
This change will automatically occur for all customers and there are no actions that need to be taken. Learn more at Update your Groups info in the My Apps portal – Microsoft Support.
My Apps Portal Improvements
If your organization uses myapps.microsoft.com to discover and launch apps, and has set up an allow-list for only specific certificates and/or domains, you’ll need to update your allow-list in order for app launching to continue working as expected. We’ve introduced a new endpoint to launch apps for better performance and resilience. App launch requests will go to a new domain: launcher.myapps.microsoft.com.
If you use myapps.microsoft.com/signin or account.activedirectory.windowsazure.com/applications/signin deep links and have allow-listed only certain certificates, you will need to update your allow-list to include certificates from myapplications.microsoft.com. If you have allow-listed only specific domains or IPs, you will need to update the allow-list to include launcher.myapps.microsoft.com. Please ensure to update your allow-list latest by June 30, 2023 for My Apps portal to continue working as expected.
To easily check if you need to update your certificate allow-list, go to https://myapplications.microsoft.com. If it loads as expected, no update is needed. If you encounter an issue, you’ll need to make an update.
Whichever method you used to allow-list the My Apps certificate in the past, you should use the same method to allow-list the new one coming from My Apps. Retrieving the My Apps certificate that you need to allow-list will vary depending on the browser you’re using. On Edge, select the lock icon in the URL bar, to the left of the URL. Then select the option that says “Connection is secure” from the dropdown. In the “Connection is secure” details, select the certificate icon which will open the Certificate viewer containing the details of the certificate. For additional information visit: Office 365 URLs and IP address ranges – Microsoft 365 Enterprise | Microsoft Learn
My Apps Secure Sign In Extension
Beginning May 2023, the My Apps Secure Sign In Extension will receive an update to align with Chromium’s new Manifest Version 3 format. Some features that use this extension will experience updates, but no action is needed at this time. These updates are:
- The optional experience One-click app configuration of SAML single sign-on, which was available for select SAML apps from the Azure Marketplace or Azure AD application gallery, will be retired in May 2023. All applications that were previously configured using this feature will continue to work as expected, and no action is needed at this time.
- My Apps app search behavior will now search across all apps in MyApps and has new launching behavior. When you enter a search term, the My Apps portal will now open in a new tab with your query applied to your list of apps. You can then launch apps from the search results. There will no longer be a “Recently Used” section in the extension user experience.
- App Proxy link translation feature will now use dynamic and session-scoped rules. This introduces a new limit of 2250 unique link translations per tenant.
Please ensure you are using the most recent version of the Edge Add-on or Chrome extension. Please note, support for the Firefox version of this extension ended in September 2021.
Azure AD Admin Center will redirect to Microsoft Entra Admin Center
Beginning April 1, 2023, Azure AD Admin Center (https://aad.portal.azure.com) will redirect to Microsoft Entra Admin Center (https://entra.microsoft.com). You will still be able to complete all your Azure AD management tasks from within the new admin center. To ensure uninterrupted access to the management experience, organizations should update their firewall rules.
Will I still be able to access my Azure AD admin portal after April 1st, 2023?
Learn more at New Admin Center Unifies Azure AD with Other Identity and Access Products – Microsoft Community Hub | Microsoft Entra documentation | Microsoft Learn
Developer Experience Improvements
Azure AD Graph API
We want to reiterate our commitment to ensuring a smooth transition for our customers from Azure AD Graph to Microsoft Graph. As previously announced, Azure AD Graph will remain available until June 30, 2023. While we reserve the right to retire it at any time after June 2023, we will continue to monitor usage and provide ample time for customers to migrate off the APIs before retiring it. In the meantime, we will continue to offer support for Azure AD Graph with security-related fixes, and we discourage taking production dependencies on Azure AD Graph. All new features and functionalities will only be made in Microsoft Graph. We encourage all customers to prioritize migration to Microsoft Graph. Learn more at Migrate Azure AD Graph apps to Microsoft Graph – Microsoft Graph | Microsoft Docs.
PowerShell Deprecation
As we approach the end of the support period for the three PowerShell Modules – Azure AD, Azure AD Preview, and MSOnline – we want to remind you that the planned deprecation date is June 30th, 2023. Depending on the status of Azure AD API, some cmdlets might stop working after June 30th, 2023. We will continue to check usage and provide time for customers to migrate off the three PowerShell modules before retiring them. We will not retire an API/cmdlet unless we have feature parity for that API in Microsoft Graph.
Until we retire, we will continue to support security-related updates. We encourage you to continue migrating to the Microsoft Graph PowerShell SDK, which still is the focus of all our current and future PowerShell investments.
Learn more at Migrate from Azure AD PowerShell to the Microsoft Graph PowerShell SDK documentation.
Licensing Assignment API/PowerShell Retirement
We want to remind you that the planned retirement date for the Azure AD Graph and MSOnline PowerShell licensing assignment APIs and PowerShell cmdlets for existing tenants is March 31, 2023. APIs and cmdlets will not work for new tenants created after November 1, 2022.
We recommend prioritizing migration to MS Graph following the guidance in Migrate your apps to access the license managements APIs from Microsoft Graph – Microsoft Community Hub and in Find Azure AD and MSOnline cmdlets in Microsoft Graph PowerShell | Microsoft Docs.
Communication Schedule
Below is a quick snapshot of our communication schedule.
Category
|
Definition
|
Communication schedule
|
Retirement announcement
|
Signals the retirement of a feature, capability, or product in a specified period.
Typically, at this point, new customers are not permitted to adopt the service/feature, and engineering investments are reduced for the specified feature.
Later, the feature will no longer be available to any customer as it reaches the “end-of-life” state.
|
Twice per year
(March and September)
|
Breaking change announcement, feature change announcement
|
Breaking change: Expected to break the customer/partner experience if the customer doesn’t act or make a change in their workload for continued operation.
Feature change: Change to an existing Identity feature that doesn’t require customer action but is noticeable to the customer. These are typically UI/UX changes.
These changes generally happen more often and require a more frequent communication schedule.
|
Four times per year (March, June, September, and November)
|
Follow ongoing monthly updates on our release notes page: What’s new? Release notes – Azure Active Directory – Microsoft Entra | Microsoft Docs.
As always, we’d love to hear your feedback or suggestions. Let us know what you think in the comments below or on the Azure AD feedback forum. You may also send your questions, open issues, and feature requests through Microsoft Q&A by using the tag #AzureADChangeManagementMar2023Train.
Learn more about Microsoft Entra:
by Contributed | Mar 30, 2023 | Technology
This article is contributed. See the original author and article here.
By @Mark Kromer and @revinchalil
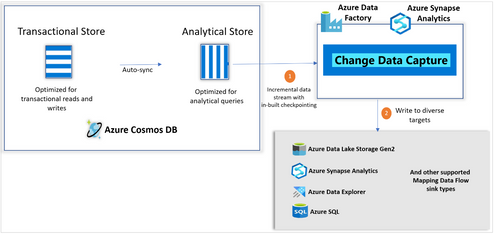
Making it super-easy to create efficient and fast ETL processing the cloud, Azure Data Factory has invested heavily in change data capture features. Today, we are super-excited to announce that Azure Cosmos DB analytics store now supports Change Data Capture (CDC), for Azure Cosmos DB API for NoSQL, and Azure Cosmos DB API for Mongo DB in public preview!
This capability, available in public preview, allows you to efficiently consume a continuous and (inserted, updated, and deleted) data from the analytical store. CDC is seamlessly integrated with Azure Synapse Analytics and Azure Data Factory, a scalable no-code experience for high data volume. As CDC is based on the analytical store, it does not consume provisioned RUs, does not affect the performance of your transactional workloads, provides lower latency, and has lower TCO.
Change Data Capture (CDC) with Analytical store. Click here for supported sink types on Mapping Data Flow.
Consuming incremental data from Cosmos DB
You can consider using analytical store CDC, if you are currently using or planning to use below:
- Incremental data capture using Azure Data Factory Data Flow or Copy activity
- One-time batch processing using Azure Data Factory
- Streaming Cosmos DB data
- Capturing deletes, intermediate changes, applying filters or projections or transformations on Cosmos DB Data
Note that analytical store has up to 2 min latency to sync transactional store data
Throughput isolation, lower latency and lower TCO
Operations on Cosmos DB analytical store do not consume the provisioned RUs and so do not impact your transactional workloads. CDC with analytical store also has lower latency and lower TCO, compared to using ChangeFeed on transactional store. The lower latency is attributed to analytical store enabling better parallelism for data processing and reduces the overall TCO enabling you to drive cost efficiencies.
No-code, low-touch, non-intrusive end-to-end integration
The seamless and native integration of analytical store CDC with Azure Synapse and Azure Data Factory provides the no-code, low-touch experience.
Incremental feed to the analytical platform of your choice
Change data capture capability enables an end-to-end analytical story providing the flexibility to write Cosmos DB data to any of the supported sink types. It also enables you to bring Cosmos DB data into a centralized data lake where you can federate your data from diverse data sources. You can flatten the data, partition it, and apply more transformations either in Azure Synapse Analytics or Azure Data Factory.
Setting up CDC in analytical store
You can consume incremental analytical store data from a Cosmos DB container using either Azure Synapse Analytics or Azure Data Factory, once the Cosmos DB account has been enabled for Synapse Link and analytical store has been enabled on a new container or an existing container.
On the Azure Synapse Data flow or on the Azure Data Factory Mapping Data flow, choose the Inline dataset type as “Azure Cosmos DB for NoSQL” and Store type as “Analytical”, as seen below.

Capabilities
In addition to providing incremental data feed from analytical store to diverse targets, CDC supports the following capabilities.
Support for applying filters, projections, and transformations on the change feed via source query
You can optionally use a source query to specify filter(s), projection(s), and transformation(s) which would all be pushed down to the analytical store. Below is a sample source-query that would only capture incremental records with Category = ‘Urban’, project only a subset of fields and apply a simple transformation.
Select ProductId, Product, Segment, concat(Manufacturer, ‘-‘, Category) as ManufacturerCategory

from c

where Category = ‘Urban’
Support for capturing deletes and intermediate updates
Analytical store CDC captures deleted records and intermediate updates. The captured deletes and updates can be applied on sinks that support delete and update operations. The {_rid} value uniquely identifies the records and so by specifying {_rid} as key column on the sink side, the updates and deletes would be reflected on the sink.
Filter change feed for a specific type of operation (Insert | Update | Delete | TTL)
You can filter the CDC feed for a specific type of operation. For example, you have the option to selectively capture the Insert and update operations only, thereby ignoring the user-delete and TTL-delete operations.
Support for schema alterations, flattening, row modifier transformations and partitioning
In addition to specifying filters, projections, and transformations via source query, you can also perform advanced schema operations such as flattening, applying advanced row modifier operations and dynamically partitioning the data based on the given key.
Efficient incremental data capture with internally managed checkpoints
Each change in Cosmos DB container appears exactly once in the CDC feed, and the checkpoints are managed internally for you. This helps to address the below disadvantages of the common pattern of using custom checkpoints based on the “_ts” value:
- The “_ts” filter is applied against the data files which does not always guarantee minimal data scan. The internally managed GLSN based checkpoints in the new CDC capability ensure that the incremental data identification is done, just based on the metadata and so guarantees minimal data scanning in each stream.
- The analytical store sync process does not guarantee “_ts” based ordering which means that there could be cases where an incremental record’s “_ts” is lesser than the last checkpointed “_ts” and could be missed out in the incremental stream. The new CDC does not consider “_ts” to identify the incremental records and thus guarantees that none of the incremental records are missed.
With CDC, there’s no limitation around the fixed data retention period for which changes are available. Multiple change feeds on the same container can be consumed simultaneously. Changes can be synchronized from “the Beginning” or “from a given timestamp” or “from now”.
Please note that the linked service interface for Azure Cosmos DB for MongoDB API is not available on Dataflow yet. However, you would be able to use your account’s document endpoint with the “Azure Cosmos DB for NoSQL” linked service interface as a workaround until the Mongo linked service is supported.
Eg: ON a NoSQL linked service, choose “Enter Manually” to provide the Cosmos DB account info and use the account’s document endpoint (eg: https://.documents.azure.com:443/) instead of the Mongo endpoint (eg: mongodb://.mongo.cosmos.azure.com:10255/)
Next steps
To learn more, please see our documentation on Change Data Capture in Azure Cosmos DB analytical store.
by Contributed | Mar 29, 2023 | Technology
This article is contributed. See the original author and article here.
Azure Backup recently announced the general availability of immutable vaults that offer improved protection for your backup data better against ransomware attacks and other malicious actors. Immutable vaults protect your backups by blocking any operations that could lead to loss of recovery points if misused. Further, you can lock the immutability setting to make it irreversible, which can prevent malicious actors from disabling immutability and deleting backups.
Immutability is generally available for Recovery Services vaults as well as Backup vaults.
How it works
Backup data stored using Azure Backup is not accessible directly and the only way to access or manage this data is through the vault. Immutable vaults further help you by preventing any operations that, if used by malicious actors, could lead to the loss of backups. The Immutable vault setting on your vault enables you to block such operations to ensure that your backup data is protected, even if any malicious actors try to delete them to affect the recoverability of data.
The following operations are protected when using immutable vaults:
For Recovery Services vaults:
Operation type
|
Description
|
Stop protection with delete data
|
A protected item can’t have its recovery points deleted before their respective expiry date. However, you can still stop protection of the instances while retaining data forever or until their expiry.
|
Modify backup policy to reduce retention
|
Any actions that reduce the retention period in a backup policy are disallowed on Immutable vault. However, you can make policy changes that result in the increase of retention. You can also make changes to the schedule of a backup policy.
|
Change backup policy to reduce retention
|
Any attempt to replace a backup policy associated with a backup item with another policy with retention lower than the existing one is blocked. However, you can replace a policy with the one that has higher retention.
|
For Backup vaults:
Operation type
|
Description
|
Stop protection with delete data
|
A protected item can’t have its recovery points deleted before their respective expiry date. However, you can still stop protection of the instances while retaining data forever or until their expiry.
|
Enabling immutability and making it irreversible
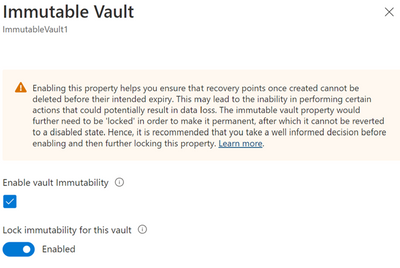
Enabling a vault to be immutable restricts performing certain operations on your backups. So, Azure Backup provides you an opportunity to ensure all your configurations are as per your requirements before you lock immutability to make it irreversible. Hence, when it comes to immutability your vault can have one of the following states for the setting:
State of Immutable vault setting
|
Description
|
Disabled
|
The vault doesn’t have immutability enabled and no operations are blocked.
|
Enabled
|
The vault has immutability enabled and doesn’t allow operations that could result in loss of backups.
However, the setting can be disabled.
|
Enabled and locked
|
The vault has immutability enabled and doesn’t allow operations that could result in loss of backups.
As the Immutable vault setting is now locked, it can’t be disabled.
Note that immutability locking is irreversible, so ensure that you take a well-informed decision when opting to lock.
|
You can enable immutability and then make it irreversible (or ‘lock’ it) through vault properties.
Learn more
Check out this article to learn more about immutable vaults for Azure Backup.
by Contributed | Mar 28, 2023 | Technology
This article is contributed. See the original author and article here.
Training large AI models on Azure using CycleCloud + Slurm
In the past year generative AI models have leapt into common discourse through the popularity of text-to-image models and services such as DALL-E and Stable Diffusion, but especially through the explosion in knowledge and use of chatbots like ChatGPT and their integration into apps and services like Bing Search.
These models implement variations on the transformer architecture which has dominated natural language processing (NLP) tasks since its introduction in the “Attention is all you need” (Vashwani et al.) paper in 2017. These models have been shown to be very effective in a range of tasks including machine translation, summarization, named entity recognition, and question answering. Remarkably, the models demonstrate a scaling in capabilities correlated with an increase in model size and training data without task specific training leading to the notion of referring to these models as “foundational models” (e.g. “Scaling Laws for Neural Language models” (Kaplan et al. 2020), “Scaling Laws for Autoregressive Generative Modeling” (Henighan et al. (2020)). This scaling property has led to an explosion in the growth in both the size of the model (the number trainable parameters) and the size of the training data used to train these models. The same increase in demand for model sizes results in surging demand for GPU clusters of sufficient size to not only fit the entire model in memory, but to train as quickly possible.
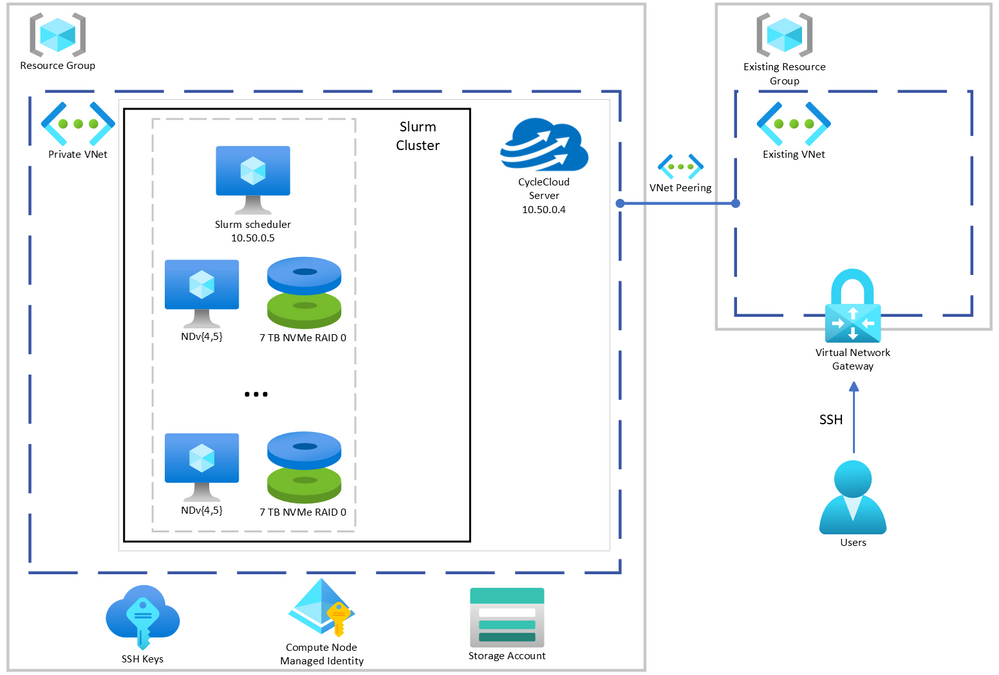
Here we demonstrate and provide template to deploy a computing environment optimized to train a transformer-based large language model on Azure using CycleCloud, a tool to orchestrate and manage HPC environments, to provision a cluster comprised of A100, or H100, nodes managed by Slurm. Such environments have been deployed to train foundational models with 10-100s billions of parameters on terabytes of data.
Provision the Slurm cluster
In this demonstration we’re going to use Terraform to provision the infrastructure required to create a Slurm cluster managed by CycleCloud. [C]loud-init will be used to install CycleCloud on a provisioned VM and CycleCloud will then be configured with an admin account and a pre-configured Slurm cluster.
A few key features of this deployment are:
Use of Terraform as Infrastructure-as-Code tool to deploy CycleCloud
Use of Slurm as the batch scheduler
Support for container-based workloads using enroot and pyxis
- Integration with PMIx to support efficient large-scale training
Integration with Node Health Check(NHC) to monitor and automatically detect common hardware issue that may slow down or stop the training
Configuration for key variables supplied through environment variables – Installation and configuration of CycleCloud and Slurm using cloud-init
Not demonstrated here for simplicity, but potentially useful, are:
- Use of Slurm accounting to track resource usage
- Use of Azure NetApp Files, or Azure Managed Lustre FS, as the shared filesystem for better performance if appropriate for your workload
.png") CycleCloud + Slurm managed GPU cluster system architecture described here.
CycleCloud + Slurm managed GPU cluster system architecture described here.
Prerequisites
The steps described here require the following:
Deploy Cyclecloud
The first step is to set variables used to configure the deployment. Copy the provided .envrc-template to .envrc and set the variables to values appropriate for your deployment. Then source the file to set the variables in your environment.
.envrc is configured to be ignored by git in .gitignore so that you can set your own values without accidentally committing them.
$ source .envrc
Next, we will provision the infrastructure required to deploy the cluster. Note, this only provisions the infrastructure required for CycleCloud. Note that this does not provision any of the Slurm cluster compute resources which will be provisioned later using CycleCloud (See Start the cluster).
Specifically, we will provision (defined in main.tf):
- A new resource group
- A new virtual network and subnet
- A new storage account without hierarchical namespace to work with CycleCloud
- A storage container for use with CycleCloud
We’ll also provision (defined in cycleserver.tf:(
- A new network interface
- A new VM to run CycleCloud which will be configured using cloud-init to install and configure CycleCloud with an admin account and a Slurm cluster with a SystemManaged identity with “Contributor” permissions on the resource group so that it can create and manage resources in the cluster (i.e. create the VMs required for the cluster)
All of the variables used in the provisioning of infrastructure and configuration of CycleCloud and Slurm are defined in variables.tf. The variables set in set-env.sh provide values for these variables.
First, we’ll initialize Terraform and ensure the required providers are installed.
$ terraform init
Then we’ll plan the deployment and save the plan to a file so that we can review the plan before applying it.
$ terraform plan -out=plan.out
Finally, after everything looks acceptable, we will apply the plan to provision the infrastructure except for the CycleCloud VM.
$ terraform apply “plan.out”
Once that has completed, you must (re-)connect to the existing virtual network gateway (VPN) to deploy the CycleCloud VM because multiple configuration files are copied to the VM by Terraform. Provision the VM by running the following commands (notice the extra environmental variable create_cyclecloud_vm which defaults to false):
$ terraform plan -out=plan.out -var “create_cyclecloud_vm=true”
$ terraform apply “plan.out”
Assuming the deployment is successful, you should see output similar to the following:
Apply complete! Resources: 2 added, 6 changed, 0 destroyed.

Outputs:

 cyclecloud_vm_ip = "10.50.0.4"
Start the cluster
The installation and configuration of CycleCloud takes another 4-5 minutes after the Terraform provisioning is completed. Once the deployment is complete you can connect to the CycleCloud web app on port 8080 (e.g. 10.50.0.4:8080) using the credentials you provided in set-env.sh. Once logged into the CycleCloud web app, you should see a cluster named slurm in the list of clusters. Once logged in, verify the desired configuration of the cluster by pressing the Edit button on the Cluster page.
 CycleCloud webapp.
In particular, verify the following:
- “MSI Identify” is configured with “cyclecloud-node” (defined in main.tf)
- “HPC VM Type” is the desired type
- “Max HPC Cores” is the desired number of cores for the cluster (NDv4 have 96 cores, so 192 cores would be 2 nodes and 16 A100 GPUs)
- “Max VMs per Scale Set” is the desired number of VMs per scale set (Max can be 300 unless you’ve made other special arrangements)
- “Subnet ID” is the subnet ID of the default subnet created by Terraform
- “Network Attached Storage”, the shared NFS configuration:
- “Size (GB)” is the desired size of the shared filesystem. This is the total size of the filesystem used for home directories, not the local scratch space on the VMs.
- “Credentials” is the correct that you provided through the environmental variables
- “{Scheduler, Login Cluster, HP Cluster}-init” included appropriate projects.
- “cc_misc_ndv4”, “cc_slurm_nhc”, “cc_slurm_pyxis_enroot” is appropriate for compute VMs
- “cc_misc_ubuntu” is appropriate for all vms
- “Public Head Node” – check if public IP is for scheduler is desired
Then start the cluster by pressing the Start button on the Cluster page.
The scheduler node will take a few minutes to start. Once the scheduler node is provisioned, start the compute nodes by right-clicking the “hpc” labeled row under “Template” and selecting “Start” from the “Actions” pull-down menu. Note that provisioning NDv4 VMs can take up to 20 minutes.
Verify performance of cluster
An essential component of training at scale is the ability to monitor and detect hardware issues. To verify that the cluster is configured and operating as expected, Node Health Checks are deployed and configured as part of the CycleCloud deployment. Included in this are checks on each node for:
- disk issues
- IB network issues
- NCCL bandwidth issues
- GPU issues
If any problems are detected by NHC checks, the node will be put into a “drained” state by Slurm and will not be used when submitting jobs.
To verify optimal performance when using distributed training, NCCL tests can also be run to measure the bandwidth between nodes and GPUs on the cluster. Here we use a set of scripts that allow us to verify distributed all-reduce performance on the cluster using scripts from the azurehpc collection of scripts. Specifically, we can test NCCL tests without Slurm, using Slurm, and using Slurm with containers.
Connect to the scheduler node via SSH. You can get the IP address of the scheduler node from the CycleCloud web app by clicking on “scheduler” node which brings up a new lower pane, then clicking on “Connect” (see figure below), or it will be 10.50.0.5 if the same IPs are used as provided in the .envrc-template.
 CycleCloud webapp cluster administration panes.
$ ssh -i cyclecloud@
Then connect to a compute node because one of the steps requires a GPU to be available.
$ slogin slurm-hpc-pg0-1
Clone the Git repo and cd to the directory nccl-tests:
$ git clone https://github.com/yosoyjay/cyclecloud-llm.git
$ cd cyclecloud-llm/nccl-tests
A convenience script make-hostfile.py is provided to create a hostfile from output of sinfo which lists the nodes to be used in in the test not launched with Slurm.
$ python make-hostfile.py
Next, run the all reduce test without Slurm. The output logs printed to stdout should show all reduce bandwidth greater than 185 GB/s for two or more nodes for the largest message sizes. E.g.
...

  2147483648     536870912     float     sum    21495   99.91  187.33  5e-07    21563   99.59  186.74  5e-07

  4294967296    1073741824     float     sum    42741  100.49  188.42  5e-07    42679  100.63  188.69  5e-07

  8589934592    2147483648     float     sum    84929  101.14  189.64  5e-07    85013  101.04  189.45  5e-07

...
To test on two nodes (16 GPUs):
$ all-reduce.sh 16 hostfiles.txt
Next run NCCL tests with Slurm on NP processors:
$ sbatch -N $NP all-reduce.sh
And, finally, run NCCL tests with Slurm and containers on NP processors:
$ sbatch -N $NP all-reduce-containers.sh
Benchmarking / training a Large Language Model (OPT-175B)
As an example, we’ll benchmark a smaller 175M parameter version of a 175B parameter LLM on 16 A100 GPUs using Metaseq and following the directions in the Metaseq README. Note that this example does not use containerized models, but the cluster is configured to support such workloads.
Prepare the environment
Now the Python environment can be created and populated with the required libraries.
Step 1. Create Python environment
This benchmark is run on bare metal in a Python virtual environment following the instructions in the Metaseq README.
Here we install Python environment using miniconda:
$ curl -fsO https://repo.anaconda.com/miniconda/Miniconda3-latest-Linux-x86_64.sh
$ bash Miniconda3-latest-Linux-x86_64.sh -b -p $HOME/miniconda
$ $HOME/miniconda/bin/conda init
Create and activate conda environment:
$ source $HOME/.bashrc
$ conda create -y -c conda-forge --name fairseq python=3.9
$ conda activate fairseq
Then, install the prerequisites pip.
The the version of torch specified in the requirements should match the CUDA version of the VM. Check CUDA version with nvcc –version and then install the appropriate version of torch, e.g.: CUDA 11.6 -> torch==1.10.0+cu116.
Note that the PyTorch version packaged for CUDA 11.3 works with CUDA 11.4 (the version shipped with Ubuntu 18.04 HPC images), see Github issue.
$ pip install -r requirements.txt -f https://download.pytorch.org/whl/torch_stable.html
Step 2. Install NVIDIA Apex to enable training optimizations
Install the Apex extension to PyTorch to enable mixed precision and distributed training optimizations.
In some cases, as in when VM CUDA version is 11.4 and PyTorch is 1.10.0+cu113, one must disable a check in the Apex setup script. This is currently done by removing the line in the setup.py file as done with the sed command below.
This is the step that must be performed on a device with a GPU, so log into a compute node if not already on one (e.g. slogin slurm-hpc-pg0-1). Then run the following commands:
$ git clone https://github.com/NVIDIA/apex
$ pushd apex
$ sed -i "s/check_cuda_torch_binary_vs_bare_metal(CUDA_HOME)//g" setup.py
$ python -m pip install -v --no-cache-dir --global-option="--cpp_ext"
    --global-option="--cuda_ext"
    --global-option="--deprecated_fused_adam"
    --global-option="--xentropy"
    --global-option="--fast_multihead_attn" .
$ popd
Step 4. Install Metaseq
Install Megatron fork as specified in the Metaseq README.
$ git clone https://github.com/ngoyal2707/Megatron-LM.git
$ pushd Megatron-LM
$ git checkout fairseq_v3
$ pip install -e .
$ popd
Step 5. Install Fairscale
Note, this install via pip is not editable (i.e. no -e) as the metaseq/train.py checks the fairscale version which will not be defined if installed in editable mode.
$ git clone https://github.com/facebookresearch/fairscale.git
$ pushd fairscale
$ git checkout fixing_memory_issues_with_keeping_overlap
$ pip install .
$ popd
Now you can return to the scheduler node (e.g. ctrl-d).
These steps have been aggregated into a single script install-opt175.sh which should be run from a compute node to meet the requirement of having a GPU device locally available for compilation of Apex.
Run OPT benchmark with synthetic data
Ensure Python environment is activated and environmental variables are set for optimal performance, e.g.:
$ conda activate fairseq
$ source nccl-env-var.sh
If on a stand-alone VM specify a 125M parameter model as that will fit in memory:
$ time opt-baselines --model-size 125m --benchmark -t 1 -g 8 -n 128 -p test-125m --local --azure
If on Slurm cluster using NP nodes and model size of your choosing, e.g. 175B:
$ time opt-baselines --model-size 175b --benchmark -t $NP -g 8 -n 128 -p test-125m --azure
On a single instance of an Azure VM Standard_ND96amsr_A100_v4 VM (8 x 80GB SMX A100) this took ~2.5 minutes with a training rate of at least 200K words per second.
Summary
In this post we’ve outlined the steps to provision a Slurm managed GPU cluster on Azure using CycleCloud. We then demonstrated how to verify correct and optimal configuration of the cluster using NCCL and NHC tests. Finally, we described how to prepare a Python conda environment with the libraries and optimizations required to benchmark and train OPT models.
All scripts and templates used here are available at https://github.com/yosoyjay/cyclecloud-llm and additional information about Azure HPC can be found at https://azure.com/hpc.
by Contributed | Mar 27, 2023 | Technology
This article is contributed. See the original author and article here.
We’re excited to announce that version 4 of the Node.js programming model is currently in preview! This programming model is part of Azure Function’s larger effort to provide a more flexible and intuitive experience for all supported languages. If you follow news from Functions closely or happen to use Python as well, you may have heard about the release of the new programming model for Python last fall. During that time, we were working on a similar effort for Node.js. The experience we ship today is a culmination of feedback we received from JavaScript and TypeScript developers through GitHub, surveys, and user studies, as well as suggestions from internal Node.js experts working closely with customers.
What’s improved in the V4 model?
In this section, we highlight several key improvements made in the V4 programming model.
Flexible folder structure
The existing V3 model requires that each trigger be in its own directory, with its own function.json file. This strict structure can make it hard to manage if an app has many triggers. And if you’re a Durable Functions user, having your orchestration, activity, and client functions in different directories decreases code readability, because you have to switch between directories to look at the components of one logical unit. The V4 model removes the strict directory structure and gives users the flexibility to organize triggers in ways that makes sense to their Function app. For example, you can have multiple related triggers in one file or have triggers in separate files that are grouped in one directory.
Furthermore, you no longer need to keep a function.json file for each trigger you have in the V4 model as bindings are configured in code! See the HTTP example in the next section and the Durable Functions example in the “More Examples” section.
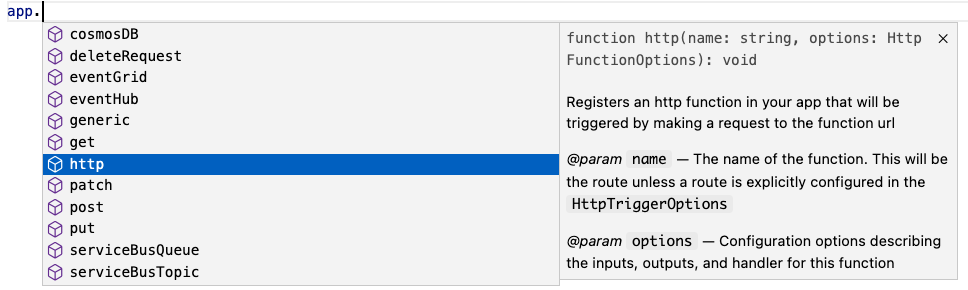
Define function in code
The V4 model uses an app object as the entry point for registering functions instead of function.json files. For example, to register an HTTP trigger responding to a GET request, you can call app.http() or app.get() which was modeled after other Node.js frameworks like Express.js that also support app.get(). The following shows what has changed when writing an HTTP trigger in the V4 model:
V3 |
V4 |
module.exports = async function (context, req) {
  context.log('HTTP function processed a request');

  const name = req.query.name
    || req.body
    || 'world';

  context.res = {
    body: `Hello, ${name}!`
  };
};
|
const { app } = require("@azure/functions");

app.http('helloWorld1', {
  methods: ['GET', 'POST'],
  handler: async (request, context) => {
    context.log('Http function processed request');

    const name = request.query.get('name')
      || await request.text()
      || 'world';

    return { body: `Hello, ${name}!` };
  }
});
|
{
  "bindings": [
    {
      "authLevel": "anonymous",
      "type": "httpTrigger",
      "direction": "in",
      "name": "req",
      "methods": [
        "get",
        "post"
      ]
    },
    {
      "type": "http",
      "direction": "out",
      "name": "res"
    }
  ]
}
|
 Nothing Nothing |
Trigger configuration like methods and authLevel that were specified in a function.json file before are moved to the code itself in V4. We also set several defaults for you, which is why you don’t see authLevel or an output binding in the V4 example.
New HTTP Types
In the V4 model, we’ve adjusted the HTTP request and response types to be a subset of the fetch standard instead of types unique to Azure Functions. We use Node.js’s undici package, which follows the fetch standard and is currently being integrated into Node.js core.
HttpRequest – body
V3 |
V4 |
// returns a string, object, or Buffer
const body = request.body;
// returns a string
const body = request.rawBody;
// returns a Buffer
const body = request.bufferBody;
// returns an object representing a form
const body = await request.parseFormBody();
|
const body = await request.text();
const body = await request.json();
const body = await request.formData();
const body = await request.arrayBuffer();
const body = await request.blob();
|
HttpResponse – status
V3 |
V4
|
context.res.status(200);

context.res = { status: 200}
context.res = { statusCode: 200 };

return { status: 200};
return { statusCode: 200 };
|
return { status: 200 };
|
To see how other properties like header, query parameters, etc. have changed, see our developer guide.
Better IntelliSense
If you’re not familiar with IntelliSense, it covers the features in your editor like autocomplete and documentation directly while you code. We’re big fans of IntelliSense and we hope you are too because it was a priority for us from the initial design stages. The V4 model supports IntelliSense for JavaScript for the first time, and improves on the IntelliSense for TypeScript that already existed in V3. Here are a few examples:

More Examples
NOTE: One of the priorities of the V4 programming model is to ensure parity between JavaScript and TypeScript support. You can use either language to write all the examples in this article, but we only show one language for the sake of article length.
Timer (TypeScript)
A timer trigger that runs every 5 minutes:
import { app, InvocationContext, Timer } from '@azure/functions';

export async function timerTrigger1(myTimer: Timer, context: InvocationContext): Promise {
    context.log('Timer function processed request.');
}

app.timer('timerTrigger1', {
    schedule: '0 */5 * * * *',
    handler: timerTrigger1,
});
Durable Functions (TypeScript)
Like in the V3 model, you need the durable-functions package in addition to @azure/functions to write Durable Functions in the V4 model. The example below shows one of the common patterns Durable Functions is useful for – function chaining. In this case, we’re executing a sequence of (simple) functions in a particular order.
import { app, HttpHandler, HttpRequest, HttpResponse, InvocationContext } from '@azure/functions';
import * as df from 'durable-functions';
import { ActivityHandler, OrchestrationContext, OrchestrationHandler } from 'durable-functions';

// Replace with the name of your Durable Functions Activity
const activityName = 'hello';

const orchestrator: OrchestrationHandler = function* (context: OrchestrationContext) {
    const outputs = [];
    outputs.push(yield context.df.callActivity(activityName, 'Tokyo'));
    outputs.push(yield context.df.callActivity(activityName, 'Seattle'));
    outputs.push(yield context.df.callActivity(activityName, 'Cairo'));

    return outputs;
};
df.app.orchestration('durableOrchestrator1', orchestrator);

const helloActivity: ActivityHandler = (input: string): string => {
    return `Hello, ${input}`;
};
df.app.activity(activityName, { handler: helloActivity });

const httpStart: HttpHandler = async (request: HttpRequest, context: InvocationContext): Promise => {
    const client = df.getClient(context);
    const body: unknown = await request.text();
    const instanceId: string = await client.startNew(request.params.orchestratorName, { input: body });

    context.log(`Started orchestration with ID = '${instanceId}'.`);

    return client.createCheckStatusResponse(request, instanceId);
};

app.http('durableOrchestrationStart1', {
    route: 'orchestrators/{orchestratorName}',
    extraInputs: [df.input.durableClient()],
    handler: httpStart,
});
In Lines 8-16, we set up and register an orchestration function. In the V4 model, instead of registering the orchestration trigger in function.json, you simply do it through the app object on the durable-functions module (here df). Similar logic applies to the activity (Lines 18-21), client (Lines 23-37), and Entity functions. This means you no longer have to manage multiple function.json files just to get a simple Durable Functions app working!
Lines 23-37 set up and register a client function to start the orchestration. To do that, we pass in an input object from the durable-functions module to the extraInputs array to register the function. Like in the V3 model, we obtain the Durable Client using df.getClient() to execute orchestration management operations like starting a new orchestration. We use an HTTP trigger in this example, but you could use any trigger supported by Azure Functions such as a timer trigger or Service Bus trigger.
Refer to this example to see how to write a Durable Entity with the V4 model.
How to get started
Check out our Quickstarts to get started:
See our Developer Guide to learn more about the V4 model. We’ve also created an upgrade guide to help migrate existing V3 apps to V4.
Please give the V4 model a try and let us know your thoughts so we can enhance the experience further in the General Availability release!
If you have questions and/or suggestions, please feel free to drop an issue in our GitHub repo. As this is an open-source project, like most in Azure Functions, we also welcome any PR contributions from the community 

Recent Comments