
by Contributed | Jan 30, 2024 | Technology
This article is contributed. See the original author and article here.
Since HCI 23h2 was announced, HCIBox users have been asking me and the Jumpstart team, “when will HCIBox be ready?” Some are interested in the new cloud deployment features, others are curious about a refreshed AKS on HCI. The wait is over. At last, HCIBox 23H2 is here and ready for you to get hands-on.
HCIBox now supports Azure Stack HCI 23H2 and is ready to offer the latest capabilities of Azure edge environments with native Azure Arc and AKS integration in a self-contained sandbox. This sandbox deploys easily into an Azure subscription, and uses nested virtualization to emulate an HCI cluster inside an Azure VM. This allows users to experience many Azure Stack HCI 23H2 features like the new cloud deployment feature with minimal manual effort. HCIBox automatically generates a ready-to-go ARM template that can be used to deploy a new HCI cluster. The cloud deployment also automatically provisions Arc resource bridge and AKS components, and HCIBox comes with additional modules to showcase cloud VM management and AKS on HCI.
As part of this release, most aspects of the HCIBox codebase were refactored to simplify and streamline the deployment experience. The network configuration has also been redesigned, with dedicated subnets for both guest VM management and AKS.
Many aspects of the HCIBox provisioning process have changed with this release and we encourage all users to thoroughly review the updated documentation. Be sure to also check out our new Jumpstart Lightning video where we discuss the new release. Get started with HCIBox today!

by Contributed | Jan 29, 2024 | Business, Microsoft 365, Technology
This article is contributed. See the original author and article here.
This blog is the second of three that details our recommendation to adopt cloud native device management. Understand the lessons from various Intune customers in their journeys and how they achieved greater security, cost savings, and readiness for the future through their cloud transformations.
The post Best practices in moving to cloud native endpoint management appeared first on Microsoft 365 Blog.
Brought to you by Dr. Ware, Microsoft Office 365 Silver Partner, Charleston SC.
by Contributed | Jan 29, 2024 | Technology
This article is contributed. See the original author and article here.
AnnounceBot Automated and Personalized Greetings, a solution published to Microsoft AppSource, helps companies celebrate special occasions like birthdays, work anniversaries, and welcoming new hires. With minimal setup and no calendars or manual work, AnnounceBot increases engagement, collaboration, and retention.
Microsoft interviewed Stephen Cornell, Service Director, Protected Trust, to learn what he had to say about the app.
What do you like best about AnnounceBot?
We absolutely love how easy AnnounceBot is to use! It is user-friendly, and setting it up was quick. Before using AnnounceBot, social media was our only way to track birthdays, which means some folks got left out. And work anniversaries were out of the picture. Since we started using AnnounceBot, we have never missed a birthday or work anniversary. It’s all automatic now.
How has AnnounceBot helped your organization?
Keeping the team engaged became challenging when we transitioned into working remotely. AnnounceBot helped us rebuild team connections by providing a centralized system to celebrate special events. Now, everyone engages in birthday and work anniversary posts, makes jokes, and tells stories about times we were all together in an office. It is a small gesture that has made a big difference in our company culture.
How is customer service and support?
I wanted to know how to check birthdays that are getting tracked. The support team responded within an hour and provided the information I needed.
Any recommendations or insights for other users considering AnnounceBot?
My suggestion would be to set it up in a small team first, just to get the hang of it. Test it out there before you go big and use it for the whole organization.
On a scale from 1 to 5 (5 being the highest), what is your overall rating for this AnnounceBot?
I would give AnnounceBot a 4.5 only because I think they should support Microsoft Entra ID (formerly Azure Active Directory) integration to make birthdate and joining date collection even smoother.
by Contributed | Jan 28, 2024 | Technology
This article is contributed. See the original author and article here.
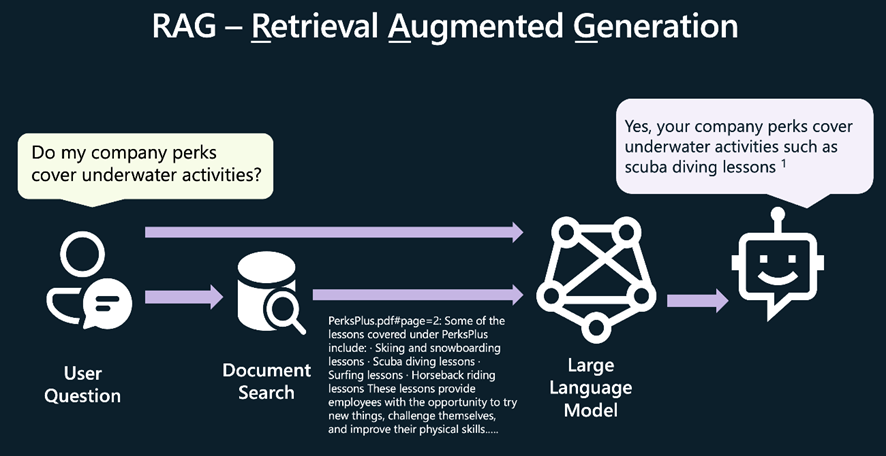
En los últimos seis meses, hemos conocido a cientos de desarrolladores que están utilizando Python para crear aplicaciones de chat de IA en sus propios campos de conocimiento, utilizando RAG (Recuperación Aumentada de Generación) para enviar fragmentos de información a un modelo de LLM junto con la pregunta del usuario.
También hemos escuchado a muchos desarrolladores que les gustaría aprender a crear sus propias aplicaciones de chat con RAG, pero no saben por dónde empezar. Por eso, estamos organizando un hackathon virtual para ayudarte a aprender a construir tu propia aplicación de chat con RAG en Python.
Del 29 de enero al 12 de febrero, realizaremos transmisiones en vivo en inglés y los días 31 de enero y 2 de febrero en español, donde te mostraremos cómo construir en nuestro repositorio de ejemplo de chat con RAG más popular, al mismo tiempo que explicamos los conceptos clave detrás de todas las aplicaciones de chat con RAG modernas. Los temas de las transmisiones en vivo incluirán búsqueda vectorial, control de acceso, GPT-4 con visión y más.
Mantente conectado a tus sesiones locales de Reactor. Esperamos involucrar a desarrolladores de todo el mundo, así que también tendremos transmisiones en vivo en español, portugués y chino. Habrá premios para las mejores aplicaciones e incluso un premio para el miembro más útil de la comunidad. ¡Mantente atento a tus sesiones locales de Reactor!
Para obtener más información, visita la página de Reactor para sintonizar tu evento local y visita la página AI Chat App Hack, donde podrás seguir los pasos para registrarte y unirte a la comunidad. ¡Te esperamos ya!
Más recursos de RAG para desarrolladores de Python:
• Tutorial: Introducción al ejemplo de chat corporativo en Python utilizando RAG
• GitHub Universe: Crea e implementa rápidamente aplicaciones de OpenAI en Azure, infusionadas con tus propios datos
• Recursos de IA de Azure para desarrolladores Python
• Utilizando Llamaindex con Azure AI Search
• Comunidad de IA en Discord
by Contributed | Jan 26, 2024 | Technology
This article is contributed. See the original author and article here.
The linked blog post was originally published on the Microsoft Security Blog on November 6th, 2023. We are sharing it again on the SMB Tech Community blog channel to ensure that all of our partners, who manage customer tenants and their conditional access policies, are informed about the upcoming policy changes.
Microsoft announced the automatic rollout of Conditional Access polices in Entra ID back in November 2023.
This feature automatically creates new Conditional Access policies in report-only mode for eligible customers of Microsoft Entra ID P1/P2 (M365 E3/M365 E5/M365 Business Premium). Between November 9th, 2023, and December 31st, 2023, policies were created in all eligible tenants. Customers will have at least 90 days to review the policy’s impact, manage exclusions, turn the policy on, or turn it off if necessary.
This 90-day period is ending soon, and enforcement will begin on a rolling basis in February and March 2024.
Recommended actions
To avoid any potential disruption to users’ access and to ensure these policies meet your organization’s needs, take the following actions within 90 days of their creation, before they’re moved to the On state:
- Read the original blog announcement By Alex Weinert, Vice President, Identity Security
- Review the effects and benefits of the new policies. If you don’t want us to enable them automatically, set them to Off. Or, you may set them to On at any time.
- Customize these policies according to your specific needs, such as excluding emergency access accounts. If you require more extensive customizations, you can clone a policy and then make as many changes as you want.
- Verify that all users covered by these policies have enabled and registered at least one multifactor authentication method. If necessary, run a registration campaign to set up the Authenticator app.
Learn more: Automatic Conditional Access policies in Microsoft Entra streamline identity protection | Microsoft Security Blog


Recent Comments